GEMM Lab 2018: A Year in the Life

By Dawn Barlow, PhD student, Department of Fisheries & Wildlife, Geospatial Ecology of Marine Megafauna Lab

As 2018 draws to a close, it is gratifying to step back and appreciate the accomplishments of the past year. For all members of the GEMM Lab, 2018 has certainly been one for the books! Here are some of our highlights for your holiday enjoyment.

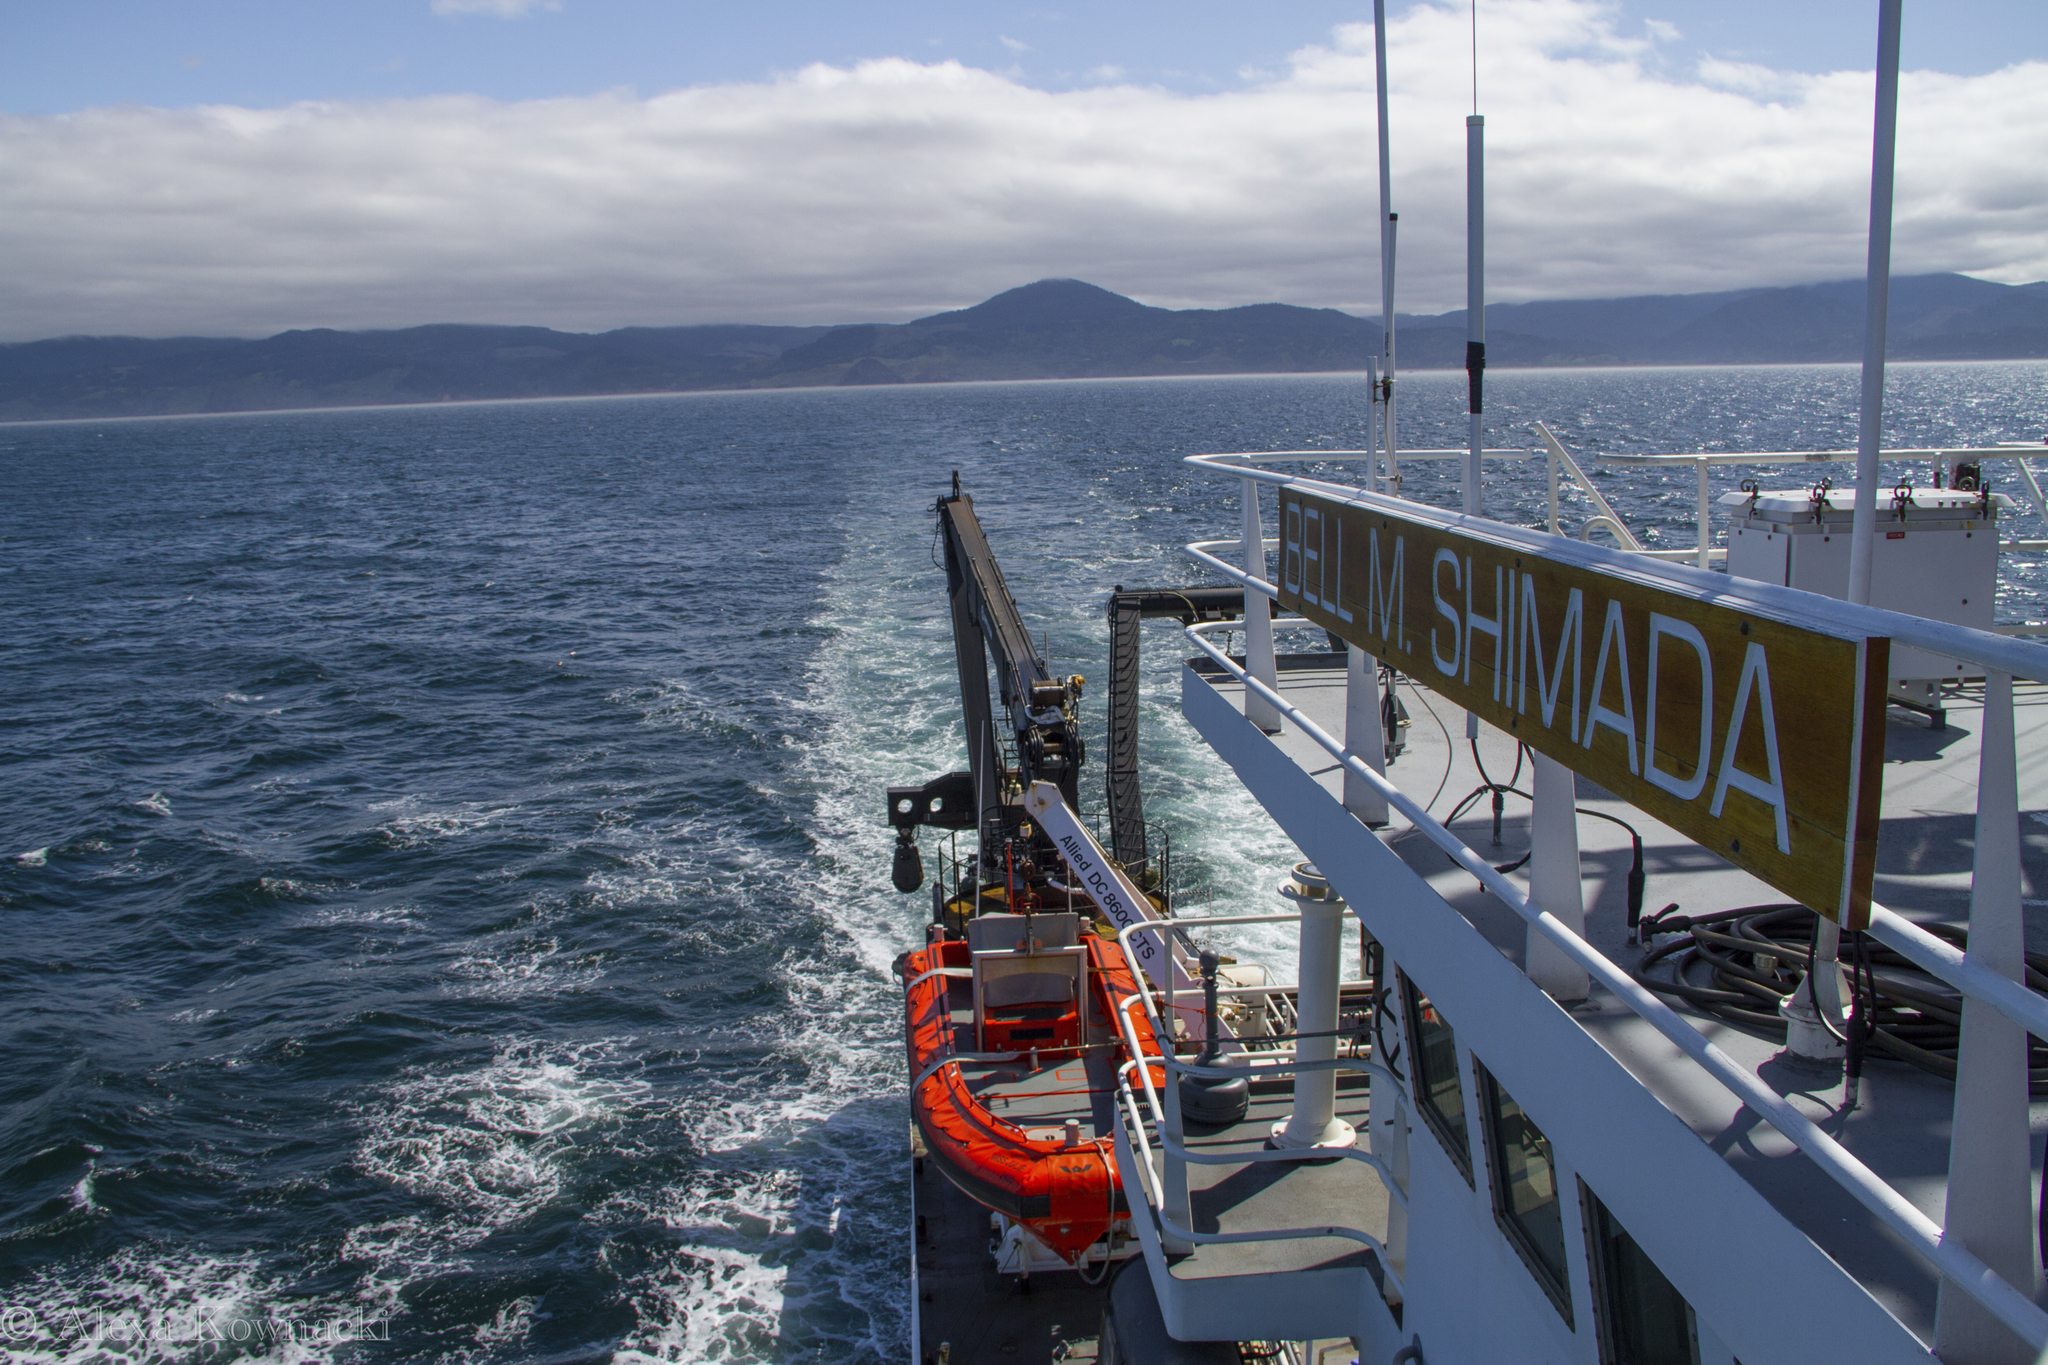
We conducted fieldwork to collect new data in multiple seasons, multiple hemispheres, and across oceans. For the first time, GEMM Lab members joined the Northern California Current Ecosystem cruises aboard NOAA ship Bell M. Shimada as marine mammal observers—Florence in February, Alexa in May, and me in September.

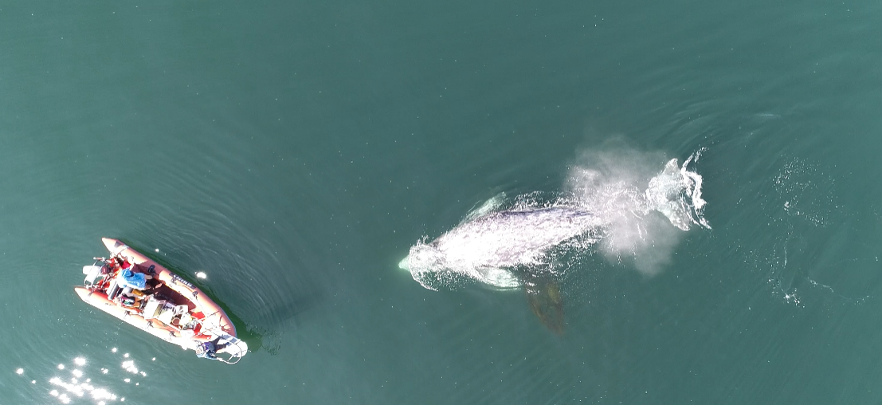
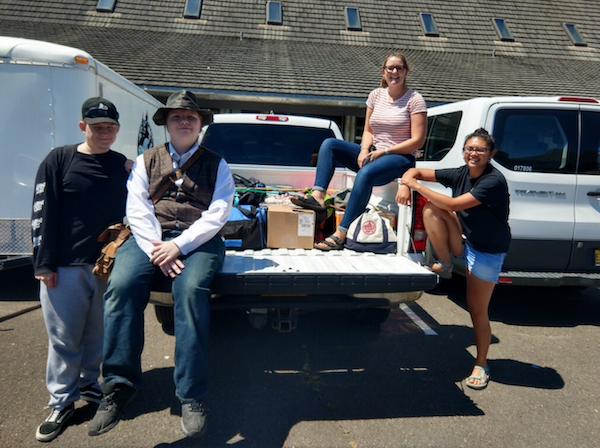
Summertime in the Pacific Northwest brings the gray whales to the Oregon Coast. The drone-flying, poop-scooping, plankton-trapping team of Leigh, Todd, Leila, Joe, and Sharon took to the water for the third year to investigate the health of this gray whale population. It was a successful field season, ending with 72 fecal samples collected! Visiting students joined our experienced members to shadow the gray whale fieldwork—Julia Stepanuk and Alejandro Fernandez Ajo came from across the country to hop on board with us for a bit. Friendship and collaboration were built quickly in a little boat chasing after whale poop, bonding over peanut butter and jelly sandwiches.

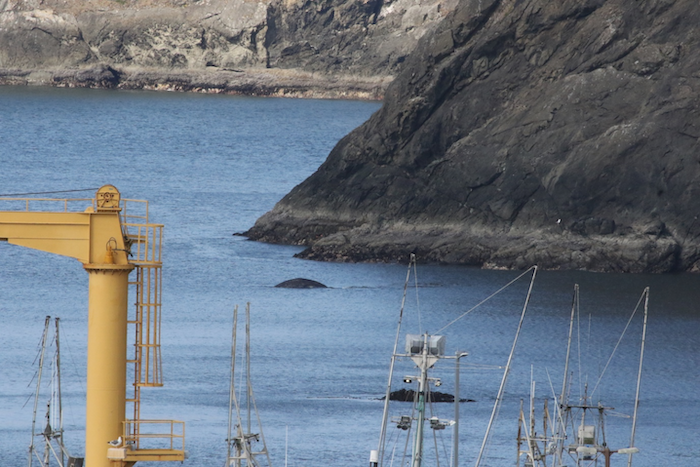
Another GEMM Lab team tracked the gray whales from the cliff in Port Orford. Lisa Hildebrand joined us as the GEMM Lab’s newest graduate student, and immediately led a team of interns on Oregon’s southern coast to track gray whale movements and sample their prey from a trusty research kayak.

The summer 2018 gray whale foraging ecology team, affectionately known as “team whale storm”, at the Port Orford Field Station.

Rachael observed seabirds from Yaquina Head in May and June, where the colony of common murres had the highest reproductive success in 10 years! Then she left the summertime in July to travel to the other end of the world, braving winter in the remote South Atlantic to study South American fur seals in the Falkland Islands.

Dr. Rachael Orben and Dr. Alistair Bayliss looking out towards the fur seals. Photo: Kayleigh Jones

In New Caledonia, Solene and a research team ventured to Antigonia Seamount and Orne Bank to study the use of these offshore areas by breeding humpback whales. They collected numerous biopsy samples and successfully deployed satellite tags. Solene was also selected to receive the Louis Herman research scholarship to continue studying humpback whale movement and diving behavior around seamounts.

Sorting biopsy samples during a successful expedition to study humpback whales around remote seamounts in the South Pacific.

Beyond fieldwork, our members have been busily disseminating our findings. In July, Leigh and I traveled to Wellington to present our latest findings on New Zealand blue whales to scientists, managers, politicians, industry representatives, and advocacy groups. Because of our documentation of a unique New Zealand blue whale population, which was published earlier this year, the New Zealand government has proposed to create a Marine Mammal Sanctuary for the protection of blue whales. This is quite a feat, considering blue whales were classified as only “migrant” in New Zealand waters prior to our work. Fueled by flat whites in wintery Wellington, we navigated government buildings, discussing blue whale distribution patterns, overlap with the oil and gas industry, what we now know based on our latest analyses, and what we consider to be the most pressing gaps in our knowledge.

Dr. Leigh Torres and Dawn Barlow in front of Parliament in Wellington, New Zealand following the presentation of their recent findings.

Alexa spent the summer and fall in San Diego, where she collaborated with researchers at NOAA Southwest Fisheries Science Center on her study of about the health of bottlenose dolphins off the California coast. Her time down south has been productive and we look forward to having her back in Oregon with us to round out the second year of her PhD program.

In the fall, Dom and Leigh participated in the first ever Oregon Sea Otter Status of Knowledge Symposium. With growing interest in a potential sea otter reintroduction, the symposium brought together a range of experts – including scientists, managers, and tribes – to discuss what we currently know about sea otters in other regions and how this knowledge could be applied to an Oregon reintroduction effort. Dom was one of many speakers at this event, and gave a well-received talk on Oregon’s previous sea otter reintroduction attempt and brief discussion on his thesis research. Over the next year, Dom not only plans to finish his thesis, but also to join an interdisciplinary research team to further investigate other social, genetic, and ecological implications of a potential sea otter reintroduction.

Sea otter mom and pup. Source: Hakai Magazine.
2018-19 OSU NRT Cohort. Source: Oregon State University.

Several GEMM Lab members reached academic milestones this year. Rachael was promoted to Assistant Professor in the spring! She now leads the Seabird Oceanography Lab, and remains involved in multiple projects studying seabirds and pinnipeds all over the world. Leila passed her PhD qualifying exams and advanced to candidacy in the spring, a major accomplishment toward completing her doctoral degree. I successfully defended my MS degree in June, and my photo was added to our wall gallery of GEMM Lab graduates. I won’t be leaving the GEMM Lab anytime soon, however, as I will be continuing my research on New Zealand blue whales as a PhD student. The GEMM Lab welcomed a new MS student in the summer—Lisa Hildebrand will be studying gray whale foraging ecology on the Oregon Coast. Welcome, Lisa! In early December, Solene successfully defended her PhD, officially becoming Dr. Derville. Congratulations to all on these milestones, and congratulations to Leigh for continuing to grow such a successful lab and guiding us all toward these accomplishments.

Dawn Barlow answers questions during her M.Sc. defense seminar.
Dr. Solene Derville and co-supervisors Dr. Claire Garrigue and Dr. Leigh Torres after a successful PhD Defense!

Perhaps you’re looking to do some reading over the holidays? The GEMM Lab has been publishing up a storm this year! The bulletin board outside our lab is overflowing with new papers. Summarizing our work and sharing our findings with the scientific community is a critical piece of what we do. The 21 new publications this year in 14 scientific journals include contributions from Leigh (13), Rachael (3), Solene (3), Leila (6), Florence (1), Amanda (1), Erin (1), Courtney (1), Theresa (1), and myself (3). Scroll down to the end of this post to see the complete list!

If you are reading this, thank you for your support of our lab, our members, and our work. Our successes come not only from our individual determination, but more importantly from our support of one another and the support of our communities. We look forward to what’s ahead in 2019. Happy holidays from the GEMM Lab!

The whole GEMM Lab (lab dogs included) gathered for an evening playing “Evolution” at Leigh’s house.

Barlow, D. R., Torres, L. G., Hodge, K. B., Steel, D., Baker, C. S., Chandler, T. E., Bott, N., Constantine, R., Double, M. C., Gill, P., Glasgow, D., Hamner, R. M., Lilley, C., Ogle, M., Olson, P. A., Peters, C., Stockin, K. A., Tessaglia-Hymes, C. T., & Klinck, H. (2018). Documentation of a New Zealand blue whale population based on multiple lines of evidence. Endangered Species Research36, 27-40.

Barlow, D. R., Fournet, M., & Sharpe, F. (2018). Incorporating tides into the acoustic ecology of humpback whales. Marine Mammal Science.

Baylis, A. M., Tierney, M., Orben, R. A., Staniland, I. J., & Brickle, P. (2018). Geographic variation in the foraging behaviour of South American fur seals. Marine Ecology Progress Series596, 233-245.

Bishop, A., Brown, C., Rehberg, M., Torres, L., & Horning, M. (2018). Juvenile Steller sea lion (Eumetopias jubatus) utilization distributions in the Gulf of Alaska. Movement ecology6(1), 6.

Burnett, J. D., Lemos, L., Barlow, D., Wing, M. G., Chandler, T., & Torres, L. G. (2018). Estimating morphometric attributes of baleen whales with photogrammetry from small UASs: A case study with blue and gray whales. Marine Mammal Science.

Cardoso, M. D., Lemos, L. S., Roges, E. M., de Moura, J. F., Tavares, D. C., Matias, C. A. R., … & Siciliano, S. (2018). A comprehensive survey of Aeromonas sp. and Vibrio sp. in seabirds from southeastern Brazil: outcomes for public health. Journal of applied microbiology124(5), 1283-1293.

Derville, S., Torres, L. G., Iovan, C., & Garrigue, C. (2018). Finding the right fit: Comparative cetacean distribution models using multiple data sources and statistical approaches. Diversity and Distributions24(11), 1657-1673.

Derville, S., Torres, L. G., & Garrigue, C. (2018). Social segregation of humpback whales in contrasted coastal and oceanic breeding habitats. Journal of Mammalogy99(1), 41-54.

Hann, C. H., Stelle, L. L., Szabo, A., & Torres, L. G. (2018). Obstacles and Opportunities of Using a Mobile App for Marine Mammal Research. ISPRS International Journal of Geo-Information7(5), 169.

Holdman, A. K., Haxel, J. H., Klinck, H., & Torres, L. G. (2018). Acoustic monitoring reveals the times and tides of harbor porpoise (Phocoena phocoena) distribution off central Oregon, USA. Marine Mammal Science.

Kirchner, T., Wiley, D. N., Hazen, E. L., Parks, S. E., Torres, L. G., & Friedlaender, A. S. (2018). Hierarchical foraging movement of humpback whales relative to the structure of their prey. Marine Ecology Progress Series607, 237-250.

Moura, J. F., Tavares, D. C., Lemos, L. S., Acevedo-Trejos, E., Saint’Pierre, T. D., Siciliano, S., & Merico, A. (2018). Interspecific variation of essential and non-essential trace elements in sympatric seabirds. Environmental pollution242, 470-479.

Moura, J. F., Tavares, D. C., Lemos, L. S., Silveira, V. V. B., Siciliano, S., & Hauser-Davis, R. A. (2018). Variation in mercury concentration in juvenile Magellanic penguins during their migration path along the Southwest Atlantic Ocean. Environmental Pollution238, 397-403.

Orben, R. A., Kokubun, N., Fleishman, A. B., Will, A. P., Yamamoto, T., Shaffer, S. A., Takahashi, A., & Kitaysky, A. S. (2018). Persistent annual migration patterns of a specialist seabird. Marine Ecology Progress Series593, 231-245.

Orben, R. A., Connor, A. J., Suryan, R. M., Ozaki, K., Sato, F., & Deguchi, T. (2018). Ontogenetic changes in at-sea distributions of immature short-tailed albatrosses Phoebastria albatrus. Endangered Species Research35, 23-37.

Pickett, E. P., Fraser, W. R., Patterson‐Fraser, D. L., Cimino, M. A., Torres, L. G., & Friedlaender, A. S. (2018). Spatial niche partitioning may promote coexistence of Pygoscelis penguins as climate‐induced sympatry occurs. Ecology and Evolution8(19), 9764-9778.

Siciliano, S., Moura, J. F., Tavares, D. C., Kehrig, H. A., Hauser-Davis, R. A., Moreira, I., Lavandier, R., Lemos, L. S., & Quinete, N. S. (2018). Legacy Contamination in Estuarine Dolphin Species From the South American Coast. In Marine Mammal Ecotoxicology (pp. 95-116). Academic Press.

Sullivan, F. A., & Torres, L. G. (2018). Assessment of vessel disturbance to gray whales to inform sustainable ecotourism. The Journal of Wildlife Management82(5), 896-905.

Sztukowski, L. A., Cotton, P. A., Weimerskirch, H., Thompson, D. R., Torres, L. G., Sagar, P. M., Knights, A. M., Fayet, A. L., & Votier, S. C. (2018). Sex differences in individual foraging site fidelity of Campbell albatross. Marine Ecology Progress Series601, 227-238.

Torres, L. G., Nieukirk, S. L., Lemos, L., & Chandler, T. E. (2018). Drone up! Quantifying whale behavior from a new perspective improves observational capacity. Frontiers in Marine Science5.

Yates, K. L., Bouchet, P. J., Caley, M. J., Mengersen, K., Randin, C. F., Parnell, S., … & Sequeira, A. M. M. (2018). Outstanding challenges in the transferability of ecological models. Trends in ecology & evolution.


The Beauty of Scientific Conferences

By Lisa Hildebrand, MSc student, OSU Department of Fisheries and Wildlife, Geospatial Ecology of Marine Megafauna Lab

Science is truly meaningful because it is shared amongst colleagues and propagated to the wider public. There are many mediums through which information dissemination can occur. A common and most rigorous form is the peer-review scientific publication of papers. The paper approval process is vigorous, can last a long time – sometimes on the scale of several years – and is therefore an excellent way of vetting science that is occurring all over the world in many different disciplines. New studies build upon the results and downfalls of others, and therefore the process of research and communication of knowledge is continuous.

However, scientific journals and the publications within them can be quite exclusive; they are often only accessible to certain members of the scientific community or of an educational institution. For a budding scientist who is not affiliated with an institution, it can be very hard to get your hands on current research. Having said that, this issue is slowly becoming inconsequential since open access and free journals, such as PeerJ, are becoming more prevalent.

How some students feel after reading scientific publications. Source: Know Your Meme.

Something that is perhaps more restrictive is the amount of topic-specific jargon used in publications. While a certain degree of jargon is to be expected, it can sometimes overwhelm a reader to the point where the main findings of the research become lost. This typically tends to be the case for those just at the beginning of their scientific journeys, however I have also known professors to comment on confusing sections of publications due to the heavy use of specific jargon.

Conferences on the other hand offer an opportunity to disseminate meaningful science in a more open and (sometimes) more laid-back setting (this may not always be true depending on the field of science and the calibre of the conference). Researchers of a particular field congregate for a few days to learn about current research efforts, ponder potential collaborations, peruse posters of new studies, and argue over which soccer team is going to win the next World Cup. That is the beauty of conferences – it is very possible to get to know each other on a personal level. These face-to-face opportunities are especially beneficial to students as this relaxed atmosphere lends itself to asking questions and engaging with scientists that are leaders in their fields.

Logo for the Marine Technology Summit. Source: MTS.

Just over a week ago, the GEMM Lab had the opportunity to do all of the above-mentioned things. PI Dr Leigh Torres and I participated in the Marine Technology Summit (MTS) in Newport, OR, a “mini-conference” at which shiny, new technologies for use in marine applications were introduced by leading, and many local, tech companies. While Leigh and I are not technologists, we are ecologists that have greatly benefitted from recent, rapid advances in technology. Both of our gray whale (Eschrichtius robustus) research projects use different technologies to unveil hitherto unknown ecological aspects of these marine mammals.

Leigh presented her research that involves flying drones over gray whales that grace the Oregon coastal waters in the spring and summer. Through these flights, many previously undocumented gray whale behaviours have been captured and quantified1, such as headstands, nursing and jaw snapping (check out the video below). Furthermore, still images from the videos have been used to perform photogrammetry to assess health and body condition of the whales2. These drone flights have added a wealth of valuable data to the life histories of individual whales that previously were assessed mainly through photo-identification and genetics. This still fairly new approach to assess health by using drones can be relatively cost-effective, which has always been one of Leigh’s key aims throughout her research so that methods are accessible to many scientists. These productive drones used by the GEMM Lab are commercially available (yup, just like the ones you see on the shelves at your local Best Buy!).

The use of cost-effective technologies is a common theme in the GEMM Lab and is also central to my research. The estimation of zooplankton density is vital to my project to determine whether gray whales in Port Orford select areas of high prey density over areas with less dense prey. However, the traditional technology used to quantify prey densities in the water column are often bulky or expensive. Instead, we developed a relatively cheap method of measuring relative zooplankton density using a GoPro camera that we reel down through the water column from a downrigger attached to our research kayak. While we are unable to exactly quantify the mass of zooplankton in the water column, we have been successful in assessing changes in relative prey density by scoring screenshots of the footage.

Screenshot of a GoPro video from this summer’s field season in Port Orford, OR revealing a thick layer of zooplankton. Source: GEMM Lab.

While our drones and GoPro technology is not without error, technology rarely is. In truth, we lost our GoPro for several days after it became stuck in a rock crevice and Leigh’s team regrettably lost a drone to the depths of the ocean this summer. This technology reality was part of the reason I presented at the MTS as I wanted to involve technologists to find solutions to some of the problems I have experienced. Needless to say, I got a lot of excellent input from many different people, for which I am very grateful. In addition to developing new opportunities to collaborate, I was very content to sit in the audience and hear about the ground-breaking new marine technologies that are in development. Below are short descriptions of two new technologies I learned about that are revolutionising the marine world.

ASV Unmanned Marine Systems develop autonomous surface vehicles that are powered by renewable energies (solar panels and wind turbines). These vessels are particularly useful for oceanographic monitoring as they are more capable than weather buoys and much more cost effective than manned weather ships or research vessels. Additionally, they can be used for a lot of different marine science applications including active acoustic fisheries monitoring, water quality monitoring, and cetacean tracking. Some models even have integrated drones that are launched and retrieved autonomously.

The Ocean Cleanup is a company that develops technologies to clean garbage out of our oceans. There is presently a large mission underway by The Ocean Cleanup to combat the Great Pacific Garbage Patch (GPGP). The GPGP is essentially a large island in the middle of the North Pacific Ocean comprised of diverse plastic particles – wrappers, polystyrene, fishing line, plastic bags, the list is endless3. A recent study estimates the amount of plastic in the GPGP to be at least 79 thousand tonnes of ocean plastic4. Unfortunately, the GPGP is not the only one of its kind. The Ocean Cleanup hopes to reduce this massive plastic accumulation with the development of a system made up of a 600-m long floater that sits on the ocean’s surface with a 3-m deep skirt attached below it. The skirt will collect debris while the float will prevent plastic from flowing over it, as well as keep the whole system afloat. The system arrived at the GPGP last Wednesday and the team of over 80 engineers, researchers, scientists and computational modellers have successfully installed the system. The team posts frequent updates on their Twitter and I would highly recommend you follow this possibly revolutionary technology.

While attending the MTS, it felt like there are no bounds for the types of marine technology that will be developed in the future. I am excited to see what ecologists working with technicians can develop to keep applying technology to address challenging questions and conservation issues.


References

  1. Torres, L., et al., Drone up! Quantifying whale behaviour from a new perspective improves observational capacity.Frontiers in Marine Science, 2018. 5, DOI:10.3389/fmars.2018.00319.
  2. Burnett, J.D., et al., Estimating morphometric attributes on baleen whales using small UAS photogrammetry: A case study with blue and gray whales, 2018.Marine Mammal Science. DOI:10.1111/mms.12527.
  3. Kaiser, J., The dirt on the ocean garbage patches. Science, 2018. 328(5985): p. 1506.
  4. Lebreton, L., et al., Evidence that the Great Pacific Garbage Patch is rapidly accumulating plastic. Scientific Reports, 2018. 8(4666).

Albatrosses at sunrise, dolphins at sunset: Northern California Current cruise

By Dawn Barlow, PhD student, Geospatial Ecology of Marine Megafauna Lab, Department of Fisheries and Wildlife, Oregon State University

Sun on my face and wind in my hair, scanning the expanse of blue. Forty minutes on, twenty minutes off, from sunrise until sunset, day after day. Hours of seemingly empty blue, punctuated by graceful black-footed albatrosses wheeling and gliding over the swells, by the splashing approach of a curious group of Pacific white-sided dolphins coming to play in the bow of the ship, by whale spouts on the horizon and the occasional breaching humpback. A flurry of data entry—geographic coordinates, bearing and distance from the ship, number of animals, species identification, behavior—and then back to blue.

Scanning for marine mammals from the flying bridge of NOAA ship Bell M. Shimada. Photo: Jess O’Loughlin.

I’ve just returned from the Northern California Current (NCC) ecosystem cruise aboard NOAA ship Bell M. Shimada. My role on board was the marine mammal observer, logging marine mammal sightings during the transits between sampling stations. We surveyed and sampled between Cape Mears, Oregon and Trinidad, California, from right along the coast out to 200 nautical miles offshore. Resources in the marine environment are patchy, and our coastline is highly productive. This diversity in environmental conditions creates niche habitats for many species, which is one reason why surveying and sampling across a broad geographic range can be so informative. We left Newport surrounded by gray whales, feeding in green, chilly waters at temperatures around 12°C. Moving west, the marine mammal and seabird sightings were increasingly sparse, the water increasingly blue, and the surface temperature warmed to a balmy 17°C. We had reached offshore waters, an ocean region sometimes referred to as the “blue desert”. For an entire day I didn’t see a single marine mammal and only just a few seabirds, until a handful of common dolphins—more frequently seen in warm-temperate and tropical waters to the south—joined the ship at sunset. As we transited back inshore over the productive Heceta Bank, the water became cooler and greener. I stayed busy logging sightings of humpback and gray whales, harbor porpoise and Dall’s porpoise, pacific white-sided dolphins and sea lions. These far-ranging marine predators must find a way to make a living in the patchy and dynamic ocean environment, and therefore their distribution is also patchy—aggregated around areas of high productivity and prey availability, and occasionally seen transiting in between.

Here are a few cruise highlights:

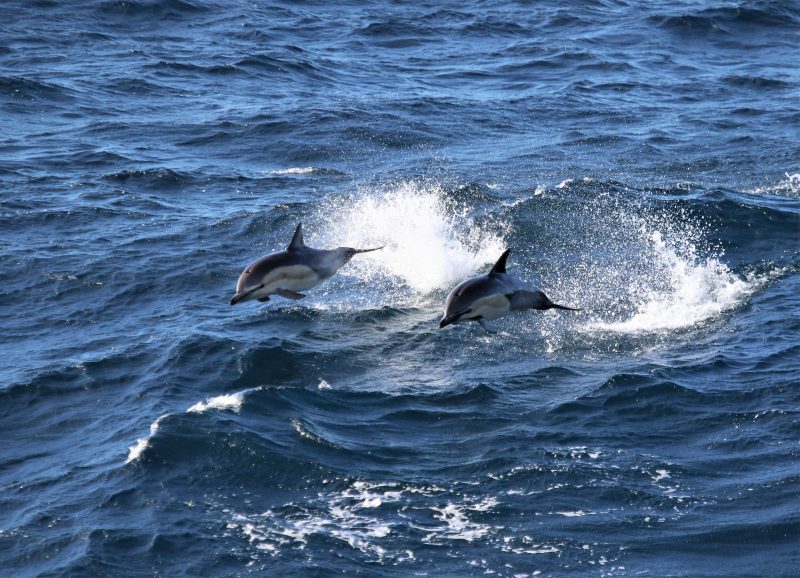
Curious groups of common dolphins (Delphinus delphis) came to play in the bow wake of the ship and even checked out the plankton nets when they were deployed. Common dolphins are typically found further south, however we saw several groups of them in the warmer waters far offshore.

Ocean sunfish (Mola mola) will occasionally lay themselves flat at the surface so that seabirds will pick them clean of any parasites. I was delighted to observe this for the first time just off Newport! There were several more sunfish sightings throughout the cruise.

Gull picking parasites off an ocean sunfish (Mola mola). Photo: Dawn Barlow.

A masked booby (Sula dactylatra) hung around the ship for a bit, 16 nautical miles from shore, just south of the Oregon-California border. Considered a tropical species, a sighting this far north is extremely rare. While masked boobies are typically distributed in the Caribbean and tropical Pacific from Mexico to Australia, one found its way to the Columbia River in 2006 (first record in the state of Oregon) and another showed up here to Newport in 2015 – reportedly only the second to be recorded north of Mendocino County, California. Perhaps this sighting is the third?

Masked booby (Sula dactylatra). Photo: Dawn Barlow.

While most of my boat-based fieldwork experiences have been focused on marine mammal research, this was an interdisciplinary cruise aimed at studying multiple aspects of the northern California current ecosystem. There were researchers on board studying oceanography, phytoplankton and harmful algal blooms, zooplankton, and microplastics. When a group of enthusiastic scientists with different areas of expertise come together and spend long days at sea, there is a wonderful opportunity to learn from one another. The hydroacoustic backscatter on the scientific echosounder prompted a group discussion about vertical migration of plankton one evening. Another evening I learned about differences in energetic content between krill species, and together we mused about what that might mean for marine predators. This is how collaborations are born, and I am grateful for the scientific musings with so many insightful people.

Thank you to the Shimada crew and the NCC science team for a wonderful cruise!

The NCC science team after a successful cruise!

A Summer of “Firsts” for Team Whale Storm

By Lisa Hildebrand, MSc student, OSU Department of Fisheries and Wildlife, Geospatial Ecology of Marine Megafauna Lab

To many people, six weeks may seem like a long time. Counting down six weeks until your favourite TV show airs can feel like time dragging on slowly (did anyone else feel that way waiting for Blue Planet II to be released?). Or crossing off the days on your calendar toward that much-needed holiday that is still six weeks away can feel like an eternity. It makes sense that six weeks should feel like a long time. After all, six weeks are approximately a ninth of an entire year. Yet, I can assure you that if you asked anyone on my research team this summer whether six weeks was a long time, they would all say no.

As I watched each of my interns present our research to a room of 50 engaged community members (Fig. 1) after our six week research effort, I couldn’t help but feel an overwhelming sense of pride for all of them at how far they had come during the course of the field season.

Figure 1. Our audience at the community presentation on August 31. Photo by Leigh Torres.

On the very first day of our two-week training back in July, I gave my team an introductory presentation covering gray whales, their ecology, what the next six weeks would look like, how this project had developed and its results to date (Quick side-note here: I want to give a huge shout out to Florence and Leigh as this project would not be what it is today without their hard work and dedication as they laid the groundwork for it three years ago and have continued to improve and expand it). I remember the looks on my interns’ faces and the phrase that comes to mind is ‘deer in headlights’. It isn’t surprising that this was the case as this internship was the first time any of them had done marine mammal field work, or any kind of field work for that matter. It makes me think back to my first taste of field work. I was a fresh high school graduate and volunteering with a bottlenose dolphin research group. I remember feeling out of place and unsure of myself, both in terms of data collection skills but also having to live with the same people I had worked with all day. But as the first few days turned into the first few weeks, I grew into my role and by the end of my time there, I felt like an expert in what I was doing. Based on the confidence with which my interns presented our gray whale foraging ecology research to an audience just over a week ago, I know that they too had become experts in these short six weeks. Experts in levelling a theodolite, in sighting a blow several kilometres out from our cliff site, in kayaking in foggy conditions, in communicating effectively in high stress situations – the list goes on and on.

While you may have read the previous blog posts written by each of my interns in the last four weeks and thus have a sense of who they are, I want to tell you a little more about each of these hardworking undergraduates that played a large role in making this year’s Port Orford gray whale season so effective. Although we did not have any local high school interns this year, the whole team hails from Oregon, specifically from Florence, Sweet Home and Portland.

Figure 2. Haley on the cliff equipped with the camera waiting for a whale to surface. Photo by Cynthia Leonard.

Haley Kent (Fig. 2), my co-captain and Marine Studies Initiative (MSI) intern, an Environmental Science major, is going into her senior year at OSU this fall. She is focused and driven, which I know will enable her to pursue her dream of becoming a shark researcher (I can’t even begin to describe her excitement when we saw the thresher shark on our GoPro video). I couldn’t have asked for a better right hand person for my first year taking over this project and I am excited to see what results she will reveal through her project of individual gray whale foraging preferences. Also, Haley has a big obsession for board games and provided the team with many evenings of entertainment thanks to Munchkin and King of Tokyo.

Figure 3. Dylan in the stern of the kayak on a foggy day reeling down the GoPro stick on the downrigger. Photo by Haley Kent.

Dylan Gregory (Fig. 3) is transferring from Portland Community College and is going to be an OSU junior this fall. Not only was Dylan always extremely helpful in working with me to come up with ways to troubleshoot or fix gear, but his portable speaker and long list of eclectic podcasts always made him a very good cliff team partner. He was also Team Whale Storm’s main chef in the kitchen, and while some of his dishes caused tears & sweat among some team members (Dylan is a big fan of spices), there were never any leftovers, indicating how delicious the food was.

Figure 4. Robyn on one of our day’s off visiting the gigantic Redwoods in California. Photo by Haley Kent.

Robyn Norman (Fig. 4) will be a sophomore at OSU this fall and her commitment to zooplankton identification has been invaluable to the project. Last year when she was a freshman, Robyn was given our zooplankton samples from 2017, a few identification guides and instructions on how to use the dissecting microscope, before she was left to her own devices. Her level of independence and dedication as a freshman was incredible and I am very grateful for the time and skills she has given to this work. Besides this though, Robyn always brought an element of happiness to the room and I can speak on behalf of the rest of the team, that when she was gone for a week on a dive trip, the house did not feel the same without her.

Figure 5. Hayleigh Middleton at the community presentation. Her dry humour and quips earned her a lot of laughter from the audience keeping them entertained. Photo by Tom Calvanese.

Hayleigh Middleton (Fig. 5), a fresh high school graduate and freshly turned 18 during the project, is starting as a freshman at OSU this fall. She is extremely perceptive and would (thankfully) often remind others of tasks that they had forgotten to do (like take the batteries out of the theodolite or to mention the Secchi depth on the GoPro videos). I was very impressed by Hayleigh’s determination to continue working on the kayak despite her propensity for sea sickness (though after a few days we did remedy this by giving her raw ginger to chew on – not her favourite flavour or texture but definitely very, very effective!). She is inquisitive about almost everything and I know she will do very well in her first year at OSU.

Thank you, Team Whale Storm (Fig. 6), for giving me six weeks of your summer and for making my first year as project leader as seamless as it could have been! Without each and every one of you, I would not have been able to survey for 149.2 hours on the cliff, collect over 300 zooplankton samples, identify 31 gray whales, or launch a tandem kayak at 6:30 am every morning.

Figure 6. Team Whale Storm. Back row, from left to right: Haley Kent, Robyn Norman, Hayleigh Middleton, Dylan Gregory. Front row, from left to right: Tom Calvanese, Dr. Leigh Torres, Lisa Hildebrand. Photo by Mike Baran.

My interns were not the only ones to experience many “firsts” during this field season. I learned many new things for the first time right alongside them. While taking leadership is not a foreign concept to me, these six weeks were my first real experience of leading a project and a team for a sustained period of time. Managing teams, delegating tasks and compiling data felt gratifying because I felt like I was exactly where I should be (Fig. 7).

Figure 7. From left to right: Tom, myself, Hayleigh & Dylan on the cliff site looking for whales. Photo by Leigh Torres.
Figure 8. Haley & I on a cold evening out on the water but very excited to have gotten back the GoPro stick retrieved by divers after it had been stuck in a crevice for over 5 days. Photo by Lisa Hildebrand.

I dealt with many daunting tasks, yet thanks to the support of my interns, as well as Tom (Port Orford field station’s incredible station manager), Florence and Leigh, I learned how to resolve my problems: I fixed and replaced broken or lost gear (I am not a very mechanically inclined person; Fig. 8), budgeted food for five hungry people doing tiring field work (I’ve only ever budgeted for one person previously), and taught people how to use gear that I had not often used before (I can say now that the theodolite and I are friends, but this wasn’t the case for the first few weeks…).


Figure 9. Me with all the gear packed into the truck ready to leave Port Orford after the end of the field season. Photo by Haley Kent.
In the lead up to the summer field season this year, Leigh said to me, in one of the many emails we exchanged, that leading the project was a big task but that it was just six weeks long. She suggested that I rest up and get organised as much as I could ahead of time because, after all, the data collected this summer was going to be my thesis data, so I would want it to be as good as possible. Looking back, she couldn’t have been more right – the six weeks simply flew by, I did need the rest she had advised, and it definitely was a big task. I can’t wait for it to happen all over again next summer.

Looking through the scope: A world of small marine bugs

By Robyn Norman, GEMM Lab summer 2018 intern, OSU undergraduate

Although the average human may think all zooplankton are the same, to a whale, not all zooplankton are created equal. Just like us, different whales tend to favor different types of food over others. Thus, creating a meal perfect for each individual preference. Using a plankton net off the side of our kayak, each day we take different samples, hoping to figure out more about prey and what species the whales, we see, like best. These samples are then transported back to the lab for analysis and identification. After almost a year of identifying zooplankton and countless hours of looking through the microscope you would think I would have seen everything these tiny organisms have to offer.  Identifying mysid shrimp and other zooplankton to species level can be extremely difficult and time consuming, but equally rewarding. Many zooplankton studies often stop counting at 300 or 400 organisms, however in one very long day in July, I counted over 2,000 individuals. Zooplankton tend to be more difficult to work with due to their small size, fragility, and large quantity.

Figure 1. A sample fresh off the kayak in the beginning stages of identification. Photo by Robyn Norman.

A sample that looks quick and easy can turn into a never-ending search for the smallest of mysids. Most of the mysids that I have sorted can be as small as 5 mm in length. Being difficult to identify is an understatement. Figure 1 shows a sample in the beginning stages of analysis, with a wide range of mysids and other zooplankton. Different species of mysid shrimp generally have the same body shape, structure, size, eyes and everything else you can think of. The only way to easily tell them apart is by their telson, which is a unique structure of their tail. Their telsons cannot be seen with the naked eye and it can also be hard to find with a microscope if you do not know exactly what you are looking for.


Throughout my time identifying these tiny creatures I have found 9 different species of mysid from this gray whale foraging ecology project in Port Orford from the 2017 summer. But in 2018 three mysid species have been particularly abundant, Holmesimysis sculpta, Neomysis rayii, and Neomysis mercedis.

Figure 2. Picture taken with microscope of a Holmesimysis sculpta telson. Photo by Robyn Norman.

H. sculpta has a unique telson with about 18 lateral spines that stop as they reach the end of the telson (Figure 2). The end of the telson has 4 large spines that slightly curve to make a fork or scoop-like shape. From my own observations I have also noticed that H. sculpta has darker coloring throughout their bodies and are often heavily pregnant (or at least during the month of August). Neomysis rayii and Neomysis mercedis have been extremely difficult to identify and work with. While N. rayii can grow up to 65 mm, they can also often be the same small size as N. mercedis. The telsons of these two species are very similar, making them too similar to compare and differentiate. However, N. rayii can grow substantially bigger than N. mercedis, making the bigger shrimp easier to identify. Unfortunately, the small N. rayii still give birth to even smaller mysid babies, which can be confused as large N. mercedis. Identifying them in a timely manner is almost impossible. After a long discussion, we decided it would be easier to group these two species of Neomysis together and then sub-group by size. Our three categories were 1-10 mm, 11-15 mm, 16+ mm. According to the literature, N. mercedis are typically 11-15 mm meaning that anything over this size should be a N. rayii (McLaughlin 1980).

Figure 3. Microscopic photo of a gammarid. Photo source: WikiMedia.
Figure 4. Caprellidae found in sample with unique coloration. Photo by Robyn Norman.

While mysids comprise the majority of our samples, they are not the only zooplankton that I see. Amphipods are often caught along with the shrimp. Gammarids look like the terrestrial potato bug and can grow larger than some species of mysid (Fig. 3).

As well as, Caprellidae (Fig. 4) that remind me of little tiny aliens as they have large claws compared to their body size, making it hard to get them out of our plankton net. These impressive creatures are surprisingly hardy and can withstand long times in the freezer or being poked with tweezers under a microscope without dying.

In 2017, there was a high abundance of amphipods found in both of our study sites, Mill Rocks and Tichenor Cove. Mill Rocks surprisingly had 4 times the number of amphipods than Tichenor Cove. This result could be one of the possible reasons gray whales were observed more in Mill Rocks last year. Mill Rocks also has a substantial amount of kelp, a popular place for mysid swarms and amphipods. The occurrence of mysids at each of these sites was almost equal, whereas amphipods were almost exclusively found at Mill Rocks. Mill Rocks also had a higher average number of organisms than Tichenor Cove per samples, potentially creating better feeding grounds for gray whales here in Port Orford.

Analyzing the 2018 data I can already see some differences between the two years. In 2018 the main species of mysid that we are finding in both sites are Neomysis sp. and Holmesimysis sculpta, whereas in 2017 Alienacanthomysis macropsis, a species of mysid identified by their long eye stalks and blunt telson, made up the majority of samples from Tichenor Cove. There has also been a large decrease in amphipods from both locations compared to last year. Two samples from Mill Rocks in 2017 had over 300 amphipods, however this year less than 100 have been counted in total. All these differences in zooplankton prey availability may influence whale behavior and movement patterns. Further data analysis aims to uncover this possibility.

Figure 5. 2017 zooplankton community analysis from Tichenor Cove. There was a higher percentage and abundance of Neomysis rayii (yellow) and Alienacanthomysis macropsis (orange) than in Mill Rocks.
Figure 6. 2017 zooplankton community analysis from Mill Rocks. There was a higher abundance and percentage of amphipods (blue) and Holmesimysis sculpta (brown) than in Tichenor cove. Caprellidae (red) increased during the middle of the season, and decreased substantially towards the end.

The past 6 weeks working as part of the 2018 gray whale foraging ecology research team in Port Orford have been nothing short of amazing. We have seen over 50 whales, identified hundreds of zooplankton, and have spent almost every morning on the water in the kayak. An experience like this is a once in a lifetime opportunity that we were fortunate to be a part of. For the past few years, I have been creating videos to document important and exciting times in my life. I have put together a short video that highlights the amazing things we did every day in Port Orford, as well as the creatures that live just below the surface. I hope you enjoy our Gray Whale Foraging Ecology 2018 video with music by Myd – The Sun. 

[B]reaching New Discoveries about Gray Whales in Oregon

By Haley Kent, Marine Studies Initiative (MSI) & summer GEMM Lab intern, OSU senior

“BLOW!”, yells a team “Whale Storm” member, as mist remains above the water from an exhaling gray whale (Eschrichtius robustus). While based at the Port Orford Field Station for 6 weeks of my final summer as an undergrad at Oregon State University my heart has only grown fonder for marine wildlife. I am still in awe of this amazing opportunity of researching the foraging ecology of gray whales as a Marine Studies Initiative and GEMM Lab intern. From this field work I have already learned so much about gray whales and their zooplankton prey, and now it’s time to analyze the data we have collected and see what ecological stories we can uncover.

Figure 1. Robyn and Haley enjoy their time in the research kayak. Photo by Lisa Hildebrand.

WORK IN THE FIELD

This internship is my first field work experience and I have learned many skills and demands needed to study marine wildlife: waking up before the sun (every day begins with screaming alarms), being engulfed by nature (Port Orford is a jaw-dropping location with rich biodiversity), packing up damp gear and equipment to only get my feet wet in the morning ocean waves again, and of course waiting on the weather to cooperate (fog, wind, swell). I wouldn’t want it any other way.

Figure 2. Smokey sunrise from the research kayak. Photo by Haley Kent.

Whether it is standing above the ocean on the ‘Cliff Site’ or sitting in our two-man kayak, every day of this internship has been full of new learning experiences. Using various field work techniques, such as using a theodolite (surveying equipment to track whale location and behavior), Secchi disks (to measure water clarity), GoPro data collection, taking photos of wildlife, and many more tools, have given me a new bank of valuable skills that will stick with me into my future career.

Figure 3. Haley drops Secchi disk from the research kayak. Photo by Dylan Gregory.

Data Analysis

To maximize my amazing internship experience, I am conducting a small data analysis project using the data we have collected these past weeks and in previous summers.  There are so many questions that can be asked of these data, but I am particularly interested in how many times individual gray whales return to our study area to forage seasonally or annually, and if these individual whales forage preferentially where certain zooplankton prey are available.

Photo Identification

After many hours of data collection in the field either in the kayak or on the cliff, we get to take a breather in the lab to work on various projects we are each assigned. Some job tasks include processing data, identifying zooplankton, and looking through the photos taken that day to potentially identify a known whale. Once photos are processed and saved onto the rugged laptop, they are ready for some serious one on one. Looking through each of the 300 photos captured each day can be very tedious, but it is worthwhile when a match is found. Within the photos of each individual whale I first determine whether it is the left or right side of the whale – if we are lucky we get both! – and maybe even a fluke (tail) photo!

Figure 4. Buttons’ left side. Photo taken by Gray Whale Team of 2018.
Figure 5. Buttons’ left side. Photo taken by Gray Whale Team of 2017.

The angles of these photos (Fig. 4 & 5) are very different, so it could be difficult to tell these are the same whale. But, have a closer look at the pigmentation patterns on this whale. Focus on a single spot or area of spots, and see how patterns line up. Does that match in the same area in the next photo? If yes, you could have yourself a match!

Buttons, one of the identified gray whales (Fig. 4 & 5), was seen in 2016, 17, and 18. I was so excited to identify Buttons for the 3rd year in a row as this result demonstrates this whale’s preference for foraging in Port Orford.

Zooplankton and whale foraging behavior

By using the theodolite we track the whale’s position from the cliff location. I have plugged these coordinates into Google Earth, and compared the coordinates to our zooplankton sample stations from that same day. These methods allow me to assess where the whale spent time, and where it did not, which I can then relate to the zooplankton species and abundance we caught in our sample tows (we use a net from the research kayak to collect samples throughout the water column).

Figure 6. Holmesimysis sculpta. This species can range between 4-12mm. The size of this zooplankton relative to the large gray whales foraging on it shows the whale’s incredible senses for prey preference. Photo source: Scripps Institute of Oceanography.

Results (preliminary)

‘Eyeball’ is one of our resident whales that we have identified regularly throughout this season here in Port Orford. I have compared the amount of time Eyeball has spent near zooplankton stations to the prey community we captured at each station.

There is a positive trend in the amount of time the whale spent in an area with the percent abundance of Holmesimysis sculpta (Fig. 7: blue trend line).

Figure 7. Comparative plot between the amount of time the whale “Eyeball” spent within 50m of each zooplankton sampling station and the relative amount of zooplankton species caught at each station. Note the positive trend between time and Holmesimysis sculpta, and the negative trend relative to Neomysis sp. or Caprellidae.

Conversely, there is an inverse trend with two other zooplankton species:  Neomysis sp. (grey trend line) and Caprellidae (orange trend line). These results suggest that Eyeball has a foraging preference for areas where Holmesimysis sculpta (Fig. 6) is more abundant. Who would have known a whale could be so picky? Once the season comes to an end, I plan to use more of our data to continue to make discoveries about the foraging preferences of gray whales in Oregon.

Where the Wild Things Are

By Dylan Gregory, GEMM Lab summer 2018 intern, OSU undergraduate transfer

In ecology, biodiversity is a term often touted for its key importance in stable ecosystems. Every organism plays its role in the constant struggle of nature, competing and cooperating with each other for survival. The sun provides the initial energy to primary producers, herbivores eat those producers, and predators then eat the consumers. The food chain is a simplistic way to look at how ecosystems work, and of course, it is more like an intricate web of interactions. Fungus and plants work together to trade nutrients and create a vast network of fertile soils; kelp forests provide habitats and food for a variety of prey that marine predators feed on. There are checks and balances between all these organisms that give breath into the beauty and color we see in ecosystems around the world. And, here in Port Orford is no exception. Coming to the project I expected to see some whales, of course. However only three weeks in and I’ve been absolutely astounded with the amount of marine biodiversity we’ve experienced. These past three weeks have been nothing if, well, wild.

Eschrichtius robustus, The Gray Whale

There was no doubt we would see gray whales, that is what we are here for after all, and studying them in the field has been an incredibly enlightening experience. Watching an animal every day for weeks really gets you into their head. You start to connect with them and think about their behaviors in different ways. You begin to realize that the individuals have unique quirks, habits and tendencies. For example, one whale would feed quickly for a time, and then seem to run out of energy and “log” itself, floating on the surface, taking multiple breaths in succession to recover before diving back down. Many whales come from the south, to feed in Mill Rocks before moving to Tichenor Cove, and then leave our study region through “Hell’s Gate” to the North, often resting a moment, taking multiple breaths and then launching into the open sea. Still, when you think you know these whales, they surprise you with an alarming unpredictability, making tracking them a new experience every day.

Figure 1 A gray whale surprised us by surfacing right next to our kayak during a routine zooplankton sampling. The site has shown to have a significant amount of zooplankton and it must have been very interested in the prey available, completely ignoring our presence. Photo by Haley Kent.

The whale in Fig. 1 surprised us, and honestly, being so close to it was as humbling as it was awesome. I expected to see whales, but never expected such a close encounter. These gentle giants are one of our not so distant relatives in the ocean. Many of us do this kind of research for more than just the science and the data. Many of us do it for the connection we feel to our mammal family.

Phoca vitulina richardii, The Pacific Harbor Seal

I absolutely adore these harbor seals! They’re well known for their friendliness towards humans as their dopey little heads pop up out of the water to greet you with a curious look in their eyes. They like to bob in the surf and stare at us while we’re out sampling in the kayak. At first, we got quite excited seeing one, often startling them as we’d squeal “seal!” to each other and they’d dip back under and scurry away. Now though, they seem more comfortable being around our kayak (Fig. 2).

Figure 2 This harbor seal surfaced next to Haley and me shortly before the whale in Fig 1. We named him Courage, as he stuck around and kept us company during the whole encounter. Photo by Haley Kent.

One day a seal followed Lisa and Hayleigh around the jetty on their way back from sampling, swimming around the kayak and investigating them. Out in Mill Rocks, we often see them stretching on top of the rocks, seemingly doing a little yoga session while basking in the morning sun. Despite their cute and cuddly appearance, they are still predators. With plenty of fish to eat and make them happy, these harbor seals are quite plentiful themselves, and I’d like to think we’ve become quite good friends with the little guys.

Tursiops truncatus, The Bottlenose Dolphin

Figure 3 A shot of the dorsal fin seen on August 9th in Mill Rocks. Photo by Dylan Gregory.

One morning we were in Mill Rocks and a large cloud of fog moved in, so we decided to wait it out before making our passage to Tichenor Cove. While sitting there, enjoying a snack, we noticed some dorsal fins popping up about 100 meters from us. Caught by surprise, Haley and I scrambled for our cameras and lo and behold, we noticed they were a small pod of dolphins! Two adults and a calf. Unfortunately, as you can see from our pictures, it is difficult to identify what species they were exactly.

Figure 4 The head and rostrum of the dolphin seen in Mill Rocks on August 9th. Photo by Dylan Gregory.

After communicating with Lisa and Leigh, we have decided that their dorsal fins were far too big and curved to be harbor porpoises (Fig. 3), and the intersection of the head and rostrum seem to have the classic look of a bottlenose dolphin (Fig. 4).

If these were in fact bottlenose dolphins, why are they here in Port Orford, Oregon? It’s uncommon for them to be so far north in our colder waters. Were they foraging for food? Finding refuge from predators? Is it because our waters are becoming warmer? A sighting like this gives more weight to how climate change is affecting our oceans and how marine animals are responding by adapting their migratory and feeding behaviors.

Pisaster and Pycnopodia, The Common Sea Star and the Sunflower Star

Figure 5 Pisaster sea stars and anemones on a rock in Mill Rocks. No Pycnopodia (often called sunflower stars for their many legs) have been spotted in our study zone. Photo by Haley Kent.

One of the coolest aspects of living at the Port Orford Field Station is the fact that we have access to a lot of engagement with other scientists. For instance, we were able to attend a webinar about Sea Star Wasting Disease (SSWD) research currently happening at OSU by Post Doc Sarah Gravem. In a nutshell, a bacterial disease has been infecting sea stars along the west coast, causing a rapid plummet in their populations. Pisaster and Pycnopodia (Fig. 5) have been particularly affected. They are keystone predators, and as such, hold an important role in intertidal ecosystems. Feeding on snails, urchins, other sea stars and various mollusks, these sea stars maintain species populations and allow for a diverse and stable intertidal zone, which then supports many other near shore marine species. While SSWD’s cause is relatively unknown, Pisaster seems to be recovering while Pycnopodia is still struggling. I’ve even heard some anecdotal reports that fishermen here in Port Orford have noticed the lack of Pycnopodia as well, but they are rather pleased that these “ragmops” have stopped mucking up their lines and crab pots.

Below the Surface

There is a charm to the deep, a mystery and wonder that has captured the imagination of humans ad nauseam. Stories, movies, music and masterpieces of art have been inspired by The Abyss. Below the surface lies a diverse world teeming with life, full of questions and answers to be found. While marine mammals are why we’re here, there’s an entirely different environment under the water that is unseen from the safety of our dry, oxygen rich air. Our research doesn’t involve any diving, and so our eyes under the water are a GoPro camera attached to a downrigger on our kayak. Although designed to measure zooplankton community density, we’ve seen quite a bit more than itty bitty sea bugs in the depths of our little harbor here in Port Orford.

Strongylocentrotus purpuratus, The Purple Sea Urchin

Urchins are known for their bright colors and spiny ball like exterior. Close relatives to the sea stars, urchins inhabit the intertidal zones and also take residence within kelp beds. During our kayak training, we passed by some rocks near the cliffs and it was an awesome sight seeing the diversity of intertidal critters such as anemones, sea stars and sea urchins. However, a week into data collection, we have noticed something startling: a large quantity of the urchins cover the seafloor and the kelp, or at least what was left of the kelp (Fig. 6).

Figure 6 Sea Urchins decimating a kelp bed in Tichenor Cove. Photo captured from GoPro footage.

Sea urchins are important members in their communities. They graze on algae and control it from overwhelming the waters, but when left unchecked urchins can completely decimate kelp beds. This pattern is often referred to as “urchin barrens”. Sea otters and sea stars are the urchin’s main predator, and due to the absence of otters and the emergence of SSWD, the occurrence of urchin barrens has risen. An assessment of the reintroduction of the sea otters to Oregon by Dominique Kone, a GEMM Lab graduate student, is underway, and there is a lot of new research on SSWD, both of which could support the ‘ecosystem control’ of urchin populations. We’ve already spotted the urchins wreaking their havoc on the kelp in two separate sites in Tichenor Cove. Since gray whales primarily feed within these kelp beds, this increase in urchin populations is something that we are monitoring. An urchin barren can happen quickly and causes significant ecosystem damage, so this is not something to ignore. If we lose the kelp, it’s easy to imagine that we may lose the whales.

Alopias vulpinus, The Thresher Shark

Figure 7 A thresher shark spotted in Tichenor Cove in Port Orford, OR. Photo captured by GoPro footage.

By far, the most exciting thing I’ve seen so far has been this lovely creature (Fig. 7). The thresher shark usually inhabits the oceanic and coastal zones in tropical and temperate waters. They feed on pelagic schooling fish, squid and sometimes even shorebirds. They attack by whipping their tails (which grow to be the size of their body!) at their prey to stun them. Threshers are on the IUCN Red List of Threatened Species as “Vulnerable” due to their declining populations. They are often hunted for shark fin soup, or by trophy hunters due to their elegant and unique tails.

Haley, our resident shark enthusiast, was able to tell that this shark was a female by the lack of claspers (male appendages) on her pelvic fin. Why was she here though? During the summer, threshers will migrate to colder yet productive northern waters to feed, and on some rare occasions, such as this one, they will come closer to shore. Perhaps she was chasing prey into the harbor and found it to be full of yummy food, or she is a juvenile, which often stay near the continental shelf.

Either way, we were all surprised and excited to see such an exotic and beautiful species of shark caught on camera in our study zone. She even does a little strut in front of the GoPro camera, showing off her beautiful caudal fin!

Protecting our Wilds      

These are only a few examples of the many different animals at work in Port Orford’s ecosystem. Perhaps the biodiversity here is why this is such a hot spot for our whale friends. The productive and lively waters have shown us so many critters, and likely many more we have yet to see. But alas, we have three more weeks of data collection and new discoveries, and I couldn’t be more excited.

“It is a curious situation that the sea, from which life first arose should now be threatened by the activities of one form of that life. But the sea, though changed in a sinister way, will continue to exist; the threat is rather to life itself.”

– Rachel Carson, The Sea Around Us

This experience only drives me further into my pursuit of ecological research. I believe it’s incredibly important to understand the world and how it functions, and to do so before it’s too late. All too often we have breakthrough discoveries in science because something has already fallen apart. Ecosystems are fragile, and climate change, pollution, and other anthropogenic disturbances all have an impact which damage and alter ecosystems and the services they provide. However, it’s an impact we can control with a fundamental understanding of how nature works. With a little hope, some integrity, and a whole lot of passion, I believe we have the power to truly make a difference.

Cold Fingers and Carabiners

By Hayleigh Middleton, GEMM Lab summer 2018 intern, entering OSU undergrad 

Cold Fingers and Carabiners: that’s what most of the past three weeks have been about. We’ve progressively been getting up earlier—with many thanks to the coffee pot and multiple alarms— in order to be on the water collecting data before the wind and fog decide to kick in. Working on the ocean at 7 am with wet hands, metal equipment, a tight suit, and a “refreshing” breeze while trying to keep an eight-foot sit-on-top kayak from tipping over is challenging to say the least. Making sure the Theodolite is perfectly level on its tripod resting on sand-covered ground at the top of a cliff? Not much easier. The air is cold, the wind is cold, the equipment is cold, I’m cold, and now, everything is wet.

Rugged laptop on the cliff site. Photo by Hayleigh Middleton.

I absolutely love it.

Of all the ways I could have chosen to spend my summer before starting college at OSU, I’m so glad I took a chance and asked to spend it here. The official goals of our research project are to monitor and record the foraging habits of the Pacific Coast Feeding Group of gray whales, attempt to find out if specific individuals tend to have site fidelity and forage here year after year, and why or how they choose certain spots to feed over others. What does that mean for me? I get to kayak and take pictures of whales for six weeks! Of course, there’s a bunch of technical stuff and expensive equipment that took us two weeks to learn, but now we’re off to a great start and ready to learn more about these amazing creatures.

We have such a short amount of time to collect all this data to try and fill in the puzzle that is gray whale behavior, and we’re only a few weeks in, but I feel like I’ve already connected with this group of 60,000-pound mammals. That, in essence, is really what we’re doing here. We’re on top of a 33-meter-high cliff watching empty water for hours on the chance that we’ll be able to see a whale, identify it through photo-ID, track it with the theodolite to figure out its behavior, and use our kayak data to figure out its diet and feeding choices. Even though the whales forage up to two kilometers away from our tracking spot, it feels like they know we’re watching them. Sometimes it feels like they’re teasing us—we’ll see one, and once we get the sights fixed on it, it dives down and doesn’t come back up until we’ve turned our attention. One whale got into a very predictable pattern: three blows and then a deep dive, forage for five minutes, pop up half a viewfinder away, three more blows. We set our sights on the third blow and waited for her to resurface.

…and waited.

…and waited.

She swam away and didn’t show herself again.

Other times it’s like they conspire against us. Earlier this week, we spent most of the morning tracking the same whale. A couple hours into the track, another whale popped up right next to the first. Since we use a computerized tracking program, each whale is assigned a group number. That way, we can track each individual’s path and later match it to the photo identification database and sometimes a nickname. The two whales surfaced at just the right frequency and distance apart that deciding which number was currently up was guesswork for a good 15 minutes, but we gave them new track numbers and were able to sort it out later after reviewing our photos.

Searching for whales. Photo by Haley Kent.

On another day, we surveyed for whales until quitting time, which is 3:00 pm. About 2:30 pm, one was finally spotted. I named her Princess because she couldn’t be bothered to bring her body out of the water enough so we could mark her location or take a picture except for when her pectoral fin, the tip of which was “gloved” in white, came out and made a motion like a princess in a parade. When there are whales around, we can’t just say “oh look, 3:00 pm time to go” because this is important data to collect. So, we decided to wait until 3:30 pm to see if she surfaced again within visual range. 3:30 pm came and still no sign of her, so I packed up the theodolite and tripod. As soon as the box was closed, she blew, and another whale surfaced right in front of the cliff. We got some pictures of the closer one for a bit and decided that was enough. As the camera was being lowered into its case, another whale surfaced in the cove. It felt like the first went and told all the whales heading south “hey, these guys want to leave at 3, so show up right around then.” That day we got back to the lab around 5. Even though this meant being on the cliff for almost 10 hours that day, it was thrilling to have seen so many whales in one day.

Then there are times when the whales seem to beg for attention. On our third day on the cliff, we saw what we believe to be a juvenile come swimming into view. We assume that he was a juvenile because he was “small” and quite blank in terms of pigmentation and scarring. He was adorable. He stayed over at Mill Rocks for a while foraging, all of which we “fixed” into the tracking program via the Theodolite, and then he came toward us into the little kelp patch just in front of our cliff site. He would dive down, scoop up some zooplankton to eat, and resurface right in the middle of the kelp. The cutest part is that he would then proceed to roll around in the kelp and further drape himself in it.

Kelp whale. Photo by Lisa Hildebrand.

Having such a young whale come and forage made us wonder if mothers who have site fidelity then teach their young “hey, you don’t have to go all the way north, there’s a ton of good food here in Port Orford.”  Hopefully that’s one of the things we’ll be able to figure out with the data collected with this longterm study. But in the meantime, I still have three weeks of data to collect and a bunch more whales to meet. 

The Land of Maps and Charts: Geospatial Ecology

By Alexa Kownacki, Ph.D. Student, OSU Department of Fisheries and Wildlife, Geospatial Ecology of Marine Megafauna Lab

I love maps. I love charts. As a random bit of trivia, there is a difference between a map and a chart. A map is a visual representation of land that may include details like topology, whereas a chart refers to nautical information such as water depth, shoreline, tides, and obstructions.

Map of San Diego, CA, USA. (Source: San Diego Metropolitan Transit System)
Chart of San Diego, CA, USA. (Source: NOAA)

I have an intense affinity for visually displaying information. As a child, my dad traveled constantly, from Barrow, Alaska to Istanbul, Turkey. Immediately upon his return, I would grab our standing globe from the dining room and our stack of atlases from the coffee table. I would sit at the kitchen table, enthralled at the stories of his travels. Yet, a story was only great when I could picture it for myself. (I should remind you, this was the early 1990s, GoogleMaps wasn’t a thing.) Our kitchen table transformed into a scene from Master and Commander—except, instead of nautical charts and compasses, we had an atlas the size of an overgrown toddler and salt and pepper shakers to pinpoint locations. I now had the world at my fingertips. My dad would show me the paths he took from our home to his various destinations and tell me about the topography, the demographics, the population, the terrain type—all attribute features that could be included in common-day geographic information systems (GIS).

Uncle Brian showing Alexa where they were on a map of Maui, Hawaii, USA. (Photo: Susan K. circa 1995)

As I got older, the kitchen table slowly began to resemble what I imagine the set from Master and Commander actually looked like; nautical charts, tide tables, and wind predictions were piled high and the salt and pepper shakers were replaced with pencil marks indicating potential routes for us to travel via sailboat. The two of us were in our element. Surrounded by visual and graphical representations of geographic and spatial information: maps. To put my map-attraction this in even more context, this is a scientist who grew up playing “Take-Off”, a board game that was “designed to teach geography” and involved flying your fleet of planes across a Mercator projection-style mapboard. Now, it’s no wonder that I’m a graduate student in a lab that focuses on the geospatial aspects of ecology.

A precocious 3-year-old Alexa, sitting with the airplane pilot asking him a long list of travel-related questions (and taking his captain’s hat). Photo: Susan K.

So why and how did geospatial ecology became a field—and a predominant one at that? It wasn’t that one day a lightbulb went off and a statistician decided to draw out the results. It was a progression, built upon for thousands of years. There are maps dating back to 2300 B.C. on Babylonian clay tablets (The British Museum), and yet, some of the maps we make today require highly sophisticated technology. Geospatial analysis is dynamic. It’s evolving. Today I’m using ArcGIS software to interpolate mass amounts of publicly-available sea surface temperature satellite data from 1981-2015, which I will overlay with a layer of bottlenose dolphin sightings during the same time period for comparison. Tomorrow, there might be a new version of software that allows me to animate these data. Heck, it might already exist and I’m not aware of it. This growth is the beauty of this field. Geospatial ecology is made for us cartophiles (map-lovers) who study the interdependency of biological systems where location and distance between things matters.

Alexa’s grandmother showing Alexa (a very young cartographer) how to color in the lines. Source: Susan K. circa 1994

In a broader context, geospatial ecology communicates our science to all of you. If I posted a bunch of statistical outputs in text or even table form, your eyes might glaze over…and so might mine. But, if I displayed that same underlying data and results on a beautiful map with color-coded symbology, a legend, a compass rose, and a scale bar, you might have this great “ah-ha!” moment. That is my goal. That is what geospatial ecology is to me. It’s a way to SHOW my science, rather than TELL it.

Would you like to see this over and over again…?

A VERY small glimpse into the enormous amount of data that went into this map. This screenshot gave me one point of temperature data for a single location for a single day…Source: Alexa K.

Or see this once…?

Map made in ArcGIS of Coastal common bottlenose dolphin sightings between 1981-1989 with a layer of average sea surface temperatures interpolated across those same years. A picture really is worth a thousand words…or at least a thousand data points…Source: Alexa K.

For many, maps are visually easy to interpret, allowing quick message communication. Yet, there are many different learning styles. From my personal story, I think it’s relatively obvious that I’m, at least partially, a visual learner. When I was in primary school, I would read the directions thoroughly, but only truly absorb the material once the teacher showed me an example. Set up an experiment? Sure, I’ll read the lab report, but I’m going to refer to the diagrams of the set-up constantly. To this day, I always ask for an example. Teach me a new game? Let’s play the first round and then I’ll pick it up. It’s how I learned to sail. My dad described every part of the sailboat in detail and all I heard was words. Then, my dad showed me how to sail, and it came naturally. It’s only as an adult that I know what “that blue line thingy” is called. Geospatial ecology is how I SEE my research. It makes sense to me. And, hopefully, it makes sense to some of you!

Alexa’s dad teaching her how to sail. (Source: Susan K. circa 2000)
Alexa’s first solo sailboat race in Coronado, San Diego, CA. Notice: Alexa’s dad pushing the bow off the dock and the look on Alexa’s face. (Source: Susan K. circa 2000)
Alexa mapping data using ArcGIS in the Oregon State University Library. (Source: Alexa K circa a few minutes prior to posting).

I strongly believe a meaningful career allows you to highlight your passions and personal strengths. For me, that means photography, all things nautical, the great outdoors, wildlife conservation, and maps/charts.  If I converted that into an equation, I think this is a likely result:

Photography + Nautical + Outdoors + Wildlife Conservation + Maps/Charts = Geospatial Ecology of Marine Megafauna

Or, better yet:

? + ⚓ + ? + ? + ? =  GEMM Lab

This lab was my solution all along. As part of my research on common bottlenose dolphins, I work on a small inflatable boat off the coast of California (nautical ✅, outdoors ✅), photograph their dorsal fin (photography ✅), and communicate my data using informative maps that will hopefully bring positive change to the marine environment (maps/charts ✅, wildlife conservation✅). Geospatial ecology allows me to participate in research that I deeply enjoy and hopefully, will make the world a little bit of a better place. Oh, and make maps.

Alexa in the field, putting all those years of sailing and chart-reading to use! (Source: Leila L.)


Living the Dream – life as a marine mammal observer

By Florence Sullivan, MSc.

Living the dream as a marine mammal observer onboard the R/V Bell Shimada Photo credit: Dave Jacobsen

I first learned that “Marine Mammal Observer” was a legitimate career field during the summer after my junior year at the University of Washington.  I had the good fortune to volunteer for the BASIS fisheries-oceanography survey onboard the R/V Oscar Dyson where I met two wonderful bird observers who taught me how to identify various pelagic bird species and clued me in to just how diverse the marine science job market can be. After the cruise, younger Florence went off with an expanded world view and a small dream that maybe someday she could go out to sea and survey for marine mammals on a regular basis (and get paid for it?!).  Eight years later, I am happy to report that I have just spent the last week as the marine mammal observer on the North California Current Survey on the Dyson’s sister ship, the R/V Bell M. Shimada.  While we may not have seen as many marine mammals as I would have liked, the experience has still been everything younger Florence hoped it would be.

Finally leaving port a few days behind schedule due to stormy weather! photo credit: Florence Sullivan

If you’ve ever wondered why the scientists in your life may refer to summer as “field work season”, it’s because attempting to do research outside in the winter is an exercise in frustration, troubleshooting, and flexibility. Case in point; this cruise was supposed to sail away from port on the 24th of February, but did not end up leaving until the 27th due to bad weather.  This weather delay meant that we had to cut some oceanographic stations we would like to have sampled, and even when we made it out of the harbor, the rough weather made it impossible to sample some of the stations we still had left on our map.  That being said, we still got a lot of good work done!

The original station map. The warm colors are the west coast of the US, the cold colors are the ocean, and the black dots are planned survey stations

The oceanographers were able to conduct CTD casts at most planned stations, as well as sample the water column with a vertical zooplankton net, a HAB net (for looking for the organisms that cause Harmful Algal Blooms),  and a Bongo Net (a net that specializes in getting horizontal samples of the water column).  When it wasn’t too windy, they were also able to sample with the Manta net (a net specialized for surface sampling – it looks like a manta ray’s mouth) and at certain near-shore stations they did manage to get some bottom beam trawls in to look at the benthic community of fishes and invertebrates.  All this was done while dodging multitudes of crab pots and storm fronts.  The NOAA corps officers who drive the boat, and the deck crew who handle all the equipment deployments and retrievals really did their utmost to make sure we were able to work.

Stormy seas make for difficult sampling conditions! photo credit: Florence Sullivan

For my part, I spent the hours between stations searching the wind-tossed waves for any sign of marine mammals. Over the course of the week, I saw a few Northern fur seals, half a dozen gray whales, and a couple of unidentified large cetaceans.  When you think about the productivity of the North Pacific Ecosystem this may not seem like very much.  But remember, it is late winter, and I do not have x-ray vision to see through the waves.  It is likely that I missed a number of animals simply because the swell was too large, and when we calculate our “detection probability” these weather factors will be taken into account. In addition, many of our local marine mammals are migrators who might be in warmer climates, or are off chasing different food sources at the moment.  In ecology, when you want to know how a population of animals is distributed across a land- or sea-scape, it is just as important to understand where the animals are NOT as where they ARE. So all of this “empty” water was very important to survey simply because it helps us refine our understanding of where animals don’t want to be.  When we know where animals AREN’T we can ask better questions about why they occur where they ARE.

Black Footed Albatross soars near the boat. Photo credit: Florence Sullivan

Notable species of the week aside from the marine mammals include Laysan and Black Footed Albatrosses, a host of Vellella vellella (sailor by the wind hydroid colonies) and the perennial favorite of oceanographers; the shrinking Styrofoam cup.  (See pictures)

We sent these styrofoam cups down to 1800 meters depth. The pressure at those depths causes all the air to escape from the styrofoam, and it shrinks! This is a favorite activity of oceanographers to demonstrate the effects on increased pressure!

These sorts of interdisciplinary cruises are quite fun and informative to participate in because we can build a better picture of the ecosystem as a whole when we use a multitude of methods to explore it.  This strength of cooperation makes me proud to add my little piece to the puzzle. As I move forward in life, whether I get to be the marine mammal observer, the oceanographer, or perhaps an educator, I will always be glad to contribute to collaborative research.