By Leila Lemos, Ph.D. Student, Department of Fisheries and Wildlife, OSU
August 5th was the Olympic games opening date in Rio de Janeiro, Brazil, the city where I am from. The opening ceremony was a big success and everybody seems to be enjoying the sporting events and all of the news that the city is offering. However, behind all the colors, magic and joy of this big event, Brazilians are very unsatisfied about hosting an event like this while the whole country is simultaneously dealing with a big educational, health, political and economic crisis at the moment.
Unfortunately, the crisis also affects the environment and is consequently affecting athletes that are competing in our “carioca” waters. Guanabara Bay, more specifically, where the sailing competitions are taking place, receive waters from more than 50 rivers and streams, as displayed below.

Much of the water is not treated and brings sewage and garbage from upstream (Fig.2). Although the government reports that the pollution index in the Bay conforms to national and international standards, and that the areas where competitions are taking place are clean and present no risk to athlete health, public health experts advise athletes to keep their mouth closed whenever they are in contact with the water, as reported by the Independent newspaper (http://www.independent.co.uk/sport/olympics/2016-rio-olympics-water-feces-athletes -mouth-shut-brazil-a7163021.html). The goal was to clean up 80% of the Bay in time for the Olympic games, however this goal was far from achieved and the “solution” was to install barriers to try to avoid waste and untreated sewage reaching the event area.

Source: http://www.insidethegames.biz/articles/1027142/brazilian-politician-accused-of-undermining-effort-to-clean-guanabara-bay-by-publicity-seeking-jump-into-water.
Bacteria, fecal coliforms and metals occur in the Bay. Professionals from Oswaldo Cruz Foundation (Fiocruz), one of the world’s main public health research institutions, found a drug-resistant bacterium in the Bay waters, which is resistant to antibiotics and may cause multiple infections (https://www.rt.com/news/214807-brazil-olympic-venue-superbug/). Metals like mercury, one of the most toxic metals, can also be found in the Bay and shows long-term effects on marine life of the ecosystem.
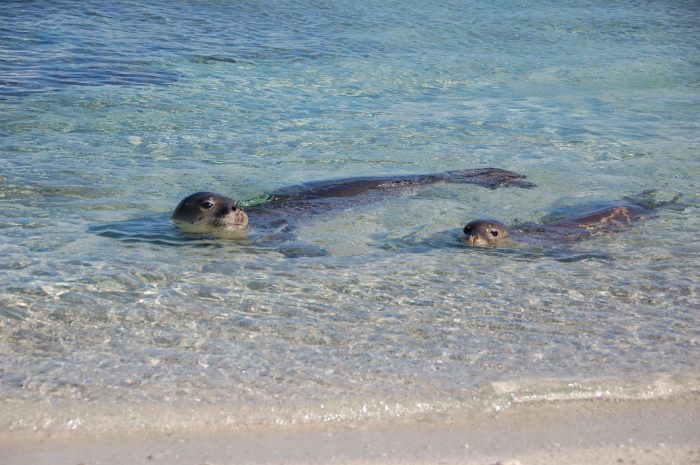
Guanabara Bay used to be part of the migratory route of Southern right whales (Eubalaena australis), but unfortunately we do not see the whales in the area anymore. We also do not see turtles any longer and populations of prawns are extremely reduced. On the other hand, mussels, biological indicators of ambient pollution due to their sessile and filter-feeding habits, are continuously proliferating in the Bay. These individuals can accumulate high pollutant levels and are not safe to eat when present in polluted areas. However, local fishermen persist in eating mussels and fish from the Bay.
The Guiana dolphin (Sotalia guianensis) is the only mammal that still frequents the Bay waters and, while about 400 Guiana dolphins inhabited the region in the 80s, currently there are only 34 individuals (http://www.abc.net.au/news/2016-06-27/rio27s-dolphins-need-olympic-effort-to-survive-toxic-waters/7543544). The project MAQUA, responsible for monitoring the dolphins in the Guanabara Bay, correlated the decline of the population with worsening water quality, fishing and noise, as published in an article in “O Globo”, the main Brazilian newspaper (http://oglobo.globo.com/rio/populacao-de-golfinhos-da-baia-de-guanabara-sofre-reducao-de-90-em-tres-decadas-1-16110633).
In this article they presented pictures of dolphins from the Guiana dolphin population in the Bay, including the unfortunate consequences on human interactions (Fig.3).

Source: O Globo, 2015 (http://oglobo.globo.com/rio/populacao-de-golfinhos-da-baia-de-guanabara-sofre-reducao-de-90-em-tres-decadas-1-16110633).
This dolphin population is living in heavily polluted waters caused solely by human behavior. Although dolphins may distinguish between trash and food, they feed on contaminated fish – a consequence of bioaccumulation.
During my master’s degree at the Oswaldo Cruz Foundation in Rio de Janeiro, I undertook a toxicological analysis of different species of dolphins (Lemos et al. 2013; http://www.sciencedirect.com/science/article/pii/S0147651313003370). We found high levels of different metals, such as mercury and cadmium, in animals along the north coast of Rio de Janeiro. Just like the mussels, dolphins bioaccumulate high pollutant levels in their tissues and organs, primarily via feeding, but also through dermal contact. Metals and other pollutants present in polluted waters, like the Guanabara Bay, enter the food chain and affect multiple trophic levels, compromising health.
Dolphins from the Guanabara Bay are feeding on the same prey as the local fisherman, and act as sentinels of the environment, warning of public health concerns for humans. Just like humans, these dolphins are long-lived and large mammals, but they live every day in these waters and must open their mouths to survive. If we are concerned about human athletes spending a few hours in the water, we should be outraged at the conditions we force marine animals to live in daily in the Rio de Janeiro region. The dolphins have the intrinsic right to live in a non-polluted environment and be healthy.