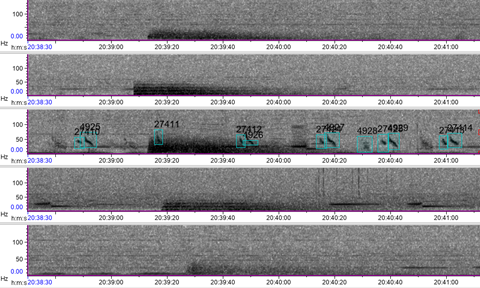
Hearing Gray: Diving into the Sonic World of the Gray Whale

By Natalie Nickells, visiting PhD Student, British Antarctic Survey

For the last three months, I’ve been lucky enough to be welcomed into the GEMM lab as a visiting PhD student to work on the acoustic data from hydrophones in CATS tags deployed on gray whales. This work has been a huge change for me! I’ve gone from studying Antarctic baleen whale foraging, the topic of my PhD, from a distance at my desk in Cambridge England, to studying PCFG gray whales in Newport- and finally being in the same country, state, and even county to the whales I am studying! Unlike my Antarctic research, where whale blows in the distance become tiny points in a sea of data, listening to the CATS tag data has allowed me to really connect with these animals on an emotional level, as I’ve spent days, weeks and months listening to the world as they hear it.

Humans are fundamentally visual creatures- we take in information through sight first, with hearing probably our second, or for some even third, sense in line. However, for marine mammals, the same cannot be said: their world is auditory first. This fact is an important realisation to get our heads around, highlighted beautifully by the phrase “the ears are the window to the soul of the whale” (Sonic Sea (2017)) or Tim Donaghy’s emotive statement that “a deaf whale is a dead whale”. High levels of ocean noise therefore have a huge impact on baleen whales. Imagine trying to do your groceries or find a friend while blindfolded or in a thick fog– you might struggle to access food or communicate with others, and your stress would certainly be high. To succeed, you would likely need to change your behaviour.

Behavioural changes in response to ocean noise are observed in baleen whales: for example, humpback whales change their foraging behaviour when ship noise increases (Blair et al., 2016), and gray whales have been shown to call more frequently and possibly more loudly in conditions of high ocean noise (Dahlheim & Castellote, 2016). However, even in the absence of notable behaviour change due to ocean noise,  North Atlantic  right whales  may still be experiencing a stress response. When shipping traffic in the Bay of Fundy significantly decreased in the aftermath of 9/11, North Atlantic  right whales in the area had decreased chronic stress levels (Rolland et al., 2012).

Previous work by the GEMM lab observed this stress response to ocean noise in gray whales. They found a correlation between high levels of glucocorticoid (a stress indicator) in male gray whale faeces with high vessel noise and vessel counts in the area. Vessel noise was measured using two static hydrophones off the Oregon coast, and it was assumed all animals in the area experienced the same noise (Lemos et al., 2022; Pirotta et al., 2023). However, a static hydrophone is an imperfect measure of the sound levels a mobile animal experiences, particularly as we might expect animals to change behaviour when disturbed (Sullivan & Torres, 2018).  This previous work became the starting point for the question I have addressed during my time in the GEMM Lab: can we measure and characterise the sound levels  an individual whale was exposed to? Enter CATS tags. These are suction-cup tags fitted with a host of sensors, which have been used by the GEMM lab since 2021 (see Image 1). So far, they have mostly been used for their accelerometry data (Colson et al. (in press), see also Kate’s blog post). However, the GEMM lab had the foresight to put hydrophones on these tags, and as a result I was welcomed into the lab by a bumper-crop of hydrophone data just waiting to be analysed!
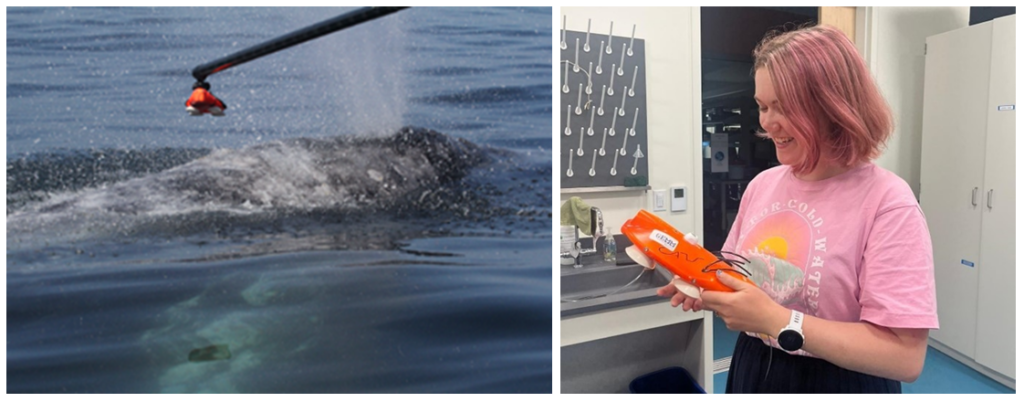
Image 1: A gray whale (“Slush”) being tagged with a CATS tag and Natalie (right) with the same tag.

This tag data is particularly valuable, not only for its ability to follow the acoustic world of an individual whale, but also due to the whole suite of data that comes with the acoustics: essentially, the acoustic data comes with behavioural data. Or at least, it comes with data from which we can infer behaviour (Colson et al, in press)! Incorporating behaviour into passive acoustics work hugely strengthens its ecological usefulness (Oestreich et al., 2024). We can hear what an individual whale is hearing, and we can also infer what they were doing before, during, and after they heard or made that sound. Having behavioural data also means that we can ground-truth the sounds we hear. When hearing an interesting sound, I can go back to the video data and accelerometer data to check what the whale sees, what its body-position is doing (e.g., is it headstand foraging?) and the speed and direction of its travel. Context is key!

The importance of context was highlighted in my very first week here in the GEMM lab. I became very interested in a sound I could hear frequently when the whale would surface- a distorted bark-like noise, but the whale was surely too far offshore for any barking dog to be heard? And almost every time the whale surfaced? After a few days pondering, I shared my mystery with Leigh, who laughingly revealed that one of the whale-watching boats in this area has a ‘whale-alerting’ dog on board! Sometimes if it sounds like a dog… it’s a dog! Besides my slightly anticlimactic discovery of dogs barking, committing time to listening to the tags and hearing what the whales hear, has been a magical experience. My favourite hydrophone sound, that still gets me excited when I hear it, is the gray whale ‘bongo call’- or as it’s more formally known in the literature, M1 vocalisation (Guazzo et al., 2019). I’ll let you decide which name is more appropriate! I first heard this call when investigating a time on “Scarlett’s” tag when we knew her 14 year-old daughter “Pacman” had been close: about 15 minutes before “Pacman” appears on the video, Scarlett makes this call (you can play the clip below to listen).  In “Lunita’s” tag, we even hear this call three times in a row!

Image 2: A ‘bongo call’ made by “Scarlett” when her daughter “Pacman” was nearby.

Relatively little research has been done on gray whale calls compared to other more studied species like humpbacks. Most of this research has taken place on gray whale migratory routes (Guazzo et al., 2019, 2017; Burnham et al. 2018)  or in captivity (Fish et. al, 1974 ) so these tag recordings could be a valuable addition to a small sample from the foraging grounds (Clayton et al., 2023; Haver et al., 2023)- as well as being very personally exciting to hear!

We’ve also been able to use the tag hydrophone data to look at close calls with ships. As I was going through the data on “Scarlett’s” tag, I noticed a spike in vessel noise. Looking at the video from the same timestamp, I could see a small vessel passing directly over her as she surfaced. At the time this vessel passed over her, the tag was only 0.8 m under the surface of the water!

Image 3: A close encounter between a small vessel and “Scarlett”, shown both on the video from the CATS tag (top) and the spectrogram (bottom). The close call is outlined in a yellow box, when a greater intensity of noise occurred as illustrated by the brighter colour intensity compared to the white box (quieter vessel noise). Brighter colours denote a louder volume. The red boxes show surfacing noise- this can essentially be ignored when interpreting the echogram for our purposes.

Sometimes vessels may be more distant, but possibly equally harmful: we have seen vessel noise from larger and presumably more distant vessels dominate the soundscape in some of the tag data. Remembering that to a whale, the sonic world is as important as the visual world is to us, this elevated background noise from ships could have major consequences. So, the first step is to try to quantify the gray whales’ exposure to this vessel noise. I’ve been running some systematic sampling on the tag data to try to quantify background noise levels, and how this changes depending on the time of day: do individual whales experience the same daily spikes in ocean noise that were detected on the static hydrophones, at around 6am and noon due to vessel traffic (Haver et al., 2023)? If not, are they taking evasive action to avoid these spikes? These are just some of the questions that these CATS tags can help us answer, although ideally we need longer acoustic data recordings to capture day and night data, as well as potentially improving the hydrophones on the CATS tags themselves to minimise the impacts of tag interference and random noise.

When explaining to the public what it is to be a PhD student, I often refer to myself as a ‘scientist in training’, or to young children, a ‘baby scientist’. As I look toward my departure from the GEMM lab, I hope to have developed into at least a scientific toddler, having gained the ability to walk through reams of acoustic data with (relative) independence. More than that, I’m excited to take home a refreshed sense of curiosity about what drives marine mammals to behave as they do, an openness to collaboration and new approaches, and a large dose of ‘American emotion’! Let’s hope my British colleagues can handle it!

My heartfelt thanks to all those who welcomed me so warmly at the GEMM lab and Oregon State University, particularly my mentors Leigh Torres and Samara Haver.

Did you enjoy this blog? Want to learn more about marine life, research, and conservation? Subscribe to our blog and get a weekly alert when we make a new post! Just add your name into the subscribe box below!

Loading

Bibliography

Sonic Sea (2017) Directed by Michelle Dougherty [Film] Distributed by the Natural Resources Defense Council.

Blair, H.B., Merchant, N.D., Friedlaender, A.S., Wiley, D.N. & Parks, S.E. (2016) Evidence for ship noise impacts on humpback whale foraging behaviour. Biology Letters. 12 (8), 20160005. doi:10.1098/rsbl.2016.0005.

Burnham, R., Duffus, D. & Mouy, X. (2018) Gray Whale (Eschrictius robustus) Call Types Recorded During Migration off the West Coast of Vancouver Island. Frontiers in Marine Science. 5, 329. doi:10.3389/fmars.2018.00329.

Colson, K., E. Pirotta L. New, D Cade, J Calambokidis, K. Bierlich, C Bird, A Fernandez Ajó, L. Hildebrand, A. Trites, L. Torres. (in press). Using accelerometry tags to quantify gray whale foraging behavior. Marine Mammal Science.

Clayton, H., Cade, D.E., Burnham, R., Calambokidis, J. & Goldbogen, J. (2023) Acoustic behavior of gray whales tagged with biologging devices on foraging grounds. Frontiers in Marine Science. 10, 1111666. doi:10.3389/fmars.2023.1111666.

Dahlheim, M. & Castellote, M. (2016) Changes in the acoustic behavior of gray whales Eschrichtius robustus in response to noise. Endangered Species Research. 31, 227–242. doi:10.3354/esr00759.

Fish, J.F., Sumich, J.L. & Lingle, G.L. (n.d.) Sounds Produced by the Gray Whale, Eschrichtius robustus.

Guazzo, R., Schulman-Janiger, A., Smith, M., Barlow, J., D’Spain, G., Rimington, D. & Hildebrand, J. (2019) Gray whale migration patterns through the Southern California Bight from multi-year visual and acoustic monitoring. Marine Ecology Progress Series. 625, 181–203. doi:10.3354/meps12989.

Guazzo, R.A., Helble, T.A., D’Spain, G.L., Weller, D.W., Wiggins, S.M. & Hildebrand, J.A. (2017) Migratory behavior of eastern North Pacific gray whales tracked using a hydrophone array S. Li (ed.). PLOS ONE. 12 (10), e0185585. doi:10.1371/journal.pone.0185585.

Haver, S.M., Haxel, J., Dziak, R.P., Roche, L., Matsumoto, H., Hvidsten, C. & Torres, L.G. (2023) The variable influence of anthropogenic noise on summer season coastal underwater soundscapes near a port and marine reserve. Marine Pollution Bulletin. 194, 115406. doi:10.1016/j.marpolbul.2023.115406.

Lemos, L.S., Haxel, J.H., Olsen, A., Burnett, J.D., Smith, A., Chandler, T.E., Nieukirk, S.L., Larson, S.E., Hunt, K.E. & Torres, L.G. (2022) Effects of vessel traffic and ocean noise on gray whale stress hormones. Scientific Reports. 12 (1), 18580. doi:10.1038/s41598-022-14510-5.

Oestreich, W.K., Oliver, R.Y., Chapman, M.S., Go, M.C. & McKenna, M.F. (2024) Listening to animal behavior to understand changing ecosystems. Trends in Ecology & Evolution. S0169534724001459. doi:10.1016/j.tree.2024.06.007.

Pirotta, E., Fernandez Ajó, A., Bierlich, K.C., Bird, C.N., Buck, C.L., Haver, S.M., Haxel, J.H., Hildebrand, L., Hunt, K.E., Lemos, L.S., New, L. & Torres, L.G. (2023) Assessing variation in faecal glucocorticoid concentrations in gray whales exposed to anthropogenic stressors S. Cooke (ed.). Conservation Physiology. 11 (1), coad082. doi:10.1093/conphys/coad082.

Rolland, R.M., Parks, S.E., Hunt, K.E., Castellote, M., Corkeron, P.J., Nowacek, D.P., Wasser, S.K. & Kraus, S.D. (2012) Evidence that ship noise increases stress in right whales. Proceedings of the Royal Society B: Biological Sciences. 279 (1737), 2363–2368. doi:10.1098/rspb.2011.2429.

Sullivan, F.A. & Torres, L.G. (2018) Assessment of vessel disturbance to gray whales to inform sustainable ecotourism. The Journal of Wildlife Management. 82 (5), 896–905. doi:10.1002/jwmg.21462.
Putting Fitbits on whales: How tag data allows for estimating calories burned by foraging PCFG gray whales

By: Kate Colson, MSc Student, University of British Columbia, Institute for the Oceans and Fisheries, Marine Mammal Research Unit

Hello! My name is Kate Colson and I am a master’s student at the University of British Columbia, co-supervised by Dr. Andrew Trites of the Marine Mammal Research Unit and Dr. Leigh Torres of the GEMM Lab. As part of my thesis work, I have had the opportunity to spend the summer field season with Leigh and the GEMM Lab team. 

For my master’s I am studying the foraging energetics of Pacific Coast Feeding Group (PCFG) gray whales as part of the much larger Gray whale Response to Ambient Noise Informed by Technology and Ecology (GRANITE) project. Quantifying the energy expenditure of PCFG gray whales during foraging can help establish a baseline for how disturbance impacts the ability of this unique population to meet their energy needs. Additionally, determining how many calories are burned during different PCFG foraging behaviors might help explain why some gray whales are in better body condition than others.

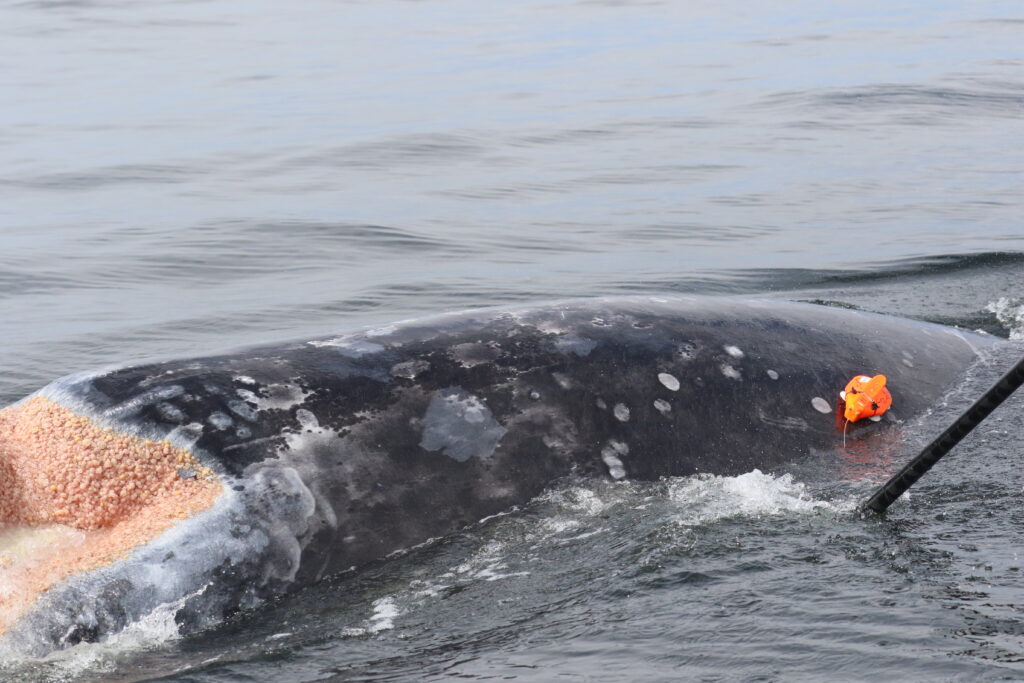
To understand how much energy different PCFG foraging behaviors cost, I am using data from suction cup tags we have temporarily applied on PCFG gray whales (Figure 1). You can read more about the why the GEMM Lab started using these tags in an earlier blog here. What I want to talk about in this blog is how exactly we can use this tag data to estimate energy expenditure of PCFG gray whales. 

Figure 1. The famous “Scarlett” with a suction cup tag just attached using a carbon fiber pole (seen on far right). This minimally invasive tag has many data sensors, all of which sample at high frequencies, that can allow for an estimation of energy expenditure for different gray whale behaviors. Source: GEMM Lab; National Marine Fisheries Service (NMFS) permit no. 21678 

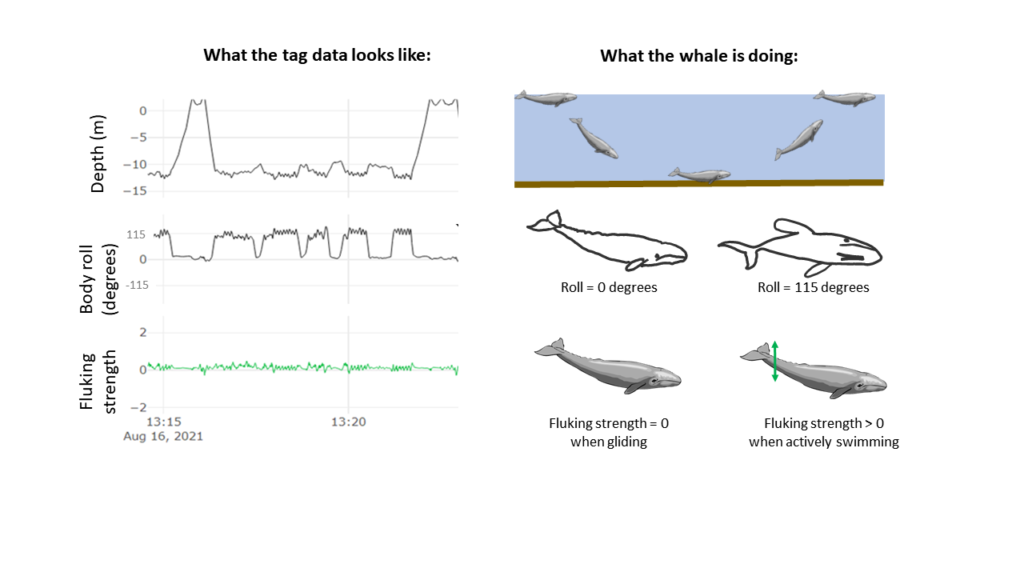
The suction cups tags used in this project have many data sensors that are useful for describing the movement of the tagged whale including accelerometers, magnetometers, gyroscopes, and pressure sensors, and all are sampling at high frequencies. For example, the accelerometer is taking 400 measurements per second! The accelerometer, magnetometer, and gyroscope take measurements in 3 dimensions along the X, Y, and Z-axes. The whale’s movement around the X-axis indicates roll (if the whale is swimming on its side), while movement around the Y-axis indicates pitch (if the whales head is oriented towards the surface or the sea floor). Changes in the whale’s movement around the Z-axis indicates if the whale is changing its swimming direction. Together, all of these sensors can describe the dive profile, body orientation, fluking behavior, and fine-scale body movements of the animal down to the second (Figure 2). This allows for the behavior of the tagged whale to be specifically described for the entirety of the tag deployment. 

Figure 2. An example of what the tag sensor data looks like. The top panels show the depth of the animal and can be used to determine the diving behavior of the whale. The middle panels show the body roll of the whale (the X axis) —a roll value close to 0 means the whale is swimming “normally” with no rotation to either side, while a higher roll value means the whale is positioned on its side. The bottom panels show the fluking behavior of the animal: each spike is the whale using its tail to propel itself through the water, with higher spikes indicating a stronger fluke stroke. Source: GEMM Lab, NMFS permit no. 21678

Although these suction cup tags are a great advancement in collecting fine-scale data, they do not have a sensor that actually measures the whale’s metabolism, or rate of calories burned by the whale. Thus, to use this fine-scale tag data as an estimate for energy expenditure, a summary metric must be calculated from the data and used as a proxy. The most common metric found in the literature is Overall Dynamic Body Acceleration (ODBA) and many papers have been published discussing the pros and cons of using ODBA as a proxy for energy expenditure (Brown et al., 2013; Gleiss et al., 2011; Halsey, 2017; Halsey et al., 2011; Wilson et al., 2020). The theory behind ODBA is that because an animal’s metabolic rate is primarily comprised of movement costs, then measuring the acceleration of the body is an effective way of determining energy expenditure. This theory might seem very abstract, but if you have ever worn a Fitbit or similar fitness tracking device to estimate how many calories you’ve burned during a workout, the same principle applies. Those fitness devices use accelerometers and other sensors, to measure the movement of your limbs and produce estimates of energy used. 

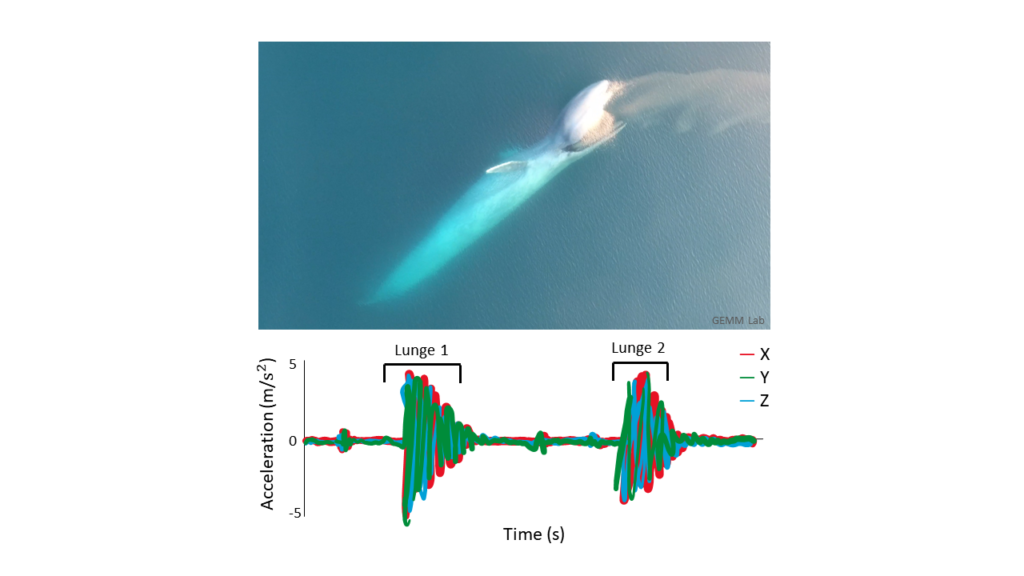
So now that we’ve established that the goal of my research is to essentially use these suction cup tags as Fitbits for PCFG gray whales, let’s look at how accelerometry data has been used to detect foraging behavior in large whales so far. Many accelerometry tagging studies have used rorquals as a focal species (see Shadwick et al. (2019) for a review). Well-known rorqual species include humpback, fin, and blue whales. These species forage by using lunges to bulk feed on dense prey patches in the water column. Foraging lunges are indicated by isolated periods of high acceleration that are easily detectable in the tag data (Figure 3; Cade et al., 2016; Izadi et al., 2022). 

Figure 3. Top image: A foraging blue whale performing a surface lunge (Photo credit: GEMM Lab). Note the dense aggregation of krill in the whale’s mouth. Bottom image: The signature acceleration signal for lunge feeding (adapted from Izadi et al., 2022). Each color represents one of the 3D axes of whale movement. The discrete periods of high acceleration represent lunges

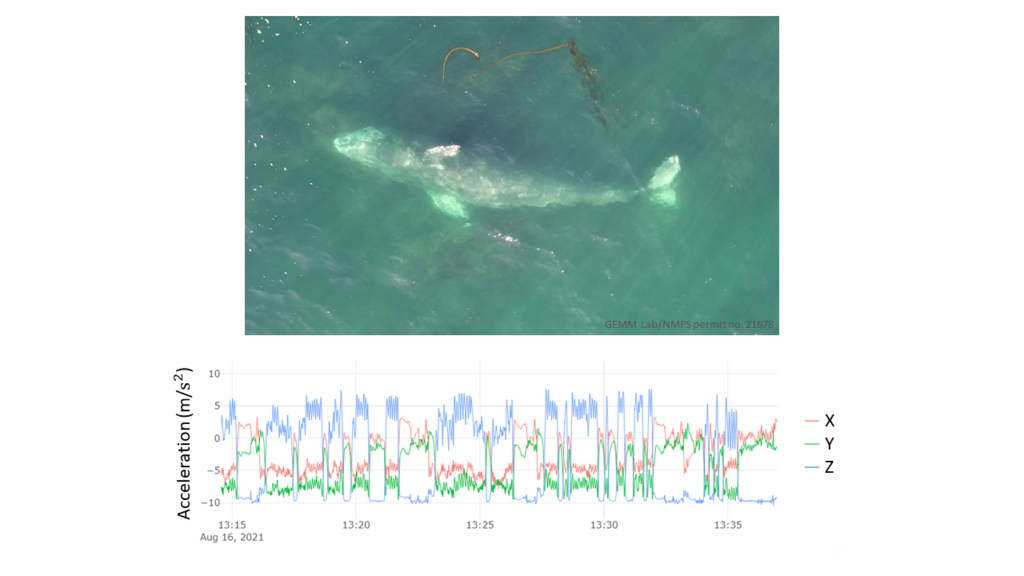
However, gray whales feed very differently from rorquals. Gray whales primarily suction feed on the benthos, using their head to dig into the sediment and filter prey out of the mud using their baleen. Yet,  PCFG gray whales often perform many other foraging behaviors such as headstanding and side-swimming (Torres et al., 2018). Additionally, PCFG gray whales tend to feed in water depths that are often shallower than their body length. This shallow depth makes it difficult to isolate signals of foraging in the accelerometry data from random variation in the data and separate the tag data into periods of foraging behaviors (Figure 4).

Figure 4. Top image: A foraging PCFG gray whale rolls on its side to feed on mysid prey. Bottom image: The graph shows the accelerometry data from our suction cup tags that can be used to calculate Overall Dynamic Body Acceleration (ODBA) as a way to estimate energy expenditure. Each color represents a different axis in the 3D motion of the whale. The X-axis is the horizontal axis shows forward and backward movement of the whale, the Y-axis shows the side-to-side movement of the whale, and the Z-axis shows the up-down motion of the whale. Note how there are no clear periods of high acceleration in all 3 axes simultaneously to indicate different foraging behaviors like is apparent during lunges of rorqual whales. However, there is a pattern showing that when acceleration in the Z-axis (blue line) is positive, the X- and Y-axes (red and green lines) are negative. Source: GEMM Lab; NMSF permit no. 21678

But there is still hope! Thanks to the GEMM Lab’s previous work describing the foraging behavior of the PCFG sub-group using drone footage, and the video footage available from the suction cup tags deployed on PCFG gray whales, the body orientation calculated from the tag data can be a useful indication of foraging. Specifically, high body roll is apparent in many foraging behaviors known to be used by the PCFG, and when the tag data indicates that the PCFG gray whale is rolled onto its sides, lots of sediment (and sometimes even swarms of mysid prey) is seen in the tag video footage. Therefore, I am busy isolating these high roll events in the collected tag data to identify specific foraging events. 

My next steps after isolating all the roll events will be to use other variables such as duration of the roll event and body pitch (i.e., if the whales head is angled down), to define different foraging behaviors present in the tag data. Then, I will use the accelerometry data to quantify the energetic cost of performing these behaviors, perhaps using ODBA. Hopefully when I visit the GEMM Lab again next summer, I will be ready to share which foraging behavior leads to PCFG gray whales burning the most calories!

References

Brown, D. D., Kays, R., Wikelski, M., Wilson, R., & Klimley, A. P. (2013). Observing the unwatchable through acceleration logging of animal behavior. Animal Biotelemetry1(1), 1–16. https://doi.org/10.1186/2050-3385-1-20

Cade, D. E., Friedlaender, A. S., Calambokidis, J., & Goldbogen, J. A. (2016). Kinematic diversity in rorqual whale feeding mechanisms. Current Biology26(19), 2617–2624. https://doi.org/10.1016/j.cub.2016.07.037

Duley, P. n.d. Fin whales feeding [photograph]. NOAA Northeast Fisheries Science Center Photo Gallery. https://apps-nefsc.fisheries.noaa.gov/rcb/photogallery/finback-whales.html

Gleiss, A. C., Wilson, R. P., & Shepard, E. L. C. (2011). Making overall dynamic body acceleration work: On the theory of acceleration as a proxy for energy expenditure. Methods in Ecology and Evolution2(1), 23–33. https://doi.org/10.1111/j.2041-210X.2010.00057.x

Halsey, L. G. (2017). Relationships grow with time: A note of caution about energy expenditure-proxy correlations, focussing on accelerometry as an example. Functional Ecology31(6), 1176–1183. https://doi.org/10.1111/1365-2435.12822

Halsey, L. G., Shepard, E. L. C., & Wilson, R. P. (2011). Assessing the development and application of the accelerometry technique for estimating energy expenditure. Comparative Biochemistry and Physiology – A Molecular and Integrative Physiology158(3), 305–314. https://doi.org/10.1016/j.cbpa.2010.09.002

Izadi, S., Aguilar de Soto, N., Constantine, R., & Johnson, M. (2022). Feeding tactics of resident Bryde’s whales in New Zealand. Marine Mammal Science, 1–14. https://doi.org/10.1111/mms.12918

Shadwick, R. E., Potvin, J., & Goldbogen, J. A. (2019). Lunge feeding in rorqual whales. Physiology34, 409–418. https://doi.org/10.1152/physiol.00010.2019

Torres, L. G., Nieukirk, S. L., Lemos, L., & Chandler, T. E. (2018). Drone up! Quantifying whale behavior from a new perspective improves observational capacity. Frontiers in Marine Science5, 1–14. https://doi.org/10.3389/fmars.2018.00319

Wilson, R. P., Börger, L., Holton, M. D., Scantlebury, D. M., Gómez-Laich, A., Quintana, F., Rosell, F., Graf, P. M., Williams, H., Gunner, R., Hopkins, L., Marks, N., Geraldi, N. R., Duarte, C. M., Scott, R., Strano, M. S., Robotka, H., Eizaguirre, C., Fahlman, A., & Shepard, E. L. C. (2020). Estimates for energy expenditure in free-living animals using acceleration proxies: A reappraisal. Journal of Animal Ecology89(1), 161–172. https://doi.org/10.1111/1365-2656.13040

Do you lose SLEAP over video analysis of gray whale behavior? Not us in the GEMM Lab! 

Celest Sorrentino, University of California, Santa Barbara, Department of Ecological, Evolution, and Marine Biology, GEMM Lab NSF REU intern

Are you thinking “Did anyone proofread this blog beforehand? Don’t they know how to spell SLEEP?”  I completely understand this concern, but not to fear: the spelling of SLEAP is intentional! We’ll address that clickbait in just a moment. 

My name is Celest Sorrentino, a first-generation Latina undergrad who leaped at the opportunity to depart from the beaches of Santa Barbara, California to misty Newport, Oregon to learn and grow as a scientist under the influential guidance of Clara Bird, Dr. Leigh Torres and the powerhouse otherwise known as the GEMM lab. As a recent NSF REU (Research Experience for Undergraduates) intern in the GEMM Lab at Oregon State University, I am thrilled to have the chance to finally let you in on the project Clara, Leigh and I have been working on all summer. Ready for this?

Our project uses a deep-learning platform called SLEAP A.I. ( https://sleap.ai/) that can predict and track multiple animals in video to track gray whale mother calf pairs in drone footage. We also took this project a step further and explored how the distance between a gray whale mother and her calf, a proxy for calf independence, varied throughout the season and by different calf characteristics. 

In this story, we’ve got a little bit for everyone: the dynamic duo of computer vision and machine learning for my data scientist friends, and ecological inquest for my cetacean researcher friends. 

About the Author

Before we begin, I’d like to share that I am not a data scientist. I’ve only ever taken one coding class. I also do not have years of gray whale expertise under my belt (not yet at least!). I’m entering my 5th year at University of California, Santa Barbara as a double major in Ecology and Evolution (BS) as well as Italian Studies (BA). I am sharing this information to convey the feasibility of learning how to use machine-learning as a solution to streamline the laborious task of video analysis, which would permit more time towards answering your own ecological question, as we did here.

Essential Background

Hundreds of Hours of Drone footage

Since 2016, the GEMM Lab has been collecting drone footage of gray whales off the Oregon Coast to observe gray whale behavior in more detail (Torres et al. 2018). Drones have been shown to increase observational time of gray whales by a three-fold (Torres et al. 2018), including the opportunity to revisit the video with fresh eyes at any time one pleases. The GEMM Lab has flow over 500 flights in the past 6 years, including limited footage of gray whale mother-calf pairs. Little is known about gray whale mother-calf dynamics and even less about factors that influence calf development. As we cannot interview hundreds of gray-whale mother-calf pairs to develop a baseline for this information, we explore potential proxies for calf development instead (similar to how developmental benchmarks are used for human growth). 

Distance and Development

During our own life journey, each of us became less and less dependent on our parents to survive on our own. Formulating our first words so that we can talk for ourselves, cracking an egg for our parents so that we can one day cook for ourselves, or even letting go of their hand when crossing the street. For humans, we spend many years with our kin preparing for these moments, but gray whale mother-calf pairs only have a few months after birth until they separate. Gray whale calves are born on their wintering grounds in Baja California, Mexico (around February), migrate north with their mothers to the foraging grounds, and are then weaned during the foraging season (we think around August). This short time with their mother means that they have to become independent pretty quickly (about 6 months!).

Distance between mother and calf can be considered a measure of independence because we would expect increased distance between the pair as calf independence increases. In a study by Nielson et al (2019), distance between Southern Right Whale mother-calf pairs was found to increase as the calf grew, indicating that it can serve as a good proxy for independence. The moment a mother-calf pair separates has not been documented, but the GEMM lab has footage of calves during the foraging season pre-weaning that can be used to investigate this process.  However, video analysis is no easy feat: video analysis can range from post-processing, diligent evaluation, and video documentation (Torres et al. 2018). Although the use of UAS has become a popular method for many researchers, the extensive time required for video analysis is a limitation. As mentioned in Clara’s blog, the choice to pursue different avenues to streamline this process, such as automation through machine learning, is highly dependent on the purpose and the kind of questions a project intends to answer.

SLEAP A.I.

 In a world where modern technology is constantly evolving to cater towards making everyday tasks easier, machine learning leads the charge with its ability for a machine to perform human tasks. Deep learning is a subset of machine learning in which the model learns and adapts the ability to perform a task given a dataset. SLEAP (Social LEAP Estimation of Animal Poses) A.I. is an open-source deep-learning framework created to be able to track multiple subjects, specifically animals, throughout a variety of environmental conditions and social dynamics. In previous cases, SLEAP has tracked animals with distinct morphologies and conditions such as mice interactions, fruit flies engaging in courtship, and bee behavior in a petri dish (Pereira 2020). While these studies show that SLEAP could help make video analysis more efficient, these experiments were all conducted on small animals and in controlled environments. However, large megafauna, such as gray whales, cannot be cultivated and observed in a controlled Petri dish. Could SLEAP learn and adapt to predict and track gray whales in an uncontrolled environment, where conditions are never the same (ocean visibility, sunlight, obstructions)? 

Methods

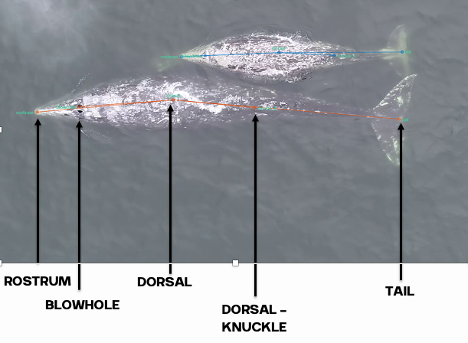
In order to establish a model within SLEAP, we split our mother-calf drone video dataset into training (n=9) and unseen/testing (n=3) videos. Training involves teaching the model to recognize gray whales, and necessitated me to label every four frames using the following labels (anatomical features): rostrum, blowhole, dorsal, dorsal-knuckle, and tail (Fig. 1). Once SLEAP was trained and able to successfully detect gray whales, we ran the model on unseen video. The purpose of using unseen video was to evaluate whether the model could adapt and perform on video it had never seen before, eliminating the need for a labeler to retrain it. 

We then extracted the pixel coordinates for the mom and calf, calculated the distance between their respective dorsal knuckles, and converted the distance to meters using photogrammetry (see KC’s blog  for a great explanation of these methods).  The distance between each pair was then summarized on a daily scale as the average distance and the standard deviation. Standard deviation was explored to understand how variable the distance between mother-calf pair was throughout the day. We then looked at how distance and the standard deviation of distance varied by day of year, calf Total Length (TL), and calf Body Area Index (BAI; a measure of body condition). We hypothesized that these three metrics may be drivers of calf independence (i.e., as the calf gets longer or fatter it becomes more independent from its mother).  

Fig 1. Example of a labelled frame from SLEAP, highlighting labels: rostrum, blowhole, dorsal, dorsal-knuckle, and tail. 

Results

SLEAP A.I. was able to successfully detect and track gray whale mother-calf pairs across all videos (that’s a total of 1318 frames!). When evaluating how the average distance changed across Day of Year, calf Total length, and calf BAI, the plots did not demonstrate the positive relationship we anticipated (Fig 2A). However, when evaluating the standard deviation of distance across Day of Year, calf Total Length, and calf BAI, we did notice that there does appear to be an increase in variability of distance with an increase in Day of Year and calf Total length (Fig 2B)

Fig 2A: Relationship between average distance(m) between each mother and calf (colors represent different named calves) relative to Day of Year, Total length of calf, and BAI of calf. 
Fig 2B: Relationship between standard deviation of  distance(m) between each mother and calf (colors represent different named calves) relative to Day of Year, Total length of calf, and BAI of calf.

Concluding thoughts

These results are monumental! We demonstrated the feasibility to use AI to create a model that can track gray whale pairs in drone footage, which is a fantastic tool that can be applied to updated datasets in the future. As more footage of gray whale mother-calf pairs are collected, this video can be quickly uploaded to SLEAP for model evaluation, predictions can be exported, and results subsequently included in the distance analysis to update our plots and increase our understanding. Our data currently provide a preliminary understanding of how the distance between mother-calf pairs changes with Day of Year, Total length, and BAI, but we are now able to continue updating our dataset as we collect more drone footage. 

I suppose you can say I did mislead you a bit with my title, as I have lost some SLEEP recently. But, not over video analysis per say but rather in the form of inspiration. Inspiration toward expanding my understanding of machine learning so that it can be applied toward answering pressing ecological questions. This project has only propelled me to dig my heels in and investigate further the potential of machine learning to analyze dense datasets for huge knowledge gains.

Fig 3A: Snapshot of Celest working in SLEAP GUI.

Acknowledgements

This project was made possible in partnership by the continuous support by Clara Bird, Dr. Leigh Torres, KC Bierlich, and the entire GEMM Lab!

References

Nielsen, M., Sprogis, K., Bejder, L., Madsen, P., & Christiansen, F. (2019). Behavioural development in southern right whale calves. Marine Ecology Progress Series629, 219–234. https://doi.org/10.3354/meps13125

Pereira, Talmo D., Nathaniel Tabris, Junyu Li, Shruthi Ravindranath, Eleni S. Papadoyannis, Z. Yan Wang, David M. Turner, et al. “SLEAP: Multi-Animal Pose Tracking.” Preprint. Animal Behavior and Cognition, September 2, 2020. https://doi.org/10.1101/2020.08.31.276246.

Torres, Nieukirk, S. L., Lemos, L., & Chandler, T. E. (2018). Drone Up! Quantifying Whale Behavior From a New Perspective Improves Observational Capacity. Frontiers in Marine Science, 5. https://doi.org/10.3389/fmars.2018.00319

Supporting marine life conservation as an outsider: Blue whales and earthquakes

By Mateo Estrada Jorge, Oregon State University undergraduate student, GEMM Lab REU Intern

Introduction

My name is Mateo Estrada and this past summer I had the pleasure of working with Dawn Barlow and Dr. Leigh Torres as a National Science Foundation (NSF) Research Experience for Undergraduates (REU) intern. I had the chance to proactively learn about the scientific method in the marine sciences by studying the acoustic behaviors of pygmy blue whales (Balaenoptera musculus brevicauda) that are documented residents of the South Taranaki Bight region in New Zealand (Torres 2013, Barlow et al. 2018). I’ve been interested in conducting scientific research since I began my undergraduate education at Oregon State University in 2015. Having the opportunity to apply the skills I gained through my education in this REU has been a blessing. I’m a physics and computer science major, but more than anything I’m a scientist and my passion has taken me in new, unexpected directions that I’m going to share in this blog post. My message for any students who feel like they haven’t found their path yet is: hang in there, sometimes it takes time for things to take shape. That has been my experience and I’m sure it’s been the experience of many people interested in the sciences. I’m a Physics and Computer Science student, so why am I studying blue whales, and more specifically, how can I be doing marine science research having only taken intro to biology 101?

My background

I decided to apply for the REU in the Spring 2021 because it was a chance to use my programming skills in the marine sciences. I’m also passionate about conservation and protecting the environment in a pragmatic way, so I decided to find a niche where I could put my technical skills to good use. Finally, I wanted to explore a scientific field outside of my area of expertise to grow as a student and to learn from other researchers. I was mostly inspired by anecdotal tales of Physicist Richard Feynman who would venture out of the physics department at Caltech and into other departments to learn about what other scientists were investigating to inspire his own work. This summer, I ventured into the world of marine science, and what I found in my project was fascinating.

Whale watching tour

Figure 1. Me standing on a boat on the Pacific Ocean off Long Beach, CA.

To get into the research mode, I decided to go on a whale watching tour with the Aquarium of the Pacific. The tour was two hours long and the sunburn was worth it because we got to see four blue whales off the Long Beach coast in California. I got to see the famous blue whale blow and their splashes. It was the first time I was on a big boat in the ocean, so naturally I got seasick (Fig 1). But it was exciting to get a chance to see blue whales in action (luckily, I didn’t actually hurl). The marine biologist onboard also gave a quick lecture on the relative size of blue whales and some of their behaviors. She also pointed out that they don’t use Sonar to locate whales as this has been shown to disturb their calling behaviors. Instead, we looked for a blow and splashing. The tour was a wonderful experience and I’m glad I got to see some whales out in nature. This experience also served as a reminder of the beauty of marine life and the responsibility I feel for trying to understand and help conserving it.

Context of blue whale calling

Sound plays a significant role in the marine environment and is a critical mode of communication for many marine animals including baleen whales. Blue whales produce different vocalizations, otherwise known as calls.  Blue whale song is theorized to be produced by males of the species as a form of reproductive behavior, similar to how male peacocks engage females by displaying their elongated upper tail covert feathers in iridescent colors as a courtship mechanism. Then there are “D calls” that are associated with social mechanisms while foraging, and these calls are made by both female and male blue whales (Lewis et al. 2018) (Fig. 2).

Figure 2. Spectrogram of Pygmy blue whale D calls manually (and automatically) selected, frequency 0-150 Hz.

Understanding research on blue whales

The most difficult part about coming into a project as an outsider is catching up. I learned how anthropogenetic (human made) noise affects blue whale communication. For example, it has been showing that Mid Frequency Active Sonar signals employed by the U.S. Navy affect blue whale D calling patterns (Melcón 2012). Furthermore, noise from seismic airguns used for oil and gas exploration has also impact blue whale calling behavior (Di Lorio, 2010). Understanding the environmental context in which the pygmy blue whales live and the anthropogenic pressures they face is essential in marine conservation. Protecting the areas in which they live is important so they can feed, reproduce and thrive effectively. What began as a slowly falling snowflake at the start of a snowstorm turned into a cascading avalanche of knowledge pouring into my mind in just two weeks.

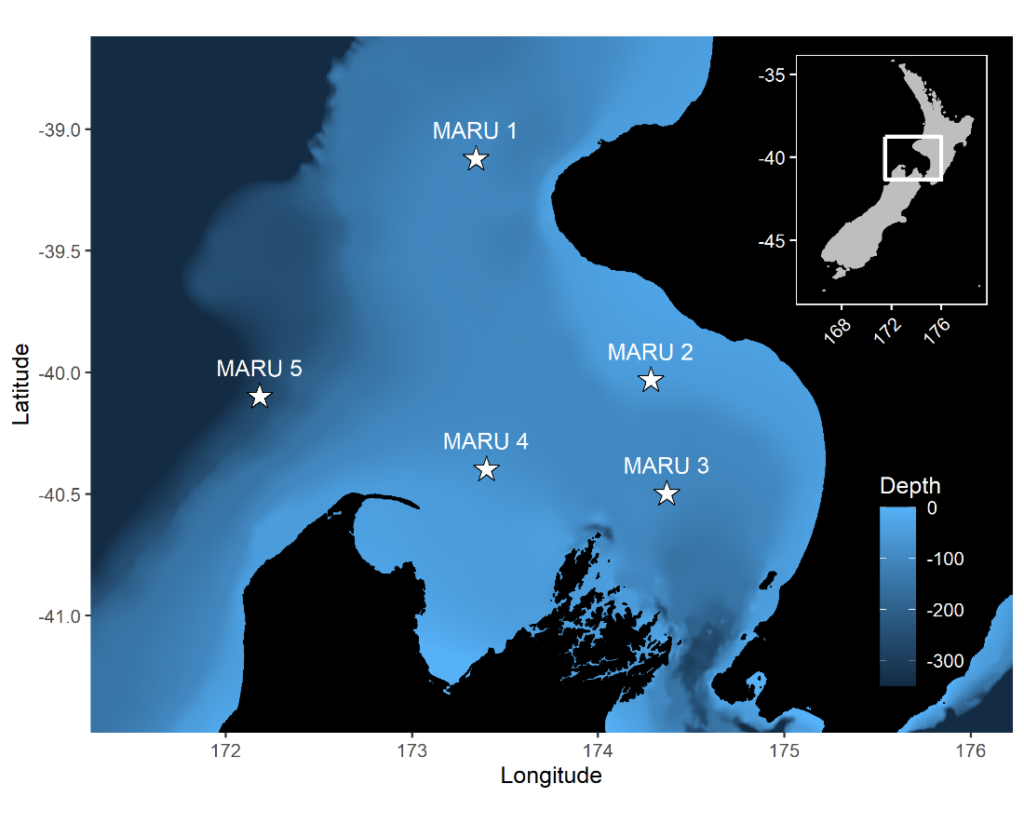
Figure 3. The white stars show the hydrophone locations (n = 5). A bathymetric scale of the depth is also given.

The research question I set out to tackle in my internship was: do blue whales change their calling behavior in response to natural noise events from earthquake activity? To do this, I used acoustic recordings from five hydrophones deployed in the South Taranaki Bight (Fig. 3), paired with an existing dataset of all recorded earthquakes in New Zealand (GeoNet). I identified known earthquakes in our acoustic recordings, and then examined the blue whale D calls during 4 hours before and after each earthquake event to look for any change in the number of calls, call energy, entropy, or bandwidth.

A great mentor and lab team

The days kept passing and blending into each other, as they often do with remote work. I began to feel isolated from the people I was working with and the blue whales I was studying. The zoom calls, group chats, and working alongside other remote interns kept me afloat as I adapted to a work world fully online. Nevertheless, I was happy to continue working on this project because I felt like I was slowly becoming part of the GEMM Lab. I would meet with my mentor Dawn Barlow at least once a week and we would spend time talking about the project and sorting out the difficult details of data processing. She always encouraged my curiosity to ask questions. Even if they were silly questions, she was happy to ponder them because she is a curious scientist like myself.

What we learned

Pygmy blue whales from the South Taranaki Bight region do not change their acoustic behavior in response to earthquake activity. The energy of the earthquake, magnitude, depth, and distance to the origin all had no influence on the number of blue whale D calls, the energy of their calling, the entropy, and the bandwidth. A likely reason for why the blue whales would have no acoustic response to earthquakes (magnitude < 5) is that the STB region is a seismically active region due to the nearby interface of the Australian and Pacific plates. Because of the plate tectonics, the region averages about 20,000 recorded earthquakes per year (GeoNet: Earthquake Statistics). Given that pygmy blue whales are present in the STB region year-round (Barlow et al. 2018), the blue whales may have adapted to tolerate the earthquake activity (Fig 4).

Figure 4. Earthquake signal from MARU (1, 2, 3, 4, 5) and blue whale D calls, Frequency 0-150 Hz.

Looking at the future

I presented my work at the end of my REU internship program, which was a difficult challenge for me because I am often intimidated by public speaking (who isn’t?). Communicating science has always been a big interest of me. I love reading news articles about new breakthroughs and being a small part of that is a huge privilege for me. Finding my own voice and having new insights to contribute to the scientific world has always been my main objective. Now I will get to deliver a poster presentation of my REU work at the Association for the Sciences of Limnology and Oceanography (ASLO) Conference in March 2022. I am both excited and nervous to take on this new adventure of meeting seasoned professionals, communicating my results, and learning about the ocean sciences. I hope to gain new inspirations for my future academic and professional work.

References:

About Earthquake Drums – GeoNet. geonet.Org. Retrieved June 23, 2021, from https://www.geonet.org.nz/about/earthquake/drums

Barlow, D. R., Torres, L. G., Hodge, K. B., Steel, D., Scott Baker, C., Chandler, T. E., Bott, N., Constantine, R., Double, M. C., Gill, P., Glasgow, D., Hamner, R. M., Lilley, C., Ogle, M., Olson, P. A., Peters, C., Stockin, K. A., Tessaglia-Hymes, C. T., & Klinck, H. (2018). Documentation of a New Zealand blue whale population based on multiple lines of evidence. Endangered Species Research, 36, 27–40. https://doi.org/10.3354/esr00891

Di Iorio, L., & Clark, C. W. (2010). Exposure to seismic survey alters blue whale acoustic communication. Biology Letters, 6(3), 334–335. https://doi.org/10.1098/rsbl.2009.0967

Lewis, L. A., Calambokidis, J., Stimpert, A. K., Fahlbusch, J., Friedlaender, A. S., McKenna, M. F., Mesnick, S. L., Oleson, E. M., Southall, B. L., Szesciorka, A. R., & Sirović, A. (2018). Context-dependent variability in blue whale acoustic behaviour. Royal Society Open Science, 5(8). https://doi.org/10.1098/rsos.180241

Melcón, M. L., Cummins, A. J., Kerosky, S. M., Roche, L. K., Wiggins, S. M., & Hildebrand, J. A. (2012). Blue whales respond to anthropogenic noise. PLoS ONE, 7(2), 1–6. https://doi.org/10.1371/journal.pone.0032681

Torres LG. 2013 Evidence for an unrecognised blue whale foraging ground in New Zealand. NZ J. Mar. Freshwater Res. 47, 235–248. (doi:10. 1080/00288330.2013.773919)

Whales are amazing, and also provide amazing benefits to our oceans and human society

By Alejandro Fernandez Ajo, PhD student at the Department of Biology, Northern Arizona University, Visiting scientist in the GEMM Lab working on the gray whale physiology and ecology project  

Whales are among the most amazing and enigmatic animals in the world. Whales are not only fascinating, they are also biologically special. Due to their key ecological role and unique biological traits (i.e., their large body size, long lifespans, and sizable home ranges), whales are extremely important in helping sustain the entire marine ecosystem.

Working towards the conservation of marine megafauna, and large charismatic animals in general, is often seen as a mere benevolent effort that conservationist groups, individuals, and governments do on behalf of the individual species. However, mounting evidence demonstrates that restoring populations of marine megafauna, including large whales, can help buffer marine ecosystems from destabilizing stresses like human driven CO2 emissions and global change due to their ability to sequester carbon in their bodies (Pershing et al. 2010). Furthermore, whales can enhance primary production in the ocean through their high consumption and defecation rates, which ultimately provides nutrients to the ecosystem and improves fishery yields (Roman-McCarthy, 2010; Morissette et al. 2012).

Relationships between humans and whales have a long history, however, these relationships have changed. For centuries, whales were valued in terms of the number of oil barrels they could yield, and the quality of their baleen and meat. In the North Atlantic, whaling started as early as 1000 AD with “shore whaling” of North Atlantic right whales by Basque whalers. This whaling was initially limited to the mother and calve pairs that were easy to target due to their coastal habits and the fact that calves are more vulnerable and slower (Reeves-Smith, 2006). Once the calving populations of near-shore waters off Europe were depleted, offshore whaling began developing. Whalers of multiple nations (including USA, British, French, Norwegian, Portuguese, and Dutch, among others), targeted whales around the world, mainly impacting the gray whale populations, and all three right whale species along with the related bowhead whale. Later, throughout the phase of modern whaling using industrialized methods, the main target species consisted of the blue, fin, humpback, minke, sei and sperm whale (Schneider- Pearce, 2004).

By the early twentieth century, many of the world´s whale populations where reduced to a small fraction of their historical numbers, and although pre-whaling abundance of whale stocks is a subject of debate, recent studies estimate that at least the 66%, and perhaps as high as 90% for some whale species and populations (Branch-Williams 2006; Christensen, 2006), where taken during this period. This systematic and serial depletion of whale papulations reduced the biomass and abundance of great whales around the world, which has likely altered the structure and function of the oceans (Balance et al. 2006; Roman et al. 2014; Croll, et al. 2006).

After centuries of unregulated whale hunting, commercial whaling was banned in the mid-twentieth century. This ban was the result of multiple factors including reduced whale stocks below the point where commercial whaling would be profitable, and a fortunate shift in public perception of whales and the emergence of conservation initiatives (Schneider- Pearce, 2004). Since this moratorium on whaling, several whale populations have recovered around the world, and some populations that were listed as endangered have been delisted (i.e., the Eastern North Pacific gray whale) and some populations are estimated to have re-bounced to their pre-whaling abundance.

Although, the recovery of some populations has motivate some communities or nations to obtain or extend their whaling quotas (see Blog Post by Lisa Hildebrand), it is important to acknowledge that the management of whale populations is arguably one of the most complicated tasks, and is distinguished from management of normal fisheries due to various biological aspects. Whales are long living mammals with slow reproduction rates, and on average a whale can only produce a calf every two or three years. Hence, the gross addition to the stock rarely would exceed 25% of the number of adults (Schneider- Pearce, 2004), which is a much lower recovery rate that any fish stock. Also, whales usually reach their age of sexual maturity at 6-10 years old, and for many species there are several uncertainties about their biology and natural history that make estimations of population abundance and growth rate even harder to estimate.

Fig 1: Human relationship with whales has changed through history. Once valued for their meat and oil, now they are a natural attraction that amaze and attract crowds to whale watching destinations all over the globe. Photo: Stephen Johnson, Península Valdés-Argentina.

Moreover, while today´s whales are generally not killed directly by hunting, they are exposed to a variety of other increasing human stressors (e.g., entanglement in fishing gear, vessel strikes, shipping noise, and climate change). Thus, scientists must develop novel tools to overcome the challenges of studying whales and distinguish the relative importance of the different impacts to help guide conservation actions that improve the recovery and restoration of whale stocks (Hunt et al. in press). With the restoration of great whale populations, we can expect positive changes in the structure and function of the world’s oceans (Chami et al. 2019; Roman et al. 2010).

So, why it is worth keeping whales healthy?

Whales facilitate the transfer of nutrients by (1) releasing nutrient-rich fecal plumes near the surface after they have feed at depth and (2) by moving nutrients from highly productive, polar and subpolar latitude feeding areas to the low latitude calving areas (Roman et al. 2010). In this way, whales help increase the productivity of phytoplankton that in turn support zooplankton production, and thus have a bottom up effect on the productivity of many species including fish, birds, and marine mammals, including whales. These fertilization events can also facilitate mitigation of the negative impacts of climate change. The amount of iron contained in the whales’ feces can be 10 million times greater than the level of iron in the marine environment, triggering important phytoplankton blooms, which in turn sequester thousands of tons of carbon from, and release oxygen to, the atmosphere annually (Roman et al. 2016; Smith et al. 2013; Willis, 2007). Furthermore, when whales die, their massive bodies fall to the seafloor, making them the largest and most nutritious source of food waste, which is capable of sustaining a succession of macro-fauna assemblages for several decades, including some invertebrate species that are endemic to whale carcasses (Smith et al. 2015).

Figure 2. The figure shows a conceptual model of the “whale pump”. From Roman-McCarthy, 2010.

Despite the several environmental services that whales provide, and the positive impact on local economies that depend on whale watching tourism, which has been valued in millions of dollars per year (Hoyt E., 2001), the return of whales and other marine mammals has often been implicated in declines in fish populations, resulting in conflicts with human fisheries (Lavigne, D.M. 2003). Yet there is insufficient direct evidence for such competition (Morissette et al. 2010). Indeed, there is evidence of the contrary: In ecosystem models where whale abundances are reduced, fish stocks show significant decreases, and in some cases the presence of whales in these models result in improved fishery yields. Consistent with these findings, several models have shown that alterations in marine ecosystems resulting from the removal of whales and other marine mammals do not lead to increases in human fishery yields (Morissette et al. 2010; 2012). Although the environmental services and benefits provided by great whales, which potentially includes the enhancement of fisheries yields, and enhancement on ocean oxygen production and capturing carbon, are evident and make a strong argument for improved whale conservation, it is overwhelming how little we know about many aspects of their lives, their biology, and particularly their physiology.

Figure 3: Whales are the most fascinating animals in the world, but they are not only amazing animals. They are also extremely important in sustaining the entire marine ecosystem. Photo: Alejandro Fernández Ajó -Instituto de Conservación de ballenas.

This lack of knowledge is because whales are really hard to study. For many years research was limited to the observation of the brief surfacing of the whales, yet most of their lives occurs beneath the surface and were completely unknown. Fortunately, new technologies and the creativity of whale researchers are helping us to better understand many aspects of their lives that were cryptic to us even a decade ago. I am committed to filling some of these knowledge gaps. My research examines how different environmental and anthropogenic impacts affect whale health, and particularly how these impacts may relate to cases of large whale mortalities and declines in whale populations. I am applying novel methods in conservation physiology for measuring hormone levels that promise to improve our understanding of the relationship between different (extrinsic and intrinsic) stressors and the physiological response of whales. Ultimately, this research will help address important conservation questions, such as the causes of unusual whale mortality events and declines in whale populations.

References:

Ballance LT, Pitman RL, Hewitt R, et al. 2006. The removal of large whales from the Southern Ocean: evidence for long-term ecosystem effects. In: Estes JA, DeMaster DP, Doak DF, et al. (Eds). Whales, whaling and ocean ecosystems. Berkeley, CA: University of California Press.

Branch TA and Williams TM. 2006. Legacy of industrial whaling. In: Estes JA, DeMaster DP, Doak DF, et al. (Eds). Whales, whaling and ocean ecosystems. Berkeley, CA: University of California Press.

Chami, R. Cosimano, T. Fullenkamp, C. & Oztosun, S. (2019). Nature’s solution to climate change. Finance & Development, 56(4).

Christensen LB. 2006. Marine mammal populations: reconstructing historical abundances at the global scale. Vancouver, Canada: University of British Columbia.

Croll DA, Kudela R, Tershy BR (2006) Ecosystem impact of the decline of large whales in the North Pacific. In: Estes JA, DeMaster DP, Doak DF, Williams TM, BrownellJr RL, editors. Whales, Whaling, and Ocean Ecosystems. Berkeley: University of California Press. pp. 202–214.

Hoyt, E. 2001. Whale Watching 2001: Worldwide Tourism Numbers, Expenditures and Expanding Socioeconomic Benefits

Hunt, K.E., Fernández Ajó, A. Lowe, C. Burgess, E.A. Buck, C.L. In press. A tale of two whales: putting physiological tools to work for North Atlantic and southern right whales. In: “Conservation Physiology: Integrating Physiology Into Animal Conservation And Management”, ch. 12. Eds. Madliger CL, Franklin CE, Love OP, Cooke SJ. Oxford University press: Oxford, UK.

Lavigne, D.M. 2003. Marine mammals and fisheries: the role of science in the culling debate. In: Gales N, Hindell M, and Kirkwood R (Eds). Marine mammals: fisheries, tourism, and management issues. Melbourne, Australia: CSIRO.

Morissette L, Christensen V, and Pauly D. 2012. Marine mammal impacts in exploited ecosystems: would large scale culling benefit fisheries? PLoS ONE 7: e43966.

Morissette L, Kaschner K, and Gerber LR. 2010. “Whales eat fish”? Demystifying the myth in the Caribbean marine ecosystem. Fish Fish 11: 388–404.

Pershing AJ, Christensen LB, Record NR, Sherwood GD, Stetson PB (2010) The impact of whaling on the ocean carbon cycle: Why bigger was better. PLoS ONE 5(8): e12444.

Reeves, R. and Smith, T. (2006). A taxonomy of world whaling. In DeMaster, D. P., Doak, D. F., Williams, T. M., and Brownell Jr., R. L., eds. Whales, Whaling, and Ocean Ecosystems. University of California Press, Berkeley, CA.

Roman, J. Altman I, Dunphy-Daly MM, et al. 2013. The Marine Mammal Protection Act at 40: status, recovery, and future of US marine mammals. Ann NY Acad Sci; doi:10.1111/nyas.12040.

Roman, J. and McCarthy, J.J. 2010. The whale pump: marine mammals enhance primary productivity in a coastal basin. PLoS ONE. 5(10): e13255.

Roman, J. Estes, J.A. Morissette, L. Smith, C. Costa, D. McCarthy, J. Nation, J.B. Nicol, S. Pershing, A.and Smetacek, V. 2014. Whales as marine ecosystem engineers. Frontiers in Ecology and the Environment. 12(7). 377-385.

Roman, J. Nevins, J. Altabet, M. Koopman, H. and McCarthy, J. 2016. Endangered right whales enhance primary productivity in the Bay of Fundy. PLoS ONE. 11(6): e0156553.

Schneider, V. Pearce, D. What saved the whales? An economic analysis of 20th century whaling. Biodiversity and Conservation 13, 543–562 (2004). https://doi org.libproxy.nau.edu/10.1023/B:BIOC.0000009489.08502.1

Smith LV, McMinn A, Martin A, et al. 2013. Preliminary investigation into the stimulation of phyto- plankton photophysiology and growth by whale faeces. J Exp Mar Biol Ecol 446: 1–9.

Smith, C.R. Glover, A.G. Treude, T. Higgs, N.D. and Amon, D.J. 2015. Whale-fall ecosystems: Recent insights into ecology, paleoecology, and evolution. Annu. Rev. Marine. Sci. 7:571-596.

Willis, J. 2007. Could whales have maintained a high abundance of krill? Evol Ecol Res 9: 651–662.

Applying novel methods in conservation physiology to understand cases of large whale mortalities

By Alejandro Fernánez Ajó, PhD student at NAU and GEMM Lab research technician

Although commercial whaling is currently banned and several whale populations show evidence of recovery, today´s whales are exposed to a variety of other human stressors (e.g., entanglement in fishing gear, vessel strikes, shipping noise, climate change, etc.; reviewed in Hunt et al., 2017a). The recovery and conservation of large whale populations is particularly important to the oceanic environment due to their key ecological role and unique biological traits, including their large body size, long lifespan and sizable home ranges (Magera et al., 2013; Atkinson et al., 2015; Thomas and Reeves, 2015). Thus, scientists must develop novel tools to overcome the challenges of studying whale physiology in order to distinguish the relative importance of the different impacts and guide conservation actions accordingly (Ayres et al., 2012; Hunt et al., 2013).

To this end, baleen hormone analysis represents a powerful tool for retrospective assessment of patterns in whale physiology (Hunt et al., 2014, 2016, 2017a, 2017b, 2018; Lysiak et. al., 2018; Fernández Ajó et al., 2018; Rolland et al., 2019). Moreover, hormonal panels, which include multiple hormones, are helping to better clarify and distinguish between the physiological effects of different sources of anthropogenic and environmental stressors (Ayres et al., 2012; Wasser et al., 2017; Lysiak et al., 2018; Romero et al., 2015).

What is Baleen? Baleen is a stratified epithelial tissue consisting of long, fringed plates that grow downward from the upper jaw, which collectively form the whale´s filter-feeding apparatus (Figure 1). This tissue accumulates hormones as it grows. Hormones are deposited in a linear fashion with time so that a single plate of baleen allows retrospective assessment and evaluation of a whales’ physiological condition, and in calves baleen provides a record of the entire lifespan including part of their gestation. Baleen samples are also readily accessible and routinely collected during necropsy along with other samples and relevant information.

Figure 1: Top: A baleen plate from a southern right whale calf (Source: Fernández Ajó et al. 2018). Bottom: A southern right whale with mouth open exposing its baleen (photo credit: Stephen Johnson).

Why are the Southern Right Whales calves (SRW) dying in Patagonia?

I am a Fulbright Ph.D. student in the Buck Laboratory  at Northern Arizona University since Fall 2017, a researcher with the Whale Conservation Institute of Argentina (Instituto de Conservación de Ballenas) and Field Technician for the GEMM Lab over the summer. I focus my research on the application and development of novel methods in conservation physiology to improve our understanding of how physiological parameters are affected by human pressures that impact large whales and marine mammals. I am especially interested in understanding the underlaying causes of large whale mortalities with the aim of preventing their occurrence when possible. In particular, for my Ph.D. dissertation, I am studying a die-off case of Southern Right Whale (SRW) calves, Eubalaena australis, off Peninsula Valdés (PV) in Patagonia-Argentina (Figure 2).

Prior to 2000, annual calf mortality at PV was considered normal and tracked the population growth rate (Rowntree et al., 2013). However, between 2007 and 2013, 558 whales died, including 513 newborn calves (Sironi et al., 2018). Average total whale deaths per year increased tenfold, from 8.2 in 1993-2002 to 80 in 2007-2013. These mortality levels have never before been observed for the species or any other population of whales (Thomas et al., 2013, Sironi et al., 2018).


Figure 2: Study area, the red dots along the shoreline indicate the location where the whales were found stranded at Península Valdés in 2018 (Source: The Right Whale Program Research Report 2018, Sironi and Rowntree, 2018)

Among several hypotheses proposed to explain these elevated calf mortalities, harassment by Kelp Gulls, Larus dominicanus, on young calves stands out as a plausible cause and is a unique problem only seen at the PV calving ground. Kelp gull parasitism on SRWs near PV was first observed in the 1970’s (Thomas, 1988). Gulls primarily harass mother-calf pairs, and this parasitic behavior includes pecking on the backs of the whales and creating open wounds to feed on their skin and blubber. The current intensity of gull harassment has been identified as a significant environmental stressor to whales and potential contributor to calf deaths (Marón et al., 2015b; Fernández Ajó et al., 2018).

Figure 3: The significant preference for calves as a target of gull attacks highlights the impact of this parasitic behavior on this age class. The situation continues to be worrisome and serious for the health and well-being of newborn calves at Península Valdés. Left: A Kelp Gull landing on whale´s back to feed on her skin and blubber (Photo credit: Lisandro Crespo). Right: A calf with multiple lesions on its back produced by repeated gull attacks (Photo credit: ICB).

Quantifying gull inflicted wounds

Photographs of gull wounds on whales taken during necropsies and were quantified and assigned to one of seven objectively defined size categories (Fig. 4): extra-small (XS), small (S), medium (M), large (L), extra-large (XL), double XL (XXL) and triple XL (XXXL). The size and number of lesions on each whale were compared to baleen hormones to determine the effect of the of the attacks on the whales health.

Figure 4. Kelp gull lesion scoring. Source: Maron et al. 2015).

How baleen hormones are applied

Impact factors such as injuries, predation avoidance, storms, and starvation promote an increase in the secretion of the glucocorticoids (GCs) cortisol and corticosterone (stress hormones), which then induce a variety of physiological and behavioral responses that help animals cope with the stressor. Prolonged exposure to chronic stress, however, may exceed the animal’s ability to cope with such stimuli and, therefore, adversely affects its body condition, its health, and even its survival. Triiodothyronine (T3), is the most biologically active form of the thyroid hormones and helps regulate metabolism. Sustained food deprivation causes a decrease in T3 concentrations, slowing metabolism to conserve energy stores. Combining GCs and T3 hormone measures allowed us to investigate and distinguish the relative impacts of nutritional and other sources of stressors.

Combining these novel methods produced unique results about whale physiology. With my research, we are finding that the GCs concentrations measured in calves´ baleen positively correlate with the intensity of gull wounding (Figure 4, 1 and 2), while calf’s baleen thyroid hormone concentrations are relative stable across time and do not correlate with intensity of gull wounding (Figure 4 – 3). Taken together these findings indicate that SRW calves exposed to Kelp gull parasitism and harassment experience high levels of physiological stress that compromise their health and survival. Ultimately these results will inform government officials and managers to direct conservation actions aimed to reduce the negative interaction between Kelp gulls and Southern Right Whales in Patagonia.

Figure 4: Physiological stress correlates with number of gull lesions (1 and 2). According to the best-fit linear model, immunoreactive baleen corticosterone (B) and cortisol (F) concentrations increased with wound severity (i.e. number of gull lesions). However, nutritional status indexed by baleen immunoreactive triiodothyronine (T3) concentrations does not correlate with the number of gull lesions (3). (Fernández Ajó et al. 2019, manuscript under revision)

Baleen hormones as a conservation tool

Baleen hormones represent a powerful tool for retrospective assessments of longitudinal trends in whale physiology by helping discriminate the underlying mechanisms by which different stressors may affect a whale’s health and physiology. Moreover, while most sample types used for studying whale physiology provide single time-point measures of current circulating hormone levels (e.g., skin or respiratory vapor), or information from previous few hours or days (e.g., urine and feces), baleen tissue provides a unique opportunity for longitudinal analyses of hormone patterns. These retrospective analyses can be conducted for both stranded or archived specimens, and can be conducted jointly with other biological markers (e.g., stable isotopes and biotoxins) to describe migration patterns and exposure to pollutants. Further research efforts on baleen hormones should focus on completing biological validations to better understand the hormone measurements in baleen and its correlation with measurements from alternative sample matrices (i.e., feces, skin, blubber, and respiratory vapors).

References:

Atkinson, S., Crocker, D., Houser, D., Mashburn, K., 2015. Stress physiology in marine mammals: how well do they fit the terrestrial model? J. Comp. Physiol. B. 185, 463–486. https://doi.org/10.1007/s00360-015-0901-0.

Ayres, K.L., Booth, R.K., Hempelmann, J.A., Koski, K.L., Emmons, C.K., Baird, R.W., Balcomb-Bartok, K., Hanson, M.B., Ford, M.J., Wasser, S.K., 2012. Distinguishing the impacts of inadequate prey and vessel traffic on an endangered killer whale (Orcinus orca) population. PLoS ONE. 7, e36842. https://doi.org/10.1371/journal.pone.0036842.

Fernández Ajó, A.A., Hunt, K., Uhart, M., Rowntree, V., Sironi, M., Marón, C.F., Di Martino, M., Buck, L., 2018. Lifetime glucocorticoid profiles in baleen of right whale calves: potential relationships to chronic stress of repeated wounding by Kelp Gull. Conserv. Physiol. 6, coy045. https://doi.org/10.1093/conphys/coy045.

Hunt, K., Lysiak, N., Moore, M., Rolland, R.M., 2017a. Multi-year longitudinal profiles of cortisol and corticosterone recovered from baleen of North Atlantic right whales (Eubalaena glacialis). Gen. Comp. Endocrinol. 254: 50–59. https://doi.org/10.1016/j.ygcen.2017.09.009.

Hunt, K.E., Hunt, K.E., Lysiak, N.S., Matthews, C.J.D., Lowe, C., Fernández-Ajo, A., Dillon, D., Willing, C., Heide-Jørgensen, M.P., Ferguson, S.H., Moore, M.J., Buck, C.L., 2018. Multi-year patterns in testosterone, cortisol and corticosterone in baleen from adult males of three whale species. Conserv. Physiol. 6, coy049. https://doi.org/10.1093/conphys/coy049.

Hunt, K.E., Hunt, K.E., Lysiak, N.S., Moore, M.J., Rolland R.M., 2016. Longitudinal progesterone profiles in baleen from female North Atlantic right whales (Eubalaena glacialis) match known calving history. Conserv. Physiol. 4, cow014. https://doi.org/10.1093/conphys/cow014.

Hunt, K.E., Lysiak, N.S., Moore, M.J., Seton, R.E., Torres, L., Buck, C.L., 2017b. Multiple steroid and thyroid hormones detected in baleen from eight whale species. Conserv. Physiol. 5, cox061. https://doi.org/10.1093/conphys/cox061.

Hunt, K.E., Moore, M.J., Rolland, R.M., Kellar, N.M., Hall, A.J., Kershaw, J., Raverty, S.A., Davis, C.E., Yeates, L.C., Fauquier, D.A., Rowles, T.K., Kraus, S.D., 2013. Overcoming the challenges of studying conservation physiology in large whales: a review of available methods. Conserv. Physiol. 1: cot006. https://doi.org/10.1093/conphys/cot006.

Hunt, K.E., Stimmelmayr, R., George, C., Hanns, C., Suydam, R., Brower, H., Rolland, R.M., 2014. Baleen hormones: a novel tool for retrospective assessment of stress and reproduction in bowhead whales (Balaena mysticetus). Conserv. Physiol. 2, cou030. doi: https://doi.org/10.1093/conphys/cou030.

Lysiak, N., Trumble, S., Knowlton, A., Moore, M., 2018. Characterizing the duration and severity of fishing gear entanglement on a North Atlantic right whale (Eubalaena glacialis) using stable isotopes, steroid and thyroid hormones in baleen. Front. Mar. Sci. 5: 168. https://doi.org/10.3389/fmars.2018.00168.

Magera, A.M., Flemming, J.E.M., Kaschner, K., Christensen, L.B., Lotze, H.K., 2013. Recovery trends in marine mammal populations. PLoS ONE. 8, e77908. https://doi.org/10.1371/journal.pone.0077908.

Marón, C.F., Beltramino, L., Di Martino, M., Chirife, A., Seger, J., Uhart, M., Sironi, M., Rowntree, V.J., 2015b Increased wounding of southern right whale (Eubalaena australis) calves by Kelp Gulls (Larus dominicanus) at Península Valdés, Argentina., PLoS ONE. 10, p. e0139291. https://doi.org/10.1371/journal.pone.0139291.

Marón, C.F., Rowntree, V.J., Sironi, M., Uhart, M., Payne, R.S., Adler, F.R., Seger, J., 2015a. Estimating population consequences of increased calf mortality in the southern right whales off Argentina. SC/66a/BRG/1 presented to the IWC Scientific Committee, San Diego, USA. Available at: https://iwc.int/home

Rolland, R.M., Graham, K.M., Stimmelmayr, R., Suydam, R. S., George, J.C., 2019. Chronic stress from fishing gear entanglement is recorded in baleen from a bowhead whale (Balaena mysticetus). Mar. Mam. Sci. https://doi.org/10.1111/mms.12596.

Romero, L.M., Platts, S.H., Schoech, S.J., Wada, H., Crespi, E., Martin, L.B., Buck, C.L., 2015. Understanding Stress in the Healthy Animal – Potential Paths for Progress. Stress. 18(5), 491-497.

Rowntree, V.J., Uhart, M.M., Sironi, M., Chirife, A., Di Martino, M., La Sala, L., Musmeci, L., Mohamed, N., Andrejuk, J., McAloose, D., Sala, J., Carribero, A., Rally, H., Franco, M., Adler, F., Brownell, R. Jr, Seger, J., Rowles, T., 2013. Unexplained recurring high mortality of southern right whale Eubalaena australis calves at Península Valdés, Argentina. Mar. Ecol. Prog. Ser. 493:275–289. https://doi.org/10.3354/meps10506.

Sironi, M. Rowntree, V., Di Martino, M., Alzugaray, L.,Rago, V., Marón, C.F., Uhart M., 2018. Southern right whale mortalities at Península Valdes, Argentina: updated information for 2016-2017. SC/67B/CMP/06 presented to the IWC Scientific Committee, Slovenia. Available at: https://iwc.int/home.

Sironi, M. Rowntree, V., Snowdon, C., Valenzuela, L., Marón C., 2009. Kelp Gulls (Larus dominicanus) feeding on southern right whales (Eubalaena australis) at Península Valdes, Argentina: updated estimates and conservation implications. SC/61/BRG19. presented to the IWC Scientific Committee, Portugal. Available at: https://iwc.int/home.

Thomas, P., Reeves, R., 2015. Status of the world’s baleen whales. Mar. Mam. Sci. 32:682–734. https://doi.org/10.1111/mms.12281.

Thomas, P., Uhart, M., McAloose, D., Sironi, M., Rowntree, V.J., Brownell, Jr. R., Gulland, F.M.D., Moore, M., Marón, C., Wilson, C., 2013. Workshop on the southern right whale die-off at Península Valdés, Argentina. SC/60/BRG15 presented to the IWC Scientific Committee, South Korea. Available at: https://iwc.int/home

Thomas, P.O. 1988. Kelp Gulls, Larus dominicanus, are parasites on flesh of the right whale, Eubalaena australis. Ethology. 79:89-103. https://doi.org/10.1111/j.1439-0310.1988.tb00703.x.

Wasser, S.K., Lundin, J.I., Ayres, K., Seely, E., Giles, D., Balcomb, K., Hempelmann, J., Parsons, K., Booth, R., 2017. Population growth is limited by nutritional impacts on pregnancy success in endangered Southern Resident killer whales (Orcinus orca). PLoS ONE. 12, e0179824. https://doi.org/10.1371/journal.pone.0179824.

Eyes from Space: Using Remote Sensing as a Tool to Study the Ecology of Blue Whales

By Christina Garvey, University of Maryland, GEMM Lab REU Intern

It is July 8th and it is my 4th week here in Hatfield as an REU intern for Dr. Leigh Torres. My name is Christina Garvey and this summer I am studying the spatial ecology of blue whales in the South Taranaki Bight, New Zealand. Coming from the east coast, Oregon has given me an experience of a lifetime – the rugged shorelines continue to take my breath away and watching sea lions in Yaquina Bay never gets old. However, working on my first research project has by far been the greatest opportunity and I have learned so much in so little time. When Dr. Torres asked me to contribute to this blog I was unsure of how I would write about my work thus far but I am excited to have the opportunity to share the knowledge I have gained with whoever reads this blog post.

The research project that I will be conducting this summer will use remotely sensed environmental data (information collected from satellites) to predict blue whale distribution in the South Taranaki Bight (STB), New Zealand. Those that have read previous blogs about this research may remember that the STB study area is created by a large indentation or “bight” on the southern end of the Northern Island. Based on multiple lines of evidence, Dr. Leigh Torres hypothesized the presence of an unrecognized blue whale foraging ground in the STB (Torres 2013). Dr. Torres and her team have since proved that blue whales frequent this region year-round; however, the STB is also very industrial making this space-use overlap a conservation concern (Barlow et al. 2018). The increasing presence of marine industrial activity in the STB is expected to put more pressure on blue whales in this region, whom are already vulnerable from the effects of past commercial whaling (Barlow et al. 2018) If you want to read more about blue whales in the STB check out previous blog posts that talk all about it!

Figure 1. A blue whale surfaces in front of a floating production storage and offloading vessel servicing the oil rigs in the South Taranaki Bight. Photo by D. Barlow.

Figure 2. South Taranaki Bight, New Zealand, our study site outlined by the red box. Kahurangi Point (black star) is the site of wind-driven upwelling system.

The possibility of the STB as an important foraging ground for a resident population of blue whales poses management concerns as New Zealand will have to balance industrial growth with the protection and conservation of a critically endangered species. As a result of strong public support, there are political plans to implement a marine protected area (MPA) in the STB for the blue whales. The purpose of our research is to provide scientific knowledge and recommendations that will assist the New Zealand government in the creation of an effective MPA.

In order to create an MPA that would help conserve the blue whale population in the STB, we need to gather a deeper understanding of the relationship between blue whales and this marine environment. One way to gain knowledge of the oceanographic and ecological processes of the ocean is through remote sensing by satellites, which provides accessible and easy to use environmental data. In our study we propose remote sensing as a tool that can be used by managers for the design of MPAs (through spatial and temporal boundaries). Satellite imagery can provide information on sea surface temperature (SST), SST anomaly, as well as net primary productivity (NPP) – which are all measurements that can help describe oceanographic upwelling, a phenomena that is believed to be correlated to the presence of blue whales in the STB region.

Figure 3. The stars of the show: blue whales. A photograph captured from the small boat of one animal fluking up to dive down as another whale surfaces close by. (Photo credit: L. Torres)

Past studies in the STB showed evidence of a large upwelling event that occurs off the coast of Kahurangi Point (Fig. 2), on the northwest tip of the South Island (Shirtcliffe et al. 1990). In order to study the relationship of this upwelling to the distribution of blue whales, I plan to extract remotely sensed data (SST, SST anomaly, & NPP) off the coast of Kahurangi and compare it to data gathered from a centrally located site within the STB, which is close to oil rigs and so is of management interest. I will first study how decreases in sea surface temperature at the site of upwelling (Kahurangi) are related to changes in sea surface temperature at this central site in the STB, while accounting for any time differences between each occurrence. I expect that this relationship will be influenced by the wind patterns, and that there will be changes based on the season. I also predict that drops in temperature will be strongly related to increases in primary productivity, since upwelling brings nutrients important for photosynthesis up to the surface. These dips in SST are also expected to be correlated to blue whale occurrence within the bight, since blue whale prey (krill) eat the phytoplankton produced by the productivity.

Figure 4. A blue whale lunges on an aggregation of krill. UAS piloted by Todd Chandler.

To test the relationships I determine between remotely sensed data at different locations in the STB, I plan to use blue whale observations from marine mammal observers during a seismic survey conducted in 2013, as well as sightings recorded from the 2014, 2016, and 2017 field studies led by Dr. Leigh Torres. By studying the statistical relationships between all of these variables I hope to prove that remote sensing can be used as a tool to study and understand blue whale distribution.

I am very excited about this research, especially because the end goal of creating an MPA really gives me purpose. I feel very lucky to be part of a project that could make a positive impact on the world, if only in just a little corner of New Zealand. In the mean time I’ll be here in Hatfield doing the best I can to help make that happen.

References: 

Barlow DR, Torres LG, Hodge KB, Steel D, Baker CS, Chandler TE, Bott N, Constantine R, Double MC, Gill P, Glasgow D, Hamner RM, Lilley C, Ogle M, Olson PA, Peters C, Stockin KA, Tessaglia-hymes CT, Klinck H (2018) Documentation of a New Zealand blue whale population based on multiple lines of evidence. Endanger Species Res 36:27–40.

Shirtcliffe TGL, Moore MI, Cole AG, Viner AB, Baldwin R, Chapman B (1990) Dynamics of the Cape Farewell upwelling plume, New Zealand. New Zeal J Mar Freshw Res 24:555–568.

Torres LG (2013) Evidence for an unrecognised blue whale foraging ground in New Zealand. New Zeal J Mar Freshw Res 47:235–248.

A Weekend of Inspiration in Marine Science: NWSSMM and Dr. Sylvia Earle!

By Karen Lohman, Masters Student in Wildlife Science, Cetacean Conservation and Genomics Lab, Oregon State University

My name is Karen Lohman, and I’m a first-year student in Dr. Scott Baker’s Cetacean Conservation and Genomics Lab at OSU. Dr. Leigh Torres is serving on my committee and has asked me to contribute to the GEMM lab blog from time to time. For my master’s project, I’ll be applying population genetics and genomics techniques to better understand the degree of population mixing and breeding ground assignment of feeding humpback whales in the eastern North Pacific. In other words, I’ll be trying to determine where the humpback whales off the U.S. West Coast are migrating from, and at what frequency.

Earlier this month I joined the GEMM lab members in attending the Northwest Student Society of Marine Mammalogy Conference in Seattle. The GEMM lab members and I made the trip up to the University of Washington to present our work to our peers from across the Pacific Northwest. All five GEMM lab graduate students, plus GEMM lab intern Acacia Pepper, and myself gave talks presenting our research to our peers. I was able to present preliminary results on the population structure of feeding humpback whales across shared feeding habitat by multiple breeding groups in the eastern North Pacific using mitochondria DNA haplotype frequencies. In the end GEMM lab’s Dawn Barlow took home the “Best Oral Presentation” prize. Way to go Dawn!

A few of the GEMM lab members and me presenting our research at the NWSSMM conference in May 2019 at the University of Washington.

While conferences have a strong networking component, this one feels unique.  It is a chance to network with our peers, who are working through the same challenges in graduate school and will hopefully be our future research collaborators in marine mammal research when we finish our degrees. It’s also one of the few groups of people that understand the challenges of studying marine mammals. Not every day is full of dolphins and rainbows; for me, it’s mostly labwork or writing code to overcome small and/or patchy sample size problems.

All of the CCGL and GEMM Lab members excited to hear Dr. Sylvia Earle’s presentation at Portland State University in May 2019 (from L to R: Karen L., Lisa H., Alexa K., Leila L., Dawn B., and Dom K.) . Photo Source: Alexa Kownacki

On the way back from Seattle we stopped to hear the one and only Dr. Sylvia Earle, talk in Portland. With 27 honorary doctorates and over 200 publications, Dr. Sylvia Earle is a legend in marine science. Hearing a distinguished marine researcher talk about her journey in research and to present such an inspiring message of ocean advocacy was a great way to end our weekend away from normal grad school responsibilities. While the entirety of her talk was moving, one of her final comments really stood out. Near the end of her talk she called the audience to action by saying “Look at your abilities and have confidence that you can and must make a difference. Do whatever you’ve got.” As a first-year graduate student trying to figure out my path forward in research and conservation, I couldn’t think of better advice to end the weekend on.


Looking Back: Three Years After Grad School

By Courtney Hann (NOAA Fisheries, West Coast Sustainable Fisheries Division)

Thinking back, as Leigh’s first M.Sc. student for the GEMM Lab, I wonder what poignant insight could have prepared me for my future endeavors. And having faced years of perseverance and dedication in the face of professional unknowns, perhaps the answer is none at all; fore maybe it was the many unknown challenges met that led me to where I am today.

I graduated in December of 2015, with my Masters in Marine Resource Management, and stamped completion of my research with the GEMM Lab. While my research focused on marine mammals, my broader love for the Earth’s oceans and lands guided my determination to help keep our planet’s precious ecosystem resources wild and free. So when I landed a position in terrestrial ecology after graduating, I chose to embrace the challenging decision of jumping away from theoretical research and moving back towards applied research. Consequently, I fell in love with botany, moth identification, birding, and explored the unknowns of a whole new world of conservation biology in Scotland with the Royal Society for the Protection of Birds. Not only was this work incredibly fun, interesting, and spontaneous, it offered me an opportunity to take my knowledge of developing research projects and apply it to nature reserve management. Every survey I completed and dataset I analyzed provided information required to determine the next land management steps for maximizing the conservation of rare and diverse species. From the GEMM Lab, I brought skills on: how to work through what, at times, seemed like an impassible barrier, complete tasks efficiently under a tight deadline, juggle multiple activities and obligations, and still make time to ponder the importance of seeing the bigger picture, while having fun learning new things.

Above: Botanizing and birding in Scotland with the best botanist I have ever known and my boss, Jeff Waddell, with the Royal Society for the Protection of Birds.

For me, the long game of seeing the bigger picture has always been key. And at the end of the day, I remained steadfast in answering the questioned I posed myself: Why do all of this work if not to make a truly positive impact? With that in mind, and with an expiring visa, I moved back to the West Coast of the U.S. and landed a contracting position with NOAA Fisheries. Where I met my second female mentor, Heidi Taylor, who inspired me beyond words and introduced me to the amazing world of fisheries management. All the while, I kept working my second part-time job with the West Coast Regional Planning Body (now called the West Coast Ocean Alliance, WCOA). Working two jobs allowed me to not only accelerate my learning capacity through more opportunities, but also allowed me to extend the reach of growing a positive impact.  For example, I learned about coordinating region-wide ocean management, facilitation of diverse groups, and working with tribes, states, and federal agencies while working for the WCOA. While there were moments that I struggled with overworking and fatigue, my training in graduate school to persevere really kicked in. Driven by the desire to attain a permanent position that complimented my talents and determination to provide sustained help for our Earth’s ecosystems, I worked for what sometimes felt endlessly to reach my goal. Getting there was tough, but well worth it!

One of the most challenging aspects for me was finishing my last publication for the GEMM Lab. I was no longer motivated by the research, since my career path had taken a different turn, and I was already burnt out form working overtime every week. Therefore, if it was not for Leigh’s encouraging words, the promise I made to her to complete the publication, and my other co-author’s invitation to submit a paper for a particular journal, then I likely would have thrown in the towel. I had to re-do the analysis several times, had the paper rejected once, and then ended up re-writing and re-structuring the entire paper for the final publication. In total, it took me two and half years and 100s of hours to complete this paper after graduating. Of course, there was no funding, so I felt a bit like an ongoing graduate student until the paper was finally accepted and the work complete. But the final acceptance of the paper was so sweet, and after years of uncertain challenges, a heavy weight had finally been lifted. So perhaps, if there is one piece of advice I would say to young graduate students, it is to get your work published before you graduate! I had one paper and one book chapter published before I graduated, and that made my life much easier. While I am proud for finishing the final third publication, I would have much preferred to have just taken one extra semester and finished that publication while in school. But regardless, it was completed. And in a catharsis moment, maybe the challenge of completing it taught me the determination I needed to persevere through difficult situations.

Above: Elephant seal expressing my joy of finishing that last publication! Wooohoooooo!

With that publication out of the way, I was able to focus more time on my career. While I no longer use R on a daily basis and do not miss the hours of searching for that one pesky bug, I do analyze, critique, and use scientific literature everyday. Moreover, the critical thinking, creative, and collaborative skills I honed in the GEMM Lab, have been and will be useful for the rest of my life. Those hours of working through complicated statistical analyses and results in Leigh’s office pay off everyday. Reading outside of work, volunteering and working second jobs, all of this I learned from graduate school. Carrying this motivation, hard work, determination, and perseverance on past graduate school was undeniably what led me to where I am today. I have landed my dream job, working for NOAA Fisheries Sustainable Fisheries Division on salmon management and policy, in my dream location, the Pacific Northwest.  My work now ties directly into ongoing management and policy that shapes our oceans, conservation efforts, and fisheries management. I am grateful for all the people who have supported me along the way, with this blog post focusing on the GEMM Lab and Leigh Torres as my advisor. I hope to be a mentor and guide for others along their path, as so many have helped me along mine. Good luck to any grad student reading this now! But more than luck, carry passion and determination forward because that is what will propel you onward on your own path. Thank you GEMM Lab, it is now time for me to enjoy my new job.

Above: Enjoying in my new home in the Pacific Northwest.


Finding the right fit: a journey into cetacean distribution models

Solène Derville, Entropie Lab, French National Institute for Sustainable Development (IRD – UMR Entropie), Nouméa, New Caledonia

 Ph.D. student under the co-supervision of Dr. Leigh Torres

Species Distribution Models (SDM), also referred to as ecological niche models, may be defined as “a model that relates species distribution data (occurrence or abundance at known locations) with information on the environmental and/or spatial characteristics of those locations” (Elith & Leathwick, 2009)⁠. In the last couple decades, SDMs have become an indispensable part of the ecologists’ and conservationists’ toolbox. What scientist has not dreamed of being able to summarize a species’ environmental requirements and predict where and when it will occur, all in one tiny statistical model? It sounds like magic… but the short acronym “SDM” is the pretty front window of an intricate and gigantic research field that may extend way beyond the skills of a typical ecologist (even so for a graduate student like myself).

As part of my PhD thesis about the spatial ecology of humpback whales in New Caledonia, South Pacific, I was planning on producing a model to predict their distribution in the region and help spatial planning within the Natural Park of the Coral Sea. An innocent and seemingly perfectly feasible plan for a second year PhD student. To conduct this task, I had at my disposal more than 1,000 sightings recorded during dedicated surveys at sea conducted over 14 years. These numbers seem quite sufficient, considering the rarity of cetaceans and the technical challenges of studying them at sea. And there was more! The NGO Opération Cétacés  also recorded over 600 sightings reported by the general public in the same time period and deployed more than 40 satellite tracking tags to follow individual whale movements. In a field where it is so hard to acquire data, it felt like I had to use it all, though I was not sure how to combine all these types of data, with their respective biases, scales and assumptions.

One important thing about SDM to remember: it is like a cracker section in a US grocery shop, there is sooooo much choice! As I reviewed the possibilities and tested various modeling approaches on my data I realized that this study might be a good opportunity to contribute to the SDM field, by conducting a comparison of various algorithms using cetacean occurrence data from multiple sources. The results of this work was just published  in Diversity and Distributions:

Derville S, Torres LG, Iovan C, Garrigue C. (2018) Finding the right fit: Comparative cetacean distribution models using multiple data sources and statistical approaches. Divers Distrib. 2018;00:1–17. https://doi. org/10.1111/ddi.12782

There are simply too many! Anonymous grocery shops, Corvallis, OR
Credit: Dawn Barlow

If you are a new-comer to the SDM world, and specifically its application to the marine environment, I hope you find this interesting. If you are a seasoned SDM user, I would be very grateful to read your thoughts in the comment section! Feel free to disagree!

So what is the take-home message from this work?

  • There is no such thing as a “best model”; it all depends on what you want your model to be good at (the descriptive vs predictive dichotomy), and what criteria you use to define the quality of your models.

The predictive vs descriptive goal of the model: This is a tricky choice to make, yet it should be clearly identified upfront. Most times, I feel like we want our models to be decently good at both tasks… It is a risky approach to blindly follow the predictions of a complex model without questioning the meaning of the ecological relationships it fitted. On the other hand, conservation applications of models often require the production of predicted maps of species’ probability of presence or habitat suitability.

The criteria for model selection: How could we imagine that the complexity of animal behavior could be summarized in a single metric, such as the famous Akaike Information criterion (AIC) or the Area under the ROC Curve (AUC)? My study, and that of others (e.g. Elith & Graham  H., 2009),⁠ emphasize the importance of looking at multiple aspects of model outputs: raw performance through various evaluation metrics (e.g. see AUCdiff; (Warren & Seifert, 2010)⁠, contribution of the variables to the model, shape of the fitted relationships through Partial Dependence Plots (PDP, Friedman, 2001),⁠ and maps of predicted habitat suitability and associated error. Spread all these lines of evidence in front of you, summarize all the metrics, add a touch of critical ecological thinking to decide on the best approach for your modeling question, and Abracadabra! You end up a bit lost in a pile of folders… But at least you assessed the quality of your work from every angle!

  • Cetacean SDMs often serve a conservation goal. Hence, their capacity to predict to areas / times that were not recorded in the data (which is often scarce) is paramount. This extrapolation performance may be restricted when the model relationships are overfitted, which is when you made your model fit the data so closely that you are unknowingly modeling noise rather than a real trend. Using cross-validation is a good method to prevent overfitting from happening (for a thorough review: Roberts et al., 2017)⁠. Also, my study underlines that certain algorithms inherently have a tendency to overfit. We found that Generalized Additive Models and MAXENT provided a valuable complexity trade-off to promote the best predictive performance, while minimizing overfitting. In the case of GAMs, I would like to point out the excellent documentation that exist on their use (Wood, 2017)⁠, and specifically their application to cetacean spatial ecology (Mannocci, Roberts, Miller, & Halpin, 2017; Miller, Burt, Rexstad, & Thomas, 2013; Redfern et al., 2017).⁠
  • Citizen science is a promising tool to describe cetacean habitat. Indeed, we found that models of habitat suitability based on citizen science largely converged with those based on our research surveys. The main issue encountered when modeling this type of data is the absence of “effort”. Basically, we know where people observed whales, but we do not know where they haven’t… or at least not with the accuracy obtained from research survey data. However, with some information about our citizen scientists and a little deduction, there is actually a lot you can infer about opportunistic data. For instance, in New Caledonia most of the sightings were reported by professional whale-watching operators or by the general public during fishing/diving/boating day trips. Hence, citizen scientists rarely stray far from harbors and spend most of their time in the sheltered waters of the New Caledonian lagoon. This reasoning provides the sort of information that we integrated in our modeling approach to account for spatial sampling bias of citizen science data and improve the model’s predictive performance.

Many more technical aspects of SDM are brushed over in this paper (for detailed and annotated R codes of the modeling approaches, see supplementary information of our paper). There are a few that are not central to the paper, but that I think are worth sharing:

  • Collinearity of predictors: Have you ever found that the significance of your predictors completely changed every time you removed a variable? I have progressively come to discover how unstable a model can be because of predictor collinearity (and the uneasy feeling that comes with it …). My new motto is to ALWAYS check cross-correlation between my predictors, and do it THOROUGHLY. A few aspects that may make a big difference in the estimation of collinearity patterns are to: (1) calculate Pearson vs Spearman coefficients, (2) check correlations between the values recorded at the presence points vs over the whole study area, and (3) assess the correlations between raw environmental variables vs between transformed variables (log-transformed, etc). Though selecting variables with Pearson coefficients < 0.7 is usually a good rule (Dormann et al., 2013), I would worry of anything above 0.5, or at least keep it in mind during model interpretation.
  • Cross-validation: If removing 10% of my dataset greatly impacts the model results, I feel like cross-validation is critical. The concept is based on a simple assumption, if I had sampled a given population/phenomenon/system slightly differently, would I have come to the same conclusion? Cross-validation comes in many different methods, but the basic concept is to run the same model several times (number of times may depend on the size of your data set, hierarchical structure of your data, computation power of your computer, etc.) over different chunks of your data. Model performance metrics (e.g., AUC) and outputs (e.g., partial dependence plots) are than summarized on the many runs, using mean/median and standard deviation/quantiles. It is up to you how to pick these chunks, but before doing this at random I highly recommend reading Roberts et al. (2017).

The evil of the R2: I am probably not the first student to feel like what I have learned in my statistical classes at school is in practice, at best, not very useful, and at worst, dangerously misleading. Of course, I do understand that we must start somewhere, and that learning the basics of inferential statistics is a necessary step to, one day, be able to answer your one research questions. Yet, I feel like I have been carrying the “weight of the R2” for far too long before actually realizing that this metric of model performance (R2 among others) is simply not  enough to trust my results. You might think that your model is robust because among the 1000 alternative models you tested, it is the one with the “best” performance (deviance explained, AIC, you name it), but the model with the best R2 will not always be the most ecologically meaningful one, or the most practical for spatial management perspectives. Overfitting is like a sword of Damocles hanging over you every time you create a statistical model All together, I sometimes trust my supervisor’s expertise and my own judgment more than an R2.

Source: internet

A few good websites/presentations that have helped me through my SDM journey:

General website about spatial analysis (including SDM): http://rspatial.org/index.html

Cool presentation by Adam Smith about SDM:

http://www.earthskysea.org/!ecology/sdmShortCourseKState2012/sdmShortCourse_kState.pdf

Handling spatial data in R: http://www.maths.lancs.ac.uk/~rowlings/Teaching/UseR2012/introductionTalk.html

“The magical world of mgcv”, a great presentation by Noam Ross: https://www.youtube.com/watch?v=q4_t8jXcQgc


Literature cited

Dormann, C. F., Elith, J., Bacher, S., Buchmann, C., Carl, G., Carré, G., … Lautenbach, S. (2013). Collinearity: A review of methods to deal with it and a simulation study evaluating their performance. Ecography, 36(1), 027–046. https://doi.org/10.1111/j.1600-0587.2012.07348.x

Elith, J., & Graham  H., C. (2009). Do they? How do they? WHY do they differ? On finding reasons for differing performances of species distribution models . Ecography, 32(Table 1), 66–77. https://doi.org/10.1111/j.1600-0587.2008.05505.x

Elith, J., & Leathwick, J. R. (2009). Species Distribution Models: Ecological Explanation and Prediction Across Space and Time. Annual Review of Ecology, Evolution, and Systematics, 40(1), 677–697. https://doi.org/10.1146/annurev.ecolsys.110308.120159

Friedman, J. H. (2001). Greedy Function Approximation: A gradient boosting machine. The Annals of Statistics, 29(5), 1189–1232. Retrieved from http://www.jstor.org/stable/2699986

Mannocci, L., Roberts, J. J., Miller, D. L., & Halpin, P. N. (2017). Extrapolating cetacean densities to quantitatively assess human impacts on populations in the high seas. Conservation Biology, 31(3), 601–614. https://doi.org/10.1111/cobi.12856.This

Miller, D. L., Burt, M. L., Rexstad, E. A., & Thomas, L. (2013). Spatial models for distance sampling data: Recent developments and future directions. Methods in Ecology and Evolution, 4(11), 1001–1010. https://doi.org/10.1111/2041-210X.12105

Redfern, J. V., Moore, T. J., Fiedler, P. C., de Vos, A., Brownell, R. L., Forney, K. A., … Ballance, L. T. (2017). Predicting cetacean distributions in data-poor marine ecosystems. Diversity and Distributions, 23(4), 394–408. https://doi.org/10.1111/ddi.12537

Roberts, D. R., Bahn, V., Ciuti, S., Boyce, M. S., Elith, J., Guillera-Arroita, G., … Dormann, C. F. (2017). Cross-validation strategies for data with temporal, spatial, hierarchical or phylogenetic structure. Ecography, 0, 1–17. https://doi.org/10.1111/ecog.02881

Warren, D. L., & Seifert, S. N. (2010). Ecological niche modeling in Maxent: the importance of model complexity and the performance of model selection criteria. Ecological Applications, 21(2), 335–342. https://doi.org/10.1890/10-1171.1

Wood, S. N. (2017). Generalized additive models: an introduction with R (second edi). CRC press.