Should scientists engage in advocacy?

By Dominique Kone, Masters Student in Marine Resource Management

Should scientists engage in advocacy? This question is one of the most debated topics in conservation and natural resource management. Some experts firmly oppose researchers advocating for policy decisions because such actions potentially threaten the credibility of their science. While others argue that with environmental issues becoming more complex, society would benefit from hearing scientists’ opinions and preferences on proposed actions. While both arguments are valid, we must recognize the answer to this question may never be a universal yes or no. As an early-career scientist, I’d like to share some of my observations and thoughts on this topic, and help continue this dialogue on the appropriateness of scientists exercising advocacy.

Policymakers are tasked with making decisions that determine how species and natural resources are managed, and subsequently affect and impact society. Scientists commonly play an integral role in these policy decisions, by providing policymakers with reliable and accurate information so they can make better-informed decisions. Examples include using stock assessments to set fishing limits, incorporating the regeneration capacity of forests into the timing of timber harvest, or considering the distribution of blue whales in permitting seafloor mining projects. Importantly, informing policy with science is very different from scientists advocating on policy issues. To understand these nuances, we must first define these terms.

A scientist considering engaging in policy advocacy. Source: Karen Brey.

According to Merriam-Webster, informing means “to communicate knowledge to” or “to give information to an authority”. In contrast, advocating means “to support or argue for (a cause, policy, etc.)” (Merriam-Webster 2019). People can inform others by providing information without necessarily advocating for a cause or policy. For many researchers, providing credible science to inform policy decisions is the gold standard. We, as a society, do not take issue with researchers supplying policymakers with reliable information. Rather, pushback arises when researchers step out of their role as informants and attempt to influence or sway policymakers to decide in a particular manner by speaking to values. This is advocacy.

Dr. Robert Lackey is a fisheries & political scientist, and one of the prominent voices on this issue. In his popular 2007 article, he explains that when scientists inform policy while also advocating, a conflict of interest is created (Lackey 2007). To an outsider, it can be difficult to distinguish values from scientific evidence when researchers engage in policy discussions. Are they engaging in these discussions to provide reliable information as an honest scientist, or are they advocating for decisions or policies based on their personal preferences? As a scientist, I like to believe most scientists – in natural resource management and conservation – do not engage in policy decisions for their own benefit, and they truly want to see our resources managed in a responsible and sustainable manner. Yet, I also recognize this belief doesn’t negate the fact that when researchers engage in policy discussions, they could advocate for their personal preferences – whether they do so consciously or subconsciously – which makes identifying these conflicts of interest particularly challenging.

Examples of actions scientists take in conducting and reporting research. Actions on the left represent actions of policy advocacy, those on the right do not, and the center is maybe. This graphic was adapted from a policy advocacy graphic from Scott et al. 2007. Source: Jamie Keyes.

It seems much of the unease with researchers exercising advocacy has to do with a lack in transparency about which role the researcher chooses to play during those policy debates. A simple remedy to this dilemma – as Lackey suggested in his paper – could be to encourage scientists to be completely transparent when they are about to inform versus advocate (Lackey 2007). Yet, for this suggestion to work, it would require complete trust in scientists to (1) verbalize and make known whether they’re informing or advocating, and (2) when they are informing, to provide credible and unbiased information. I’ve only witnessed a few scientists do this without ensuing some skepticism, which unfortunately highlights issues around an emerging mistrust of researchers to provide policy-neutral science. This mistrust threatens the important role scientists have played in policy decisions and the relationships between scientists and policymakers.

While much of this discussion has been focused on how researchers and their science are received by policymakers, researchers engaging in advocacy are also concerned with how they are perceived by their peers within the scientific community. When I ask more-senior researchers about their concerns with engaging in advocacy, losing scientific credibility is typically at or near the top of their lists. Many of them fear that once you start advocating for a position or policy decision (e.g. protected areas, carbon emission reduction, etc.), you become known for that one cause, which opens you up to questions and suspicions on your ability to provide unbiased and objective science. Once your credibility as a scientist comes into question, it could hinder your career.

How it sometimes feels when researchers conduct policy-relevant science. Source: Justin DeFreitas.

Conservation scientists are faced with a unique dilemma. They value both biodiversity conservation and scientific credibility. Yet, in some cases, risk or potential harm to a species or ecosystem may outweigh concerns over damage to their credibility, and therefore, may choose to engage in advocacy to protect that species or ecosystem (Horton 2015). Horton’s explanation raises an important point that researchers taking a hands-off approach to advocacy may not always be warranted, and that a researcher’s decision to engage in advocacy will heavily depend on the issue at hand and the repercussions if the researcher does not advocate their policy preferences. Climate change is a great example, where climate scientists are advocating for the use of their science, recognizing the alternative could mean continued inaction on carbon emission reduction and mitigation. [Note: this is called science advocacy, which is slightly different than advocating personal preferences, but this example helps demonstrate my point.]

To revisit the question – should scientists engage in advocacy? Honestly, I don’t have a clear answer, because there is no clear answer. This topic is one that has so many dimensions beyond the few I mentioned in this blog post. In my opinion, I don’t think researchers should have an always yes or always no stance on advocacy. Nor do I think every researcher needs to agree on this topic. A researcher’s decision to engage in advocacy will all depend on context. When faced with this decision, it might be useful to ask yourself the following questions: (1) How much do policymakers trust me? (2) How will my peers perceive me if I choose to engage? (3) Could I lose scientific credibility if I do engage? And (4) What’s at stake if I don’t make my preferences known? Hopefully, the answers to these sub-questions will help you decide whether you should advocate.

References:

Horton, C. C., Peterson, T. R., Banerjee, P., and M. J. Peterson. 2015. Credibility and advocacy in conservation science. Conservation Biology. 30(1): 23-32.

Lackey, R. T. 2007. Science, Scientists, and Policy Advocacy. Conservation Biology. 21(1): 12-17.

Scott et al. (2007). Policy advocacy in science: prevalence, perspectives, and implications for conservation biologists. Conservation Biology. 21(1): 29-35.

Merriam-Webster. 2019. Retrieved from < https://www.merriam-webster.com/ >

Signs you’re an ecologist – you don’t spend nearly enough time geeking out about your study species…

By Lisa Hildebrand, MSc student, OSU Department of Fisheries and Wildlife, Geospatial Ecology of Marine Megafauna Lab

This past week has been very busy for me as I gave three quite important, yet very different, presentations. The first was on Tuesday at the Pacific High School in Port Orford, near my study site. The aim of the game was recruitment – my quest for two eager local high schoolers to be my interns for this 2019 summer field season has begun (read blogs written by our 2017 HS interns Nathan Malamud and Quince Nye)! I was lucky enough to be given an entire class period to talk to the students and so I hope that the picture I painted of kayaks, gray whales and sun will be enough to entice students to apply to the internship.

The second was a short presentation in one of the classes I took this term, GEOG 561: GIScience II Analysis and Applications. The class focuses on developing and conducting geospatial analyses in R and throughout the term each student develops a small independent research project using some of their own data. For my research project, I decided to do a small cluster analysis of the zooplankton community data that we have collected from the kayak net samples.

The third and final presentation of the week happened on Thursday and marked one of the big milestones on my Master’s journey: my research review. The research review is a mandatory (and extremely helpful) process in the Department of Fisheries & Wildlife where the student (in this case me), the committee (Dr Leigh Torres, Dr Rachael Orben, Dr Kim Bernard and Dr Susanne Brander) and a department representative (Dr Brian Sidlauskas) all assemble to discuss the student’s research proposal, which lays out the intended work, chapters, analysis and timeline for the students’ thesis. My proposal (which currently bears the title: “Tonight’s specials include mysids, gammarids and more: An examination of the zooplankton prey of Oregon gray whales and its impact on individual foraging patterns”) proposes a two-chapter thesis where the first examines the quality of zooplankton prey, while the second looks at potential individual foraging specialization of gray whales along the Oregon coast. While my entire committee agreed that what I have set forth to do in the next two or so years is ambitious, they provided me with excellent feedback and confidence that I would be able to achieve what I have planned.

Now that it’s the weekend and I’ve had some time to sit back and think about the week, I realized one major commonality between all three presentations I gave. None of the Powerpoints featured more than one image of a gray whale. How could this be?! It is after all my study species and I spend so much of my summer looking at them – how could it be that so little of what I showed and talked about was the thing that I am most passionate about and is so central to my research?

In the course of doing research, it’s easy to get wound up in the nitty gritty and forget about the big picture. While the nitty gritty is also imperative to conducting the research (and ultimately getting results), I sometimes forget about why I do what I do, which is that gray whales are AWESOME. Looking into the past, it seems that some of my lab mates have had the same realizations about their study species before too: see here and here. So for this blog, I want to bring it back to basics and share some of the things that I think are most fascinating about gray whales.

  1. Gray whales are the only baleen whale that feeds benthically. This behavior is facilitated by the shorter and tougher baleen that gray whales possess in comparison to other baleen whale species (Pivorunas 1979). The majority of the Eastern North Pacific (ENP) gray whale population feeds benthically in the Bering Sea where they eat ampeliscid amphipods, which are a type of benthic invertebrates (Nerini 1984). It is estimated that gray whales must regain 11-29% of critical body mass during the feeding season (Villegas-Amtmann et al. 2015) in order to obtain the energy stores they require for the entire year. Besides the personal benefit of sea floor foraging, by using this feeding tactic gray whales create depressions in the soft sediment that benefit other species besides themselves. The highly disruptive nature of this action can increase the biodiversity of the seafloor and initiate scavenging events by lysiannassid amphipods on other infauna (Oliver & Slattery 1985). Furthermore, Grebmeier & Harrison (1992) documented that a variety of seabirds including northern fulmars, black-legged kittiwakes and thick-billed murres feed on benthic amphipods brought to the surface by this unique foraging behavior performed by gray whales.
  1. Gray whales are essentially acrobats. A preference for benthic prey goes hand in hand with a preference for shallow, coastal waters, as for example Pacific Coast Feeding Group gray whales tend to forage within the 5-15 m depth range (Weller et al. 1999). With female adults ranging between 13-15 m in length (females tend to be slightly larger than adult males) and weighing anywhere between 15-33 tons (Jones et al. 1984), I am continuously fascinated by how gracefully and slowly gray whales can navigate extremely shallow waters.

    However, it is more than just simple navigation – the behaviors and moves that some gray whales display while in the shallows is phenomenal too. Last year Torres et al. (2018) documented this agility through unmanned aerial systems (UAS) footage that provided evidence for some novel foraging tactics including headstands, side-swimming, and jaw snapping and flexing.

  1. They sure are resilient. Commercial whaling of gray whales began in 1846 after two commercial whaling vessels first discovered the winter breeding grounds in Baja California, Mexico (Henderson 1984). Following this discovery, the ENP were targeted for roughly a century before receiving full protection under the International Convention for the Regulation of Whaling in 1946 (Reeves 1984). Through genetic analyses, it has been estimated that the pre-whaling abundance of the ENP population was between 76,000 – 118,000 individuals (Alter et al. 2012), which is roughly three to five times larger than current estimates (24,000 – 26,000; Scordino et al. 2018). While the gray whale populations that once existed in the Atlantic Ocean were not as fortunate as those in the Pacific (Atlantic gray whales were declared extinct in the 18thcentury due to extensive whaling; Bryant 1995), the ENP has definitely made a strong comeback. Additionally, gray whale resilience is not only evident on this long temporal scale but it can also be seen annually when gray whale mothers fight relentlessly to keep their calves alive when under attack from killer whales. A study on predation of gray whales by transient killer whales in Alaska reported that attacks were quickly abandoned if calves were aggressively defended by their mothers or if gray whales succeeded in reaching depths of 3 m or less (Barrett-Lennard et al. 2011).
  1. For some unimaginable reason, gray whales appear to feel a strong connection to us. For many, gray whales might be best known for actively seeking out human contact during their breeding season in the Mexican lagoons. I find this actuality particularly interesting because of the bloody history we share with Pacific gray whales.

Those are just some of the things about gray whales that make them so fascinating to me. I look forward to potentially discovering one or two more things that we don’t know about them yet through my research. Even if that doesn’t turn out to be the case, I feel so lucky that I at least get to spend so much time with them during their feeding season here along the Oregon coast.


References

Alter, E.S., et al., Pre-whaling genetic diversity and population ecology in Eastern Pacific gray whales: Insights from ancient DNA and stable isotopes.PLoS ONE, 2012. doi.org/10.1371/journal.pone.0035039.

Barrett-Lennard, L.G., et al., Predation on gray whales and prolonged feeding on submerged carcasses by transient killer whales at Unimak Island, Alaska. Marine Ecology Progress Series, 2011. 421: 229-241.

Bryant, P.J., Dating remains of gray whales from the Eastern North Atlantic. Journal of Mammalogy, 1995. 76(3): 857-861.

Grebmeier, J.M., & Harrison, N.M., Seabird feeding on benthic amphipods facilitated by gray whale feeding activity in the northern Bering Sea. Marine Ecology Progress Series, 1992. 80: 125-133.

Henderson, D.A., Nineteenth century gray whaling: Grounds, catches and kills, practices and depletion of the whale population.Pages 159-186 inJones, M.L. et al., eds. The gray whale: Eschrichtius robustus, 1984. Academic Press, Orlando.

Jones, M.L., et al., The gray whale: Eschrichtius robustus. 1984. Academic Press, Orlando.

Nerini, M., A review of the gray whale feeding ecology. Pages 423-448 inJones, M.L. et al., eds. The gray whale: Eschrichtius robustus, 1984. Academic Press, Orlando.

Oliver, J.S., & Slattery, P.N., Destruction and obstruction on the sea floor: effects of gray whale feeding.Ecology, 1985. 66: 1965-1975.

Pivorunas, A., The feeding mechanisms of baleen whales.American Scientist, 1979. 67(4): 432-440.

Reeves, R.R., Modern commercial pelagic whaling for gray whales. Pages 187-200 inJones, M.L. et al., eds. The gray whale: Eschrichtius robustus, 1984. Academic Press, Orlando.

Scordino, J., et al., Report of gray whale implementation review coordination call on 5 December 2018.

Torres, L.G., et al., Drone up! Quantifying whale behavior from a new perspective improves observational capacity.Frontiers in Marine Science, 2018. 5: doi:10.3389/fmars.2018.00319.

Villegas-Amtmann, S., et al., A bioenergetics model to evaluate demographic consequences of disturbance in marine mammals applied to gray whales. Ecosphere, 2015. 6(10): 1-19.

Weller, D.W., et al., Gray whale (Eschrichtius robustus) off Sakhalin Island, Russia: Seasonal and annual patterns of occurrence. Marine Mammal Science, 1999. 15(4): 1208-1227.

Midway Atoll: the next two weeks at the largest albatross colony in the world (two years later)

By Rachael Orben, Assistant Professor (Senior Research), Seabird Oceanography Lab

This February I had the opportunity to spend two weeks at Midway Atoll National Wildlife Refuge in the Papahānaumokuākea Marine National Monument. I was there to GPS track black-footed and Laysan albatross during their short chick-brooding foraging trips. Two weeks is just enough time since the albatross are taking short trips (3-5 days) to feed their rapidly growing chicks.

My first visit to Midway (2016 blog post) occurred right as the black-footed albatross chicks were hatching (quickly followed by the Laysan albatross chicks). This time, we arrived almost exactly when I had left off. The oldest chicks were just about two weeks old. This shift in phenology meant that, though subtle, each day offered new insights for me as I watched chicks transform into large aware and semi-mobile birds. By the time we left, unattended chicks were rapidly multiplying as the adults shifted to the chick-rearing stage. During chick rearing, both parents leave the chick unattended and take longer foraging trips.

Our research goal was to collect tracking data from both species that can be used to address a couple of research questions. First of all, winds can aid, or hinder albatross foraging and flight efficiency (particularly during the short brooding trips). In the North Pacific, the strength and direction of the winds are influenced by the ENSO (El Niño Southern Oscillation) cycles. The day after we left Midway, NOAA issued an El Niño advisory indicating weak El Nino conditions. We know from previous work at Tern Island (farther east and farther south at 23.87 N, -166.28 W) that El Niño improves foraging for Laysan albatrosses during chick brooding, while during La Niña reproductive success is lower (Thorne et al., 2016). However, since Midway is farther north, and farther west the scenario might be different there. Multiple years of GPS tracking data are needed to address this question and we hope to return to collect more data next year (especially if  La Niña follows the El Niño as is often the case).

We will also overlap the tracking data with fishing boat locations from the Global Fishing Watch database to assess the potential for birds from Midway to interact with high seas fisheries during this time of year (project description, associated blog post). Finally, many of the tags we deployed incorporated a barometric pressure sensor and the data can be used to estimate flight heights relative to environmental conditions such as wind strength. This type of data is key to assessing the impact of offshore wind energy (Kelsey et al., 2018).

How to track an albatross

To track an albatross we use small GPS tags that we tape to the back feathers. After the bird returns from a foraging trip, we remove the tape from the feathers and take the datalogger off. Then we recharge the battery and download the data!

This research is a collaboration between Lesley Thorne (Stony Brook University), Scott Shaffer (San Jose State University), myself (Oregon State University), and Melinda Conners (Washington State University). The field effort was generously supported by the Laurie Landeau Foundation via the Minghua Zhang Early Career Faculty Innovation Fund at Stoney Brook University to Lesley Thorne.

My previous visit to Midway occurred just after house mice were discovered attacking incubating adult albatrosses. Since then, a lot of thought and effort had gone into developing a plan to eradicate mice from Midway. You can find out more via Island Conservation’s Midway blogs and the USFWS.
References

Kelsey, E. C., Felis, J. J., Czapanskiy, M., Pereksta, D. M., & Adams, J. (2018). Collision and displacement vulnerability to offshore wind energy infrastructure among marine birds of the Pacific Outer Continental Shelf. Journal of Environmental Management, 227, 229–247. http://doi.org/10.1016/j.jenvman.2018.08.051

Thorne, L. H., Conners, M. G., Hazen, E. L., Bograd, S. J., Antolos, M., Costa, D. P., & Shaffer, S. A. (2016). Effects of El Niño-driven changes in wind patterns on North Pacific albatrosses. Journal of the Royal Society Interface, 13(119), 20160196. http://doi.org/10.1098/rsif.2016.0196

Photogrammetry Insights

By Leila Lemos, PhD Candidate, Fisheries and Wildlife Department, Oregon State University

After three years of fieldwork and analyzing a large dataset, it is time to finally start compiling the results, create plots and see what the trends are. The first dataset I am analyzing is the photogrammetry data (more on our photogrammetry method here), which so far has been full of unexpected results.

Our first big expectation was to find a noticeable intra-year variation. Gray whales spend their winter in the warm waters of Baja California, Mexico, period while they are fasting. In the spring, they perform a big migration to higher latitudes. Only when they reach their summer feeding grounds, that extends from Northern California to the Bering and Chukchi seas, Alaska, do they start feeding and gaining enough calories to support their migration back to Mexico and subsequent fasting period.


Northeastern gray whale migration route along the NE Pacific Ocean.
Source: https://journeynorth.org/tm/gwhale/annual/map.html


Thus, we expected to see whales arriving along the Oregon coast with a skinny body condition that would gradually improve over the months, during the feeding season. Some exceptions are reasonable, such as a lactating mother or a debilitated individual. However, datasets can be more complex than we expect most of the times, and many variables can influence the results. Our photogrammetry dataset is no different!

In addition, I need to decide what are the best plots to display the results and how to make them. For years now I’ve been hearing about the wonders of R, but I’ve been skeptical about learning a whole new programming/coding language “just to make plots”, as I first thought. I have always used statistical programs such as SPSS or Prism to do my plots and they were so easy to work with. However, there is a lot more we can do in R than “just plots”. Also, it is not just because something seems hard that you won’t even try. We need to expose ourselves sometimes. So, I decided to give it a try (and I am proud of myself I did), and here are some of the results:


Plot 1: Body Area Index (BAI) vs Day of the Year (DOY)


In this plot, we wanted to assess the annual Body Area Index (BAI) trends that describe how skinny (low number) or fat (higher number) a whale is. BAI is a simplified version of the BMI (Body Mass Index) used for humans. If you are interested about this method we have developed at our lab in collaboration with the Aerial Information Systems Laboratory/OSU, you can read more about it in our publication.

The plots above are three versions of the same data displayed in different ways. The first plot on the left shows all the data points by year, with polynomial best fit lines, and the confidence intervals (in gray). There are many overlapping observation points, so for the middle plot I tried to “clean up the plot” by reducing the size of the points and taking out the gray confidence interval range around the lines. In the last plot on the right, I used a linear regression best fit line, instead of polynomial.

We can see a general trend that the BAI was considerably higher in 2016 (red line), when compared to the following years, which makes us question the accuracy of the dataset for that year. In 2016, we also didn’t sample in the month of July, which is causing the 2016 polynomial line to show a sharp decrease in this month (DOY: ~200-230). But it is also interesting to note that the increasing slope of the linear regression line in all three years is very similar, indicating that the whales gained weight at about the same rate in all years.


Plot 2: Body Area Index (BAI) vs Body Condition Score (BCS)


In addition to the photogrammetry method of assessing whale body condition, we have also performed a body condition scoring method for all the photos we have taken in the field (based on the method described by Bradford et al. 2012). Thus, with this second set of plots, we wanted to compare both methods of assessing whale body condition in order to evaluate when the methods agree or not, and which method would be best and in which situation. Our hypothesis was that whales with a ‘fair’ body condition would have a lower BAI than whales with a ‘good’ body condition.

The plots above illustrate two versions of the same data, with data in the left plot grouped by year, and the data in the right plot grouped by month. In general, we see that no whales were observed with a poor body condition in the last analysis months (August to October), with both methods agreeing to this fact. Additionally, there were many whales that still had a fair body condition in August and September, but less whales in the month of October, indicating that most whales gained weight over the foraging seasons and were ready to start their Southbound migration and another fasting period. This result is important information regarding monitoring and conservation issues.

However, the 2016 dataset is still a concern, since the whales appear to have considerable higher body condition (BAI) when compared to other years.


Plot 3:Temporal Body Area Index (BAI) for individual whales


In this last group of plots, we wanted to visualize BAI trends over the season (using day of year – DOY) on the x-axis) for individuals we measured more than once. Here we can see the temporal patterns for the whales “Bit”, “Clouds”, “Pearl”, “Scarback, “Pointy”, and “White Hole”.

We expected to see an overall gradual increase in body condition (BAI) over the seasons, such as what we can observe for Pointy in 2018. However, some whales decreased their condition, such as Bit in 2018. Could this trend be accurate? Furthermore, what about BAI measurements that are different from the trend, such as Scarback in 2017, where the last observation point shows a lower BAI than past observation points? In addition, we still observe a high BAI in 2016 at this individual level, when compared to the other years.

My next step will be to check the whole dataset again and search for inconsistencies. There is something causing these 2016 values to possibly be wrong and I need to find out what it is. The overall quality of the measured photogrammetry images was good and in focus, but other variables could be influencing the quality and accuracy of the measurements.

For instance, when measuring images, I often struggled with glare, water splash, water turbidity, ocean swell, and shadows, as you can see in the photos below. All of these variables caused the borders of the whale body to not be clearly visible/identifiable, which may have caused measurements to be wrong.


Examples of bad conditions for performing photogrammetry: (1) glare and water splash, (2) water turbidity, (3) ocean swell, and (4) a shadow created in one of the sides of the whale body.
Source: GEMM Lab. Taken under NMFS permit 16111 issued to John Calambokidis.


Thus, I will need to check all of these variables to identify the causes for bad measurements and “clean the dataset”. Only after this process will I be able to make these plots again to look at the trends (which will be easy since I already have my R code written!). Then I’ll move on to my next hypothesis that the BAI of individual whales varied by demographics including sex, age and reproductive state.

To carry out robust science that produces results we can trust, we can’t simply collect data, perform a basic analysis, create plots and believe everything we see. Data is often messy, especially when developing new methods like we have done here with drone based photogrammetry and the BAI. So, I need to spend some important time checking my data for accuracy and examining confounding variables that might affect the dataset. Science can be challenging, both when interpreting data or learning a new command language, but it is all worth it in the end when we produce results we know we can trust.


Plastics truly are ubiquitous in the marine environment

By Lisa Hildebrand, MSc student, OSU Department of Fisheries and Wildlife, Geospatial Ecology of Marine Megafauna Lab

As I enter my second term at OSU as a Master’s student, the ideas and structure of my thesis are slowly coming together. As of right now, my plan is to have two data chapters: The first chapter will assess the quality of zooplankton prey gray whales have access to along the Oregon coast, by looking at energetic value and microplastic content. I will contemplate about how my results potentially affect gray whale health. The second chapter will investigate fine-scale foraging and space use of gray whales in the Port Orford area to determine whether individual specialisation exists.

Fig 1. What it feels like when you start a literature review. Source: Harvard Blogs.

When I first started digging into the scientific literature to prepare for writing my thesis proposal (which is still underway but I’m getting close to the end of a first draft…), one sentence that I seemed to stumble across more often than not was “Marine plastics are ubiquitous” or “Plastics have become ubiquitous in the marine environment” or some other, very similar, iteration of that statement (e.g. Machovsky-Capuska et al. 2019; Eriksen et al. 2014; Fendall & Sewell 2009).

Many of the papers I first read were review papers on microplastics that mostly discussed general concepts like dispersal mechanisms, trophic transfer, or how microplastics become degraded. While I often think of review papers as treasure chests, since they neatly and succinctly summarise an often complicated and busy area of research into just a few pages, sometimes the fine-scale detail can go missing. Therefore, when reading these review papers, I wasn’t learning the in depth details about specific studies where microplastics had been detected in a group of individuals, population or species. So I felt the statement “Plastics are ubiquitous” was just a good (and pretty dramatic) opening line for a paper. However, once I delved into the studies on single species, I was overwhelmed by the amount of results that GoogleScholar spit out at me. If you type “microplastics marine” into the search bar, you’ll get about 7,650 results. This amount might not sound like a lot, especially if you compare it to say “gray whale”, which generates 96,600 results. Yet, the microplastic extraction method typically used was only developed in 2004 (Thompson et al. 2004). Hence, in a span of just 15 years, over 7,000 studies have detected microplastics in over 660 marine organisms (Secretariat of the Convention on Biological Diversity 2012) – a fact I find extremely troubling.

Fig 2. Graphic explaining how plastics don’t go away. Source: Biotecnika.

Microplastics are most commonly viewed as particles <5 mm in size (though there is some contention on this size classification, e.g. Claessens et al. 2013). Microplastics arise from several sources, including fragmentation of larger plastics by UV photo-degradation, wave action and physical abrasion, loss of pre-production pellets (nurdles) and polystyrene beads from shipping vessels, waste water discharge containing microbeads used in cosmetics and microfibers released during the washing of textiles and run-off from land (Nelms et al. 2018). Their small size makes these persistent particles bioavailable to ingestion by a variety of marine taxa, ranging from small prey organisms such as zooplankton, to large megafauna such as whales.

Zooplankton are at the base of marine food webs and are therefore consumed in large quantities by a large number of consumers. The propensity of zooplankton to feed in surface waters makes them highly susceptible to encountering and ingesting microplastics as this is where these synthetic particles are highly abundant (Botterell et al. 2018). Microplastics have been detected in zooplankton from the Northeast Pacific Ocean (Desforges et al. 2015), northern South China Sea (Sun et al. 2017), and Portuguese coast (Frias et al. 2014). Additionally, there is documented overlap between microplastic and zooplankton occurrence at many more locations (e.g. North Western Mediterranean Sea, Collignon et al. 2012; Baltic Sea, Gorokhova 2015; Arctic Ocean, Lusher et al. 2015a). As microplastics research is still in its relative infancy, the extent to which microplastics are ingested by zooplankton and the consequences of this behaviour are uncertain. Nevertheless, exposure to microplastics could lead to entanglement of particles within feeding appendages and/or block internal organs, which may result in reduced feeding, poor overall health, injury and death (Desforges et al. 2015). Though a lab study has found that microplastics are expelled by zooplankton after ingestion, the gut-retention times varied between species, and there is the potential risk of exposure to toxins that leech off of particles while in the body (Cole et al. 2013; the below video is from the afore-mentioned study showing how plankton eat plastics, which are illuminated in fluorescent green).

The large knowledge gap regarding the health implications indicates a strong need for more laboratory studies that investigate the long-term effects of persistent exposure to microplastics on lower trophic organisms, as well as continued short-term experiments that examine whether different zooplankton species are affected differently, since morphologies and life-histories vary widely.

Let’s take a step back and re-focus our lens onto a marine taxa that is much, much bigger in size than a zooplankton: cetaceans. Plastic debris has been documented in the stomachs of stranded individuals of several cetacean species (See Baulch & Perry 2014 for a review), however findings of microplastics in cetaceans are less common. Since cetaceans consume large amounts of prey a day, up to several tons daily for some baleen whales, the likelihood that they are ingesting microplastics through their prey is relatively high (Nelms et al. 2018). Therefore the low number of reported cases is again likely due to the relative novelty of microplastic detection methods. Despite the paucity of studies, microplastics have been found in a True’s beaked whale (Mesoplodon mirus, Lusher et al. 2015b), a humpback whale (Megaptera novaeangliae, Besseling et al. 2015) and an Indo-Pacific humpback dolphin (Sousa chinensis, Zhu et al. 2018), showing that microplastic ingestion by cetaceans does occur. Whether these individuals actively (i.e. active feeding) or passively (i.e. uptake through prey consumption) consumed the microplastics, or inhaled them at the water-air interface, is unknown. As with zooplankton, the short- and long-term impacts of ingesting microplastics by marine mammals is also unknown, though impacts on survival, feeding and uptake of toxins are all possibilities.

Fig 3. Example of a light trap sample collected off the Newport coast. Source: L. Torres.

The data collection and analysis I am doing for my thesis will hopefully fill small pockets in these large knowledge gaps. I hope to be able to quantify the extent of microplastic pollution among zooplankton species in nearshore Oregon waters. By comparing samples from several years, months and locations, I will determine whether microplastic loads vary spatially and temporally. Since their abundance and presence have been described as being patchy due to the influence of oceanographic and weather conditions (GESAMP 2016), it would seem reasonable to assume that there will be variation. But, results are a ways away as we have not even started our microplastic extraction techniques, which involves digesting samples in potassium hydroxide solution, incubating them at 50ºC for 48-72 hours, sorting through the dissolved material to identify potential plastics and sending them away for analysis. We first have to work our way through jars upon jars of unopened zooplankton light trap samplesthat need to be sorted by species. I am thankfully joined by undergraduate Robyn Norman who has already assisted this project immensely over the last two years with her zooplankton sorting prowess. So in case anyone wants to come looking for us over the next few weeks, you’ll find both Robyn and me sitting in front of a laminar flow hood in the lab of ecotoxicologist Dr. Susanne Brander, with whom we are collaborating on the microplastics portion of my thesis.


References

Baulch, S., & Perry, C., Evaluating the impacts of marine debris on cetaceans. Marine Pollution Bulletin, 2014. 80(1-2): 210-221.

Besseling, E., et al., Microplastic in a macro filter feeder: humpback whale Megaptera novaeangliae. Marine Pollution Bulletin, 2015. 95: 248-252.

Botterell, Z.L.R., et al., Bioavailability and effects of microplastics on marine zooplankton: a review. Environmental Pollution, 2018. 245: 98-110.

Claessens, M., et al., New techniques for the detection of microplastics in sediments and field collected organisms. Marine Pollution Bulletin, 2013. 70(1-2): 227-233.

Cole, M., et al., Microplastic ingestion by zooplankton. Environmental Science & Technology, 2013. 47(12): 6646-6655.

Collignon, A., et al., Neustonic microplastic and zooplankton in the North Western Mediterranean Sea. Marine Pollution Bulletin, 2012. 64(4): 861-864.

Desforges, JP.W., et al., Ingestion of microplastics by zooplankton in the Northeast Pacific Ocean. Archives of Environmental Contamination and Toxicology, 2015. 69(3): 320-330.

Eriksen, M., et al., Plastic pollution in the world’s oceans: more than 5 trillion plastic pieces weighing over 250,000 tons afloat at sea. PLoS ONE, 2014. doi.org/10.1371/journal.pone.0111913.

Fendall, L.S., & Sewell, M.A., Contributing to marine pollution by washing your face: microplastics in facial cleansers. Marine Pollution Bulletin, 2009. 58(8): 1225-1228.

Frias, J.P.G.L., et al., Evidence of microplastics in samples of zooplankton from Portuguese coastal waters. Marine Environmental Research, 2014. 95: 89-95.

GESAMP, Sources, fates and effects of microplastics in the marine environment: part 2 of a global assessment. Second United Nations Environment Assembly, 2016. http://www.gesamp.org/site/assets/files/1720/rs93e.pdf

Gorokhova, E., Screening for microplastic particles in plankton samples: how to integrate marine litter assessment into existing monitoring programs? Marine Pollution Bulletin, 2015. 99(1-2): 271-275.

Lusher, A.L., et al., Microplastics in Arctic polar waters: the first reported values of particles in surface and sub-surface samples. Scientific Reports, 2015a. 5: 14947.

Lusher, A.L., et al., Microplastic and macroplastic ingestion by a deep diving, oceanic cetacean: the True’s beaked whales Mesoplodon mirus. Environmental Pollution, 2015b. 199: 185-191.

Machovsky-Capuska, G.E., et al., A nutritional perspective on plastic ingestion in wildlife. Science of the Total Environment, 2019. 656: 789-796.

Nelms, S.E., et al., Investigating microplastic trophic transfer in marine top predators. Environmental Pollution, 2018. 238: 999-1007.

Secretariat of the Convention on Biological Diversity and the Scientific and Technical Advisory Panel – GEF (2012), Impacts of marine debris on biodiversity: current status and potential solutions. Montreal, Technical Series. 67: 1-61.

Sun, X., et al., Ingestion of microplastics by natural zooplankton groups in the northern South China Sea. Marine Pollution Bulletin, 2017. 115(1-2): 217-224.

Thompson, R.C., et al., Lost at sea: where is all the plastic? Science, 2004. 304(5672): 838.

Zhu, J., et al., Cetaceans and microplastics: First report of microplastic ingestion by a coastal delphinid, Sousa chinensis. Science of the Total Environment, 2018. 659: 649-654.

GEMM Lab 2018: A Year in the Life

By Dawn Barlow, PhD student, Department of Fisheries & Wildlife, Geospatial Ecology of Marine Megafauna Lab

As 2018 draws to a close, it is gratifying to step back and appreciate the accomplishments of the past year. For all members of the GEMM Lab, 2018 has certainly been one for the books! Here are some of our highlights for your holiday enjoyment.

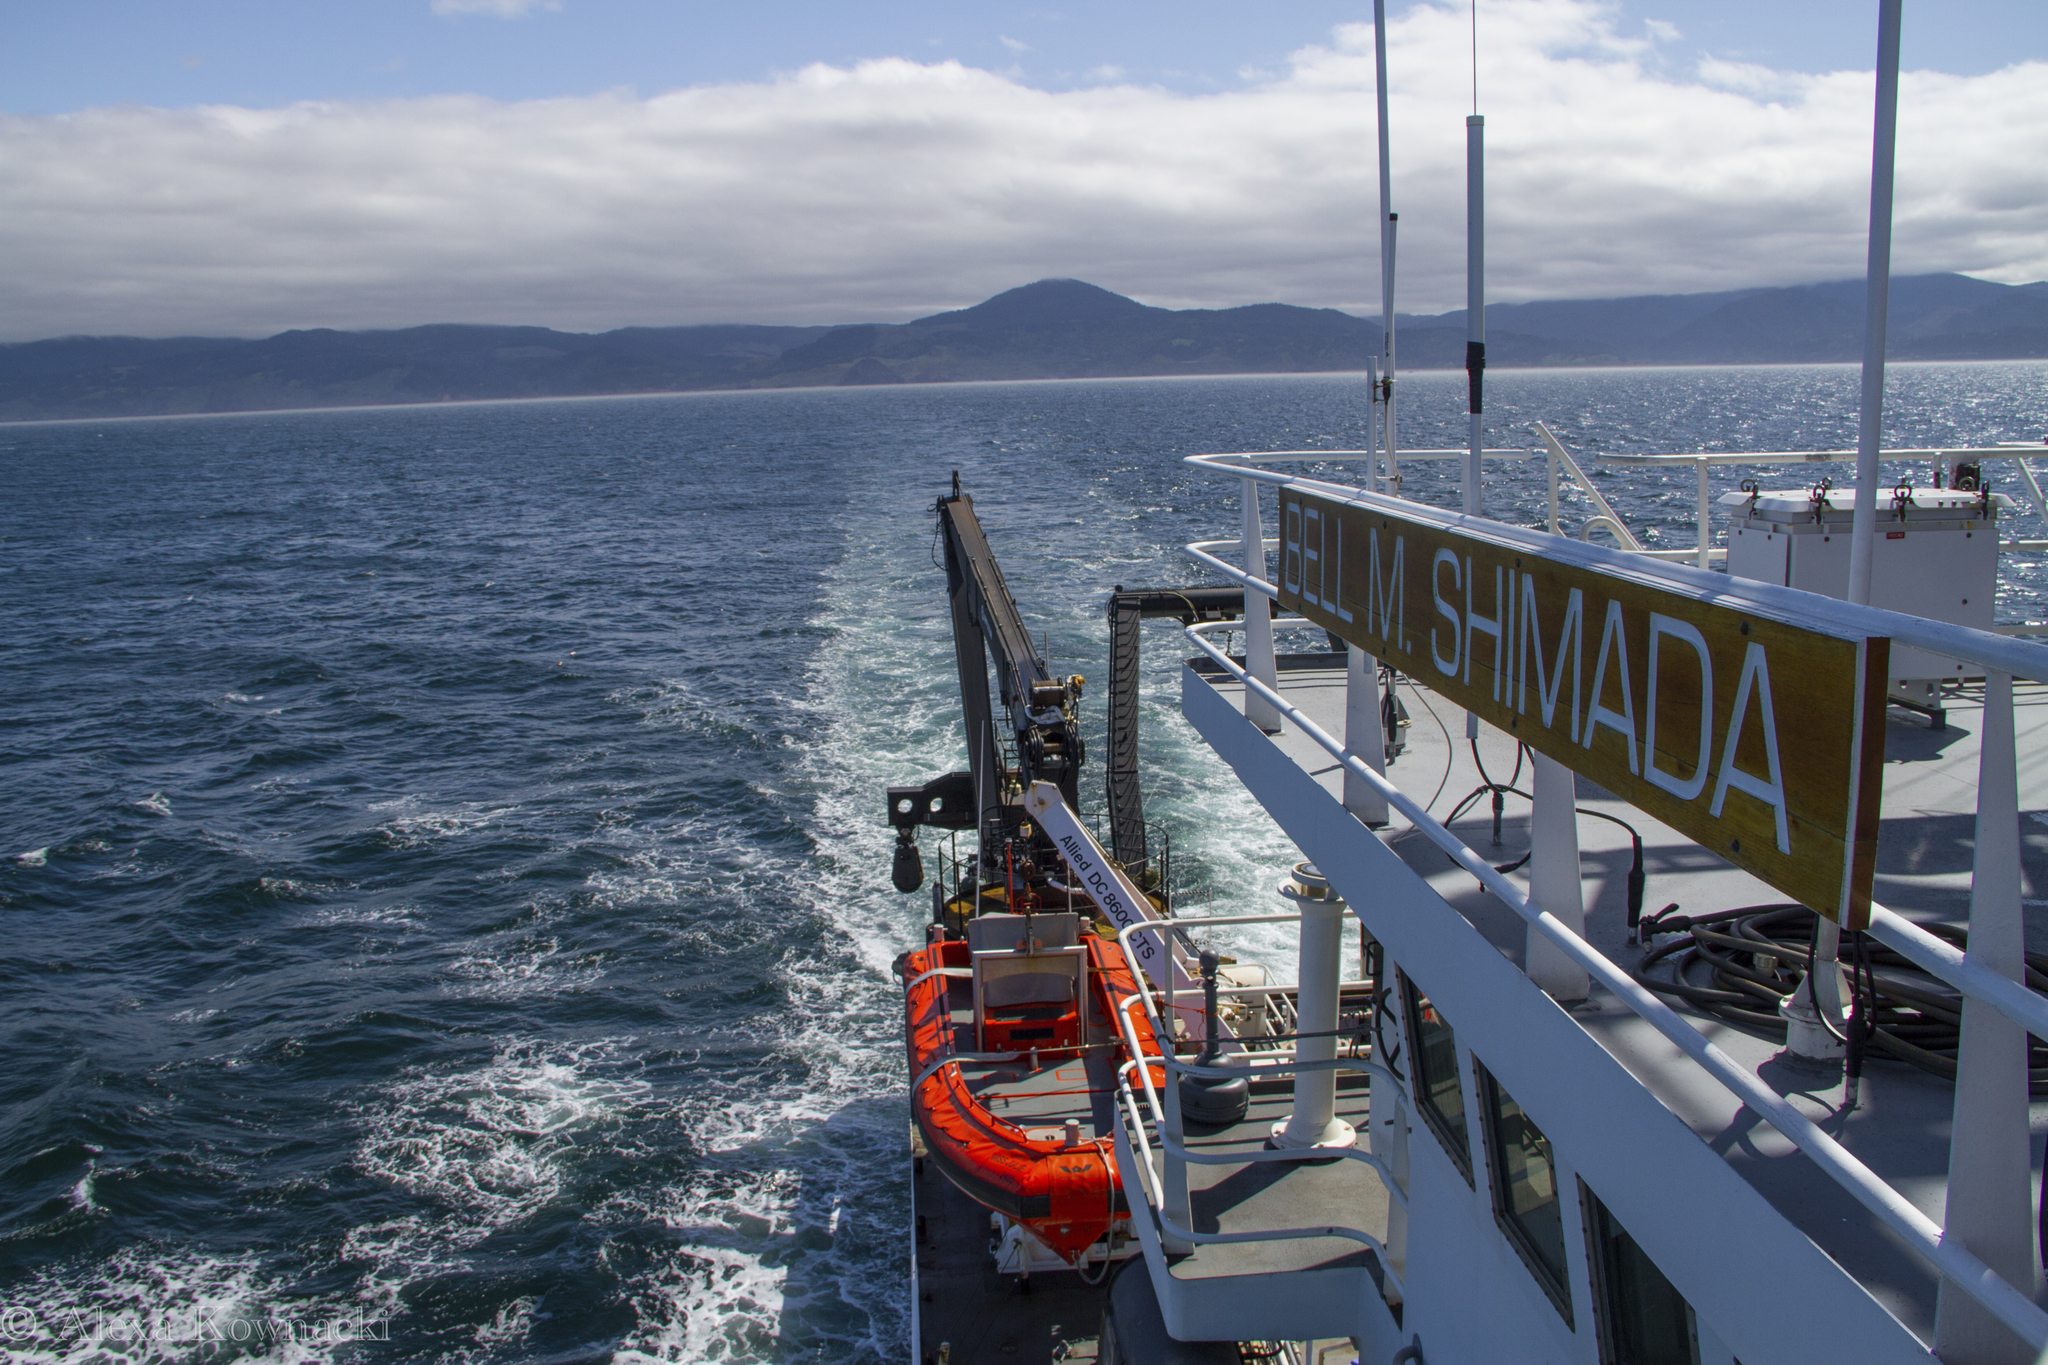
We conducted fieldwork to collect new data in multiple seasons, multiple hemispheres, and across oceans. For the first time, GEMM Lab members joined the Northern California Current Ecosystem cruises aboard NOAA ship Bell M. Shimada as marine mammal observers—Florence in February, Alexa in May, and me in September.

Summertime in the Pacific Northwest brings the gray whales to the Oregon Coast. The drone-flying, poop-scooping, plankton-trapping team of Leigh, Todd, Leila, Joe, and Sharon took to the water for the third year to investigate the health of this gray whale population. It was a successful field season, ending with 72 fecal samples collected! Visiting students joined our experienced members to shadow the gray whale fieldwork—Julia Stepanuk and Alejandro Fernandez Ajo came from across the country to hop on board with us for a bit. Friendship and collaboration were built quickly in a little boat chasing after whale poop, bonding over peanut butter and jelly sandwiches.

Another GEMM Lab team tracked the gray whales from the cliff in Port Orford. Lisa Hildebrand joined us as the GEMM Lab’s newest graduate student, and immediately led a team of interns on Oregon’s southern coast to track gray whale movements and sample their prey from a trusty research kayak.

The summer 2018 gray whale foraging ecology team, affectionately known as “team whale storm”, at the Port Orford Field Station.

Rachael observed seabirds from Yaquina Head in May and June, where the colony of common murres had the highest reproductive success in 10 years! Then she left the summertime in July to travel to the other end of the world, braving winter in the remote South Atlantic to study South American fur seals in the Falkland Islands.

Dr. Rachael Orben and Dr. Alistair Bayliss looking out towards the fur seals. Photo: Kayleigh Jones

In New Caledonia, Solene and a research team ventured to Antigonia Seamount and Orne Bank to study the use of these offshore areas by breeding humpback whales. They collected numerous biopsy samples and successfully deployed satellite tags. Solene was also selected to receive the Louis Herman research scholarship to continue studying humpback whale movement and diving behavior around seamounts.

Sorting biopsy samples during a successful expedition to study humpback whales around remote seamounts in the South Pacific.

Beyond fieldwork, our members have been busily disseminating our findings. In July, Leigh and I traveled to Wellington to present our latest findings on New Zealand blue whales to scientists, managers, politicians, industry representatives, and advocacy groups. Because of our documentation of a unique New Zealand blue whale population, which was published earlier this year, the New Zealand government has proposed to create a Marine Mammal Sanctuary for the protection of blue whales. This is quite a feat, considering blue whales were classified as only “migrant” in New Zealand waters prior to our work. Fueled by flat whites in wintery Wellington, we navigated government buildings, discussing blue whale distribution patterns, overlap with the oil and gas industry, what we now know based on our latest analyses, and what we consider to be the most pressing gaps in our knowledge.

Dr. Leigh Torres and Dawn Barlow in front of Parliament in Wellington, New Zealand following the presentation of their recent findings.

Alexa spent the summer and fall in San Diego, where she collaborated with researchers at NOAA Southwest Fisheries Science Center on her study of about the health of bottlenose dolphins off the California coast. Her time down south has been productive and we look forward to having her back in Oregon with us to round out the second year of her PhD program.

In the fall, Dom and Leigh participated in the first ever Oregon Sea Otter Status of Knowledge Symposium. With growing interest in a potential sea otter reintroduction, the symposium brought together a range of experts – including scientists, managers, and tribes – to discuss what we currently know about sea otters in other regions and how this knowledge could be applied to an Oregon reintroduction effort. Dom was one of many speakers at this event, and gave a well-received talk on Oregon’s previous sea otter reintroduction attempt and brief discussion on his thesis research. Over the next year, Dom not only plans to finish his thesis, but also to join an interdisciplinary research team to further investigate other social, genetic, and ecological implications of a potential sea otter reintroduction.

Sea otter mom and pup. Source: Hakai Magazine.
2018-19 OSU NRT Cohort. Source: Oregon State University.

Several GEMM Lab members reached academic milestones this year. Rachael was promoted to Assistant Professor in the spring! She now leads the Seabird Oceanography Lab, and remains involved in multiple projects studying seabirds and pinnipeds all over the world. Leila passed her PhD qualifying exams and advanced to candidacy in the spring, a major accomplishment toward completing her doctoral degree. I successfully defended my MS degree in June, and my photo was added to our wall gallery of GEMM Lab graduates. I won’t be leaving the GEMM Lab anytime soon, however, as I will be continuing my research on New Zealand blue whales as a PhD student. The GEMM Lab welcomed a new MS student in the summer—Lisa Hildebrand will be studying gray whale foraging ecology on the Oregon Coast. Welcome, Lisa! In early December, Solene successfully defended her PhD, officially becoming Dr. Derville. Congratulations to all on these milestones, and congratulations to Leigh for continuing to grow such a successful lab and guiding us all toward these accomplishments.

Dawn Barlow answers questions during her M.Sc. defense seminar.
Dr. Solene Derville and co-supervisors Dr. Claire Garrigue and Dr. Leigh Torres after a successful PhD Defense!

Perhaps you’re looking to do some reading over the holidays? The GEMM Lab has been publishing up a storm this year! The bulletin board outside our lab is overflowing with new papers. Summarizing our work and sharing our findings with the scientific community is a critical piece of what we do. The 21 new publications this year in 14 scientific journals include contributions from Leigh (13), Rachael (3), Solene (3), Leila (6), Florence (1), Amanda (1), Erin (1), Courtney (1), Theresa (1), and myself (3). Scroll down to the end of this post to see the complete list!

If you are reading this, thank you for your support of our lab, our members, and our work. Our successes come not only from our individual determination, but more importantly from our support of one another and the support of our communities. We look forward to what’s ahead in 2019. Happy holidays from the GEMM Lab!

The whole GEMM Lab (lab dogs included) gathered for an evening playing “Evolution” at Leigh’s house.

Barlow, D. R., Torres, L. G., Hodge, K. B., Steel, D., Baker, C. S., Chandler, T. E., Bott, N., Constantine, R., Double, M. C., Gill, P., Glasgow, D., Hamner, R. M., Lilley, C., Ogle, M., Olson, P. A., Peters, C., Stockin, K. A., Tessaglia-Hymes, C. T., & Klinck, H. (2018). Documentation of a New Zealand blue whale population based on multiple lines of evidence. Endangered Species Research36, 27-40.

Barlow, D. R., Fournet, M., & Sharpe, F. (2018). Incorporating tides into the acoustic ecology of humpback whales. Marine Mammal Science.

Baylis, A. M., Tierney, M., Orben, R. A., Staniland, I. J., & Brickle, P. (2018). Geographic variation in the foraging behaviour of South American fur seals. Marine Ecology Progress Series596, 233-245.

Bishop, A., Brown, C., Rehberg, M., Torres, L., & Horning, M. (2018). Juvenile Steller sea lion (Eumetopias jubatus) utilization distributions in the Gulf of Alaska. Movement ecology6(1), 6.

Burnett, J. D., Lemos, L., Barlow, D., Wing, M. G., Chandler, T., & Torres, L. G. (2018). Estimating morphometric attributes of baleen whales with photogrammetry from small UASs: A case study with blue and gray whales. Marine Mammal Science.

Cardoso, M. D., Lemos, L. S., Roges, E. M., de Moura, J. F., Tavares, D. C., Matias, C. A. R., … & Siciliano, S. (2018). A comprehensive survey of Aeromonas sp. and Vibrio sp. in seabirds from southeastern Brazil: outcomes for public health. Journal of applied microbiology124(5), 1283-1293.

Derville, S., Torres, L. G., Iovan, C., & Garrigue, C. (2018). Finding the right fit: Comparative cetacean distribution models using multiple data sources and statistical approaches. Diversity and Distributions24(11), 1657-1673.

Derville, S., Torres, L. G., & Garrigue, C. (2018). Social segregation of humpback whales in contrasted coastal and oceanic breeding habitats. Journal of Mammalogy99(1), 41-54.

Hann, C. H., Stelle, L. L., Szabo, A., & Torres, L. G. (2018). Obstacles and Opportunities of Using a Mobile App for Marine Mammal Research. ISPRS International Journal of Geo-Information7(5), 169.

Holdman, A. K., Haxel, J. H., Klinck, H., & Torres, L. G. (2018). Acoustic monitoring reveals the times and tides of harbor porpoise (Phocoena phocoena) distribution off central Oregon, USA. Marine Mammal Science.

Kirchner, T., Wiley, D. N., Hazen, E. L., Parks, S. E., Torres, L. G., & Friedlaender, A. S. (2018). Hierarchical foraging movement of humpback whales relative to the structure of their prey. Marine Ecology Progress Series607, 237-250.

Moura, J. F., Tavares, D. C., Lemos, L. S., Acevedo-Trejos, E., Saint’Pierre, T. D., Siciliano, S., & Merico, A. (2018). Interspecific variation of essential and non-essential trace elements in sympatric seabirds. Environmental pollution242, 470-479.

Moura, J. F., Tavares, D. C., Lemos, L. S., Silveira, V. V. B., Siciliano, S., & Hauser-Davis, R. A. (2018). Variation in mercury concentration in juvenile Magellanic penguins during their migration path along the Southwest Atlantic Ocean. Environmental Pollution238, 397-403.

Orben, R. A., Kokubun, N., Fleishman, A. B., Will, A. P., Yamamoto, T., Shaffer, S. A., Takahashi, A., & Kitaysky, A. S. (2018). Persistent annual migration patterns of a specialist seabird. Marine Ecology Progress Series593, 231-245.

Orben, R. A., Connor, A. J., Suryan, R. M., Ozaki, K., Sato, F., & Deguchi, T. (2018). Ontogenetic changes in at-sea distributions of immature short-tailed albatrosses Phoebastria albatrus. Endangered Species Research35, 23-37.

Pickett, E. P., Fraser, W. R., Patterson‐Fraser, D. L., Cimino, M. A., Torres, L. G., & Friedlaender, A. S. (2018). Spatial niche partitioning may promote coexistence of Pygoscelis penguins as climate‐induced sympatry occurs. Ecology and Evolution8(19), 9764-9778.

Siciliano, S., Moura, J. F., Tavares, D. C., Kehrig, H. A., Hauser-Davis, R. A., Moreira, I., Lavandier, R., Lemos, L. S., & Quinete, N. S. (2018). Legacy Contamination in Estuarine Dolphin Species From the South American Coast. In Marine Mammal Ecotoxicology (pp. 95-116). Academic Press.

Sullivan, F. A., & Torres, L. G. (2018). Assessment of vessel disturbance to gray whales to inform sustainable ecotourism. The Journal of Wildlife Management82(5), 896-905.

Sztukowski, L. A., Cotton, P. A., Weimerskirch, H., Thompson, D. R., Torres, L. G., Sagar, P. M., Knights, A. M., Fayet, A. L., & Votier, S. C. (2018). Sex differences in individual foraging site fidelity of Campbell albatross. Marine Ecology Progress Series601, 227-238.

Torres, L. G., Nieukirk, S. L., Lemos, L., & Chandler, T. E. (2018). Drone up! Quantifying whale behavior from a new perspective improves observational capacity. Frontiers in Marine Science5.

Yates, K. L., Bouchet, P. J., Caley, M. J., Mengersen, K., Randin, C. F., Parnell, S., … & Sequeira, A. M. M. (2018). Outstanding challenges in the transferability of ecological models. Trends in ecology & evolution.


Who Am I? Exploring the theory of individualisation among marine mammals

By Lisa Hildebrand, MSc student, OSU Department of Fisheries and Wildlife, Geospatial Ecology of Marine Megafauna Lab

“Just be yourself!” is a phrase that everyone has probably heard at least once in their lives. The idea of being an individual who is distinctly different from other individuals is a concept that is focal to the society we live in today. While historically it may have been frowned upon to be the “black sheep in the crowd”, nowadays that seems to be the goal.

Source: Go Comics.

This quest for uniqueness has resulted in different styles of fashion, speech, profession, interest in art, music, literature, automobile types – the list is endless. The American Psychological Association defines personality as the “individual differences in characteristic patterns of thinking, feeling and behaving”1. So, all of the choices we make on a daily basis shape our behaviour, and our behaviour in turn shapes our personality.

Since personality is something that is so engrained within human society, it isn’t surprising that ecologists have explored this concept among non-humans. Decades of research have resulted in an abundance of literature detailing personality in many different taxa and species, ranging from chimpanzees to mice to ants2. Naturally, the definition of personality for animals differs from that for humans since the assessment of animal thoughts and feelings is still somewhat of a locked box to us. Nevertheless, the behavioural aspect of the two definitions remains consistent whereby animal personality is broadly defined as “consistent variation in behavioural traits between individuals”3.

Although I am an early career marine mammal ecologist finding my footing in this rapidly expanding field, I have a keen interest in teasing apart possible cases of individual specialisation within marine mammal populations. So, before getting straight into the nitty gritty of individual specialisation, it is important for me to take a small step back and consider the concept of specialisation as applied to small subgroups or populations of marine mammals.

Specialisations are mostly related to foraging or feeding behaviour whereby a subgroup of individuals will develop a novel method to locate and capture prey. These behaviours have been reported for several marine mammal species, and are strongly coupled to intra and inter-specific competition with other predators for prey and habitat characteristics. Furthermore, it is posited that factors such as resource benefits (e.g. energy content of prey), prey escape rates, and handling times can be minimised if specialisation for a particular prey type or habitat occurs4.

In Florida Bay, Torres & Readdocumented two distinct foraging strategies employed by two bottlenose dolphin ecotypes. One dolphin ecotype was found to forage using deep diving with erratic surfacings, whereas the second ecotype chose to forage through mud ring feeding and were mostly seen in shallow habitats. The latter ecotype is in fact so adapted to shallow depths that dolphins were typically observed foraging in waters <2 m deep. In this example, the foraging tactics of the two ecotypes are strongly driven by habitat conditions, specifically depth. The video below is aerial footage of bottlenose dolphins performing mud ring feeding.

Such group specialisations have been identified not only in several other bottlenose dolphin populations around the world6,7, but also in other cetacean species, including killer whales (distinct differences in target prey between transients and residents8), Guiana dolphins (mud-plume feeding9), humpback dolphins (strand feeding10), and several others. Noticeable here is that these records concern Odontocete species, which is not surprising since these toothed whales are vastly different to baleen whales in that they often live in structured groups with bonds between individuals sometimes lasting for decades11. Long-term relationships are conducive to developing specialised group hunting strategies as individuals will spend considerable time with one another and the success of obtaining prey depends on the cooperation and coordination of the group.

For baleen whales and other marine mammals, such as pinnipeds, where life history and social organisation is more geared toward a solitary life, examples of group specialisations are relatively rare (with the exception of the well-documented bubble-net feeding exhibited by humpback whales12). While group specialisation may not be as prevalent in Mysticetes, the same problems of inter and intra-specific competition persists among these more solitary species too, which would suggest that individuals should develop their own unique foraging tactics and preferences. Evidence for individualisation is hard to obtain since it requires repeated observations of the same individuals over time with good knowledge of the prey type being consumed and/or the habitat being used to forage in.

Nevertheless, examples do exist. Perhaps the most well-documented case of individualisation within a population for marine mammals is of the sea otter. Estes et al. (2003) describe 10 female sea otters in Monterey Bay that had high inter-individual variation in diet, which they investigated over a scale of 8 years13. Most females specialised on 1-4 types of prey, with marked differences between the diets chosen by each female, despite habitat overlap. This individualisation of diet was not attributable to variation in prey availability; hence, authors concluded that this extreme specialisation occurred to reduce intra-population competition for prey.

Ecologists have historically (and probably still to this day) disagreed on whether individualisation actually matters in the grand scheme of things. There are generally three schools of thought on the matter: (1) individual specialisation is rare and/or weakly influences population dynamics and so is not very important; (2) while individual specialisation does occur and may in fact be commonplace, it does not affect ecological processes at the large population scale; and (3) individual specialisation is widespread and can significantly impact population dynamics and/or ecosystem function.

As you might have guessed by this point, I find myself in the third school of thought. There are many arguments supporting this theory, and what I believe to be very good arguments against statements 1 and 2. While I have only provided one specific named example for individual specialisation in a marine mammal, there are several documented cases of such occurrences among other marine taxa (e.g., pinnipeds14, sharks15, fish16) and a much larger number of studies for terrestrial species4. Thus, the claim that it is rare or weak, seems implausible to me.

Statement 2 is a little more complicated to tackle as it involves understanding how actions on a relatively small scale affect a whole population or even an ecosystem. For instance, consider two female sea otters living in a small coastal area where one sea otter prefers to eat turban snails and the other exclusively feeds on abalone. The sudden decline in abundance of either of these prey could lead to serious health and reproductive issues for those females. Should the low prey abundance persist, then poor health and reproduction of several females in a population that specialise on that prey item can rapidly lead to genetic loss and an overall population decline. Particularly if an individual’s or species’ home range is rather restricted or small. In the case of the sea otter, which are often touted as a keystone species due to its presence preventing sea urchin barren formation that is known to wreak havoc on kelp forests, knock-on effects of such a population decline could result in poor overall ecosystem health.

It may be easy to assume that one individual dolphin, otter, seal or whale cannot possibly make a difference to a whole population or ecosystem. This assumption strikes me as a little odd since humans are always told to ‘be the change they wish to see in the world’ and that ‘every person can make a difference’. Why then should these sentiments not be applicable to non-humans? While a gray whale may not hold a sign at a protest or run for president (actions commonly considered to cause change in the human world), perhaps the choice that a gray whale makes every day to only consume one species of zooplankton, can influence other gray whales in the area, predators from other taxa, habitat structure, other prey availability, and/or cause trophic cascades.

Through my research, I aim to elucidate whether the gray whales display some level of foraging individualisation while feeding in Port Orford, Oregon. I will use data from four years to compare tracks of individual whales with zooplankton samples collected in the area to correlate each individual’s movement patterns with prey availability. I will assess the quality of prey through bomb calorimetry and microplastic analysis of the zooplankton samples to determine energetic content and pollutant levels, respectively. This prey assessment will describe the potential effects of prey specialization on whales, which is fundamental to assessing overall population health. Individualisation can strongly affect fitness of individuals, either positively or negatively depending on several factors, which will undoubtedly have an impact at the population level.

(The videos below are examples of two different tactics we see the gray whales display while foraging along the Oregon coast in the summer months. The first video shows a whale foraging among kelp with some very acrobatic moves, while the second is of a whale employing the ‘sharking’ method where the whale is feeding benthically in such shallow depths that both the pectoral fin and the fluke stick out of the water, making the whale look like a ‘shark’.)

References

  1. American Psychological Association, Personality. Retrieved from: https://www.apa.org/topics/personality/.
  2. Carere C., & Locurto, C., Interaction between animal personality and animal cognition. Current Zoology, 2015. 57(4): 491-498.
  3. Gosling, S.D., From mice to men: what can we learn about personality from animal research?Psychological Bulletin, 2001. 127(1): 45-86.
  4. Bolnick, D.I., et al., The ecology of individuals: incidence and implications of individual specialisation. The American Naturalist, 2003. 161(1): 1-28.
  5. Torres, L.G., & Read, A. J., Where to catch a fish? The influence of foraging tactics on the ecology of bottlenose dolphins (Tursiops truncatus) in Florida Bay, Florida. Marine Mammal Science, 2009. 25(4): 797-815.
  6. Gisburne, T.J., & Connor, R.C., Group size and feeding success in strand-feeding bottlenose dolphins (Tursiops truncatus) in Bull Creek, South Carolina. Marine Mammal Science, 2015. 31(3): 1252-1257.
  7. Gazda, S.K., et al., A division of labour with role specialization in group-hunting bottlenose dolphins (Tursiops truncatus) off Cedar Keys, Florida.Proceedings of the Royal Society: Biological Sciences, 2005. 272(1559): 135-140.
  8. Ford, J.K.B., et al., Dietary specialization in two sympatric populations of killer whales (Orcinus orca) in coastal British Columbia and adjacent waters. Canadian Journal of Zoology, 1998. 76(8): 1456-1471.
  9. Rossi-Santos, M.R., & Wedekin, L.L., Evidence of bottom contact behaviour by estuarine dolphins (Sotalia guianensis) on the Eastern Coast of Brazil.Aquatic Mammals, 2006. 32(2): 140-144.
  10. Peddemors, V.M., & Thompson, G., Beaching behaviour during shallow water feeding by humpback dolphins (Sousa plumbea). Aquatic Mammals, 1994. 20(2): 65-67.
  11. Tyack, P., Population biology, social behavior and communication in whales and dolphins. Trends in Ecology & Evolution, 1986. 1(6): 144-150.
  12. Wiley, D., et al., Underwater components of humpback whale bubble-net feeding behaviour.Behaviour, 2011. 148(5/6): 575-602.
  13. Estes, J.A., et al., Individual variation in prey selection by sea otters: patterns, causes and implications. Journal of Animal Ecology, 2003. 72(1): 144-155.
  14. Cherel, Y., et al., Stable isotopes document seasonal changes in trophic niches and winter foraging individual specialization in diving predators from the Southern Ocean. Journal of Animal Ecology, 2007. 76(4): 826-836.
  15. Matich, P., et al., Contrasting patterns of individual specialization and trophic coupling in two marine apex predators. Journal of Animal Ecology, 2010. 80(1): 294-305.
  16. Svanbäck, R., & Persson, L., Individual diet specialization, niche width and population dynamics: implications for trophic polymorphisms. Journal of Animal Ecology, 2004. 73(5): 973-982.

The Beauty of Scientific Conferences

By Lisa Hildebrand, MSc student, OSU Department of Fisheries and Wildlife, Geospatial Ecology of Marine Megafauna Lab

Science is truly meaningful because it is shared amongst colleagues and propagated to the wider public. There are many mediums through which information dissemination can occur. A common and most rigorous form is the peer-review scientific publication of papers. The paper approval process is vigorous, can last a long time – sometimes on the scale of several years – and is therefore an excellent way of vetting science that is occurring all over the world in many different disciplines. New studies build upon the results and downfalls of others, and therefore the process of research and communication of knowledge is continuous.

However, scientific journals and the publications within them can be quite exclusive; they are often only accessible to certain members of the scientific community or of an educational institution. For a budding scientist who is not affiliated with an institution, it can be very hard to get your hands on current research. Having said that, this issue is slowly becoming inconsequential since open access and free journals, such as PeerJ, are becoming more prevalent.

How some students feel after reading scientific publications. Source: Know Your Meme.

Something that is perhaps more restrictive is the amount of topic-specific jargon used in publications. While a certain degree of jargon is to be expected, it can sometimes overwhelm a reader to the point where the main findings of the research become lost. This typically tends to be the case for those just at the beginning of their scientific journeys, however I have also known professors to comment on confusing sections of publications due to the heavy use of specific jargon.

Conferences on the other hand offer an opportunity to disseminate meaningful science in a more open and (sometimes) more laid-back setting (this may not always be true depending on the field of science and the calibre of the conference). Researchers of a particular field congregate for a few days to learn about current research efforts, ponder potential collaborations, peruse posters of new studies, and argue over which soccer team is going to win the next World Cup. That is the beauty of conferences – it is very possible to get to know each other on a personal level. These face-to-face opportunities are especially beneficial to students as this relaxed atmosphere lends itself to asking questions and engaging with scientists that are leaders in their fields.

Logo for the Marine Technology Summit. Source: MTS.

Just over a week ago, the GEMM Lab had the opportunity to do all of the above-mentioned things. PI Dr Leigh Torres and I participated in the Marine Technology Summit (MTS) in Newport, OR, a “mini-conference” at which shiny, new technologies for use in marine applications were introduced by leading, and many local, tech companies. While Leigh and I are not technologists, we are ecologists that have greatly benefitted from recent, rapid advances in technology. Both of our gray whale (Eschrichtius robustus) research projects use different technologies to unveil hitherto unknown ecological aspects of these marine mammals.

Leigh presented her research that involves flying drones over gray whales that grace the Oregon coastal waters in the spring and summer. Through these flights, many previously undocumented gray whale behaviours have been captured and quantified1, such as headstands, nursing and jaw snapping (check out the video below). Furthermore, still images from the videos have been used to perform photogrammetry to assess health and body condition of the whales2. These drone flights have added a wealth of valuable data to the life histories of individual whales that previously were assessed mainly through photo-identification and genetics. This still fairly new approach to assess health by using drones can be relatively cost-effective, which has always been one of Leigh’s key aims throughout her research so that methods are accessible to many scientists. These productive drones used by the GEMM Lab are commercially available (yup, just like the ones you see on the shelves at your local Best Buy!).

The use of cost-effective technologies is a common theme in the GEMM Lab and is also central to my research. The estimation of zooplankton density is vital to my project to determine whether gray whales in Port Orford select areas of high prey density over areas with less dense prey. However, the traditional technology used to quantify prey densities in the water column are often bulky or expensive. Instead, we developed a relatively cheap method of measuring relative zooplankton density using a GoPro camera that we reel down through the water column from a downrigger attached to our research kayak. While we are unable to exactly quantify the mass of zooplankton in the water column, we have been successful in assessing changes in relative prey density by scoring screenshots of the footage.

Screenshot of a GoPro video from this summer’s field season in Port Orford, OR revealing a thick layer of zooplankton. Source: GEMM Lab.

While our drones and GoPro technology is not without error, technology rarely is. In truth, we lost our GoPro for several days after it became stuck in a rock crevice and Leigh’s team regrettably lost a drone to the depths of the ocean this summer. This technology reality was part of the reason I presented at the MTS as I wanted to involve technologists to find solutions to some of the problems I have experienced. Needless to say, I got a lot of excellent input from many different people, for which I am very grateful. In addition to developing new opportunities to collaborate, I was very content to sit in the audience and hear about the ground-breaking new marine technologies that are in development. Below are short descriptions of two new technologies I learned about that are revolutionising the marine world.

ASV Unmanned Marine Systems develop autonomous surface vehicles that are powered by renewable energies (solar panels and wind turbines). These vessels are particularly useful for oceanographic monitoring as they are more capable than weather buoys and much more cost effective than manned weather ships or research vessels. Additionally, they can be used for a lot of different marine science applications including active acoustic fisheries monitoring, water quality monitoring, and cetacean tracking. Some models even have integrated drones that are launched and retrieved autonomously.

The Ocean Cleanup is a company that develops technologies to clean garbage out of our oceans. There is presently a large mission underway by The Ocean Cleanup to combat the Great Pacific Garbage Patch (GPGP). The GPGP is essentially a large island in the middle of the North Pacific Ocean comprised of diverse plastic particles – wrappers, polystyrene, fishing line, plastic bags, the list is endless3. A recent study estimates the amount of plastic in the GPGP to be at least 79 thousand tonnes of ocean plastic4. Unfortunately, the GPGP is not the only one of its kind. The Ocean Cleanup hopes to reduce this massive plastic accumulation with the development of a system made up of a 600-m long floater that sits on the ocean’s surface with a 3-m deep skirt attached below it. The skirt will collect debris while the float will prevent plastic from flowing over it, as well as keep the whole system afloat. The system arrived at the GPGP last Wednesday and the team of over 80 engineers, researchers, scientists and computational modellers have successfully installed the system. The team posts frequent updates on their Twitter and I would highly recommend you follow this possibly revolutionary technology.

While attending the MTS, it felt like there are no bounds for the types of marine technology that will be developed in the future. I am excited to see what ecologists working with technicians can develop to keep applying technology to address challenging questions and conservation issues.


References

  1. Torres, L., et al., Drone up! Quantifying whale behaviour from a new perspective improves observational capacity.Frontiers in Marine Science, 2018. 5, DOI:10.3389/fmars.2018.00319.
  2. Burnett, J.D., et al., Estimating morphometric attributes on baleen whales using small UAS photogrammetry: A case study with blue and gray whales, 2018.Marine Mammal Science. DOI:10.1111/mms.12527.
  3. Kaiser, J., The dirt on the ocean garbage patches. Science, 2018. 328(5985): p. 1506.
  4. Lebreton, L., et al., Evidence that the Great Pacific Garbage Patch is rapidly accumulating plastic. Scientific Reports, 2018. 8(4666).

Remote Sensing Applications

By Leila Lemos, PhD candidate

Fisheries and Wildlife Department, OSU


I am finally starting my 3rd and last year of my PhD. Just a year left and yet so many things to do. As per department requirements, I still need to take some class credits, but what classes could I take? In this short amount of time it is important to focus on my research project and on what could help me better understand the many branches of the project and what could improve my analyses. Thinking of that, both my advisor (Dr. Leigh G. Torres) and I agreed that it would be useful for me to take a class on remote sensing. So, I could learn more about this field, as well as try to include some remote sensing analyses in my project, such as sea surface temperature (SST) and chlorophyll (i.e., as a productivity indicator) conditions over the years we have collected data on gray whales off the Oregon coast.


Our photogrammetry data indicates that whales gradually increased their body condition over the feeding seasons of 2016 and 2018, while 2017 is different. Whales were still looking skinny in the middle of the season, and we were not collecting many fecal samples up to that point (indicating not much feeding). These findings made us wonder if this was related to delayed seasonal upwelling events and consequently low prey availability. These questions are what motivated me the most to join this class so that we might be able to link environmental correlates with our observations of gray whale body condition.

Figure 01: Skinny body condition state of the gray whale “Pancake” in August 2017.
Source: Leila S. Lemos


If we stop to think about what remote sensing is, we have already been implementing this method in our project since the beginning, as my favorite definition for remote sensing is “the art of collecting information of objects or phenomenon without touching it”. So, yes, the drone is a type of sensor that remotely collects information of objects (in this case, whales).

Figure 02: Drone remotely collecting information of a whale in September 2018. Drone in detail. Collected under NOAA/NMFS permit #16111.
Source: Leila Lemos


However, satellites, all the way up in the space, are also remotely sensing the Earth and its objects and phenomena. Even from thousands of km above Earth, these sensors are capable of generating a great amount of detailed data that is easily and freely accessible (i.e., NASA, NOAA), and can be used for multiple applications in different fields of study. Satellites are also able to collect data from remote areas like the Antarctica and the Arctic, as well as other areas that are not easily reached by humans. One important application of the use of satellite imagery is wildlife monitoring.

For example, satellite data was used to detect variation in the abundance of Weddell seals (Leptonychotes weddellii) in Erebus Bay, Antarctica (LaRue et al., 2011). Because this is a well-studied seal population, the object of this study was to test if satellite imagery could produce reliable abundance estimates. The authors used high-resolution (0.6 m) satellite imagery (from satellites Quick-Bird-2 and WorldView-1) to compare counts from the ground with counts from satellite images in the same locations at the same time. This study demonstrated a reliable methodology for further studies to replicate.

Figure 03: WorldView-1 image (0.6 m resolution) of Weddell seals hauled out east of Inaccessible Island, Erebus Bay, Antarctica.
Source: LaRue et al. (2011).


Satellite imagery was also applied to estimate colony sizes of Adélie penguins in Antarctica (LaRue et al., 2014). High-resolution (0.6 m) satellite imagery combined with spectral analysiswas used to estimate the sizes of the penguin breeding colonies. Ground counts were also used in order to check the reliability of the applied method. The authors then created a model to predict the abundance of breeding pairs as a function of the habitat, which was identified terrain slope as an important component of nesting density.

The identification of whales using satellite imagery is also possible. Fretwell et al. (2014)pioneered this method by successfully identifing Southern Right Whales (Eubalaena australis) in the Golfo Nuevo, Península Valdés, in Argentina in satellite images. By using very high-resolution satellite imagery (50 cm resolution) and a water penetrating coastal band that was able to see deeper into the water column, the researchers were able to successfully identify and count the whales (Fig. 04). The importance of this study was very significant, since this species was extensively hunted from the 17ththrough to the 20thcentury. Since then, the species has shown a strong recovery, but population estimates are still at <15% of historical estimates. Thus, being able to use new tools to identify, count and monitor individuals in this recovering population is a great development, especially in remote and hard to reach areas.

Figure 04: Identification of Southern Right Whales by using imagery from the WorldView2 satellite in the Golfo Nuevo Bay, Península Valdés, Argentina.
Source: Fretwell et al. (2014).


Polar bears (Ursus maritimus) have also been studied in the Foxe Basin, in Nunavut and Quebec, Canada (LaRue et al., 2015). Researchers used high-resolution satellite imagery in an attempt to identify and count the bears, but spectral signature differences between bears and other objects were insufficient to yield useful results. Therefore, researchers developed an automated image differencing, also known as change detection, that identifies differences between remotely sensed images collected at different times and “subtract of one image from another”. This method correctly identified nearly 90% of the bears. The technique also generated false positives, but this problem can be corrected by a manual review.

Figure 05 shows the difference in resolution of two types of satellite imagery, the panchromatic (0.6 m resolution) and the multispectral (2.4 m resolution). LaRue et al. (2015)decided not to use the multispectral imagery due to resolution constraints.

Figure 05: Polar Bears on panchromatic (0.6 m resolution) and multispectral (2.4 m resolution) imagery.
Source: LaRue et al. (2015).


A more recent study is being conducted by my fellow OSU Fisheries and Wildlife graduate student, Jane Dolliveron breeding colonies of three species of North Pacific albatrosses (Phoebastria immutabilis, Phoebastria nigripes, and Phoebastria albatrus)(Dolliver et al., 2017). Jane is using high-resolution multispectral satellite imagery (DigitalGlobe WorldView-2 and -3) and image processing techniques to enumerate the albatrosses. They are also using albatross species at multiple reference colonies in Hawaii and Japan (Fig. 06) to determine species identification accuracy and required correction factor(s). This will allow scientists to accurately count unknown populations on the Senkakus, which are uninhabited islands controlled by Japan in the East China Sea.

Figure 06: Satellite image of a colony of short-tailed albatrosses (Phoebastria albatrus) in Torishima, Japan, 2016.
Source: Satellite image provided by Jane Dolliver.


Using satellite imagery to count seals, penguins, whales, bears and albatrosses is just the start of this rapidly advancing technology. Techniques and resolutions are continuously improving. Methods can also be applied to many other endangered species, especially in remote areas, providing data on presence, abundance, annual productivity, population estimates and trends, changes in distribution, and breeding ground usage.

Other than directly monitoring wildlife, satellite images can also provide information on the environmental variables that can be related to wildlife presence, abundance, productivity and distribution.

Gentemann et al. (2017), for example, used satellite data from NASA to analyze SST variations along the west coast of the United States from 2002 to 2016. The NASA Jet Propulsion Laboratory produces global, daily, 1 km, multiscale ultra-high resolution, motion-compensated analysis of SST, and incorporates SSTs from eight different satellites. Researchers were able to identify warmer than usual SSTs (also called anomalies) along the Washington, Oregon, and California coasts from January 2014 to August 2016 (Fig.07) relative to previous years. This marine heat wave started in the Gulf of Alaska and ended in Southern California, where SST reached a maximum temperature anomaly of 6.2°C, causing major disturbances and substantial economic impacts.

Figure 07: Monthly SST anomalies in the West Coast of United States, from January 2014 to August 2016.
Source: Gentemann et al. (2017).


Changes in SST and winds may alter events such as the coastal upwelling that supplies nutrients to sustain a whole food chain. A marine heat-wave event as described by Gentemann et al. (2017)could have significant impacts on the health of the marine ecosystem in the subsequent season (Gentemann et al., 2017).

These findings may even relate to our questions regarding the poor gray whale body condition we noticed in 2017: this marine heat wave that lasted until August 2016 along the US west coast could have impacted the ecosystem in the subsequent season. However, I must conduct a more detailed study to determine if this heat wave was related or if another oceanographic process was involved.

So, whether remotely sensed data is generated by satellites, drones, thermal imagery, robots (as I previously wrote about), or another type of technology, it can have important  and informative applications to monitor wildlife or environmental variables associated with their ecology and biology. We can take advantage of remotely sensed technology to aid wildlife conservation efforts.


References

Dolliver, J., et al., Multispectral processing of high resolution satellite imagery to determine the abundance of nesting albatross. Ecological Society of America, Portland, OR, United States., 2017.

Fretwell, P. T., et al., 2014. Whales from Space: Counting Southern Right Whales by Satellite. Plos One. 9,e88655.

Gentemann, C. L., et al., 2017. Satellite sea surface temperatures along the West Coast of the United States during the 2014–2016 northeast Pacific marine heat wave. Geophysical Research Letters. 44,312-319.

LaRue, M. A., et al., 2014. A method for estimating colony sizes of Adélie penguins using remote sensing imagery. Polar Biology. 37,507-517.

LaRue, M. A., et al., 2011. Satellite imagery can be used to detect variation in abundance of Weddell seals (Leptonychotes weddellii) in Erebus Bay, Antarctica. Polar Biology. 34,1727–1737.

LaRue, M. A., et al., 2015. Testing Methods for Using High-Resolution Satellite Imagery to Monitor Polar Bear Abundance and Distribution. Wildlife Society Bulletin. 39,772-779.


A Summer of “Firsts” for Team Whale Storm

By Lisa Hildebrand, MSc student, OSU Department of Fisheries and Wildlife, Geospatial Ecology of Marine Megafauna Lab

To many people, six weeks may seem like a long time. Counting down six weeks until your favourite TV show airs can feel like time dragging on slowly (did anyone else feel that way waiting for Blue Planet II to be released?). Or crossing off the days on your calendar toward that much-needed holiday that is still six weeks away can feel like an eternity. It makes sense that six weeks should feel like a long time. After all, six weeks are approximately a ninth of an entire year. Yet, I can assure you that if you asked anyone on my research team this summer whether six weeks was a long time, they would all say no.

As I watched each of my interns present our research to a room of 50 engaged community members (Fig. 1) after our six week research effort, I couldn’t help but feel an overwhelming sense of pride for all of them at how far they had come during the course of the field season.

Figure 1. Our audience at the community presentation on August 31. Photo by Leigh Torres.

On the very first day of our two-week training back in July, I gave my team an introductory presentation covering gray whales, their ecology, what the next six weeks would look like, how this project had developed and its results to date (Quick side-note here: I want to give a huge shout out to Florence and Leigh as this project would not be what it is today without their hard work and dedication as they laid the groundwork for it three years ago and have continued to improve and expand it). I remember the looks on my interns’ faces and the phrase that comes to mind is ‘deer in headlights’. It isn’t surprising that this was the case as this internship was the first time any of them had done marine mammal field work, or any kind of field work for that matter. It makes me think back to my first taste of field work. I was a fresh high school graduate and volunteering with a bottlenose dolphin research group. I remember feeling out of place and unsure of myself, both in terms of data collection skills but also having to live with the same people I had worked with all day. But as the first few days turned into the first few weeks, I grew into my role and by the end of my time there, I felt like an expert in what I was doing. Based on the confidence with which my interns presented our gray whale foraging ecology research to an audience just over a week ago, I know that they too had become experts in these short six weeks. Experts in levelling a theodolite, in sighting a blow several kilometres out from our cliff site, in kayaking in foggy conditions, in communicating effectively in high stress situations – the list goes on and on.

While you may have read the previous blog posts written by each of my interns in the last four weeks and thus have a sense of who they are, I want to tell you a little more about each of these hardworking undergraduates that played a large role in making this year’s Port Orford gray whale season so effective. Although we did not have any local high school interns this year, the whole team hails from Oregon, specifically from Florence, Sweet Home and Portland.

Figure 2. Haley on the cliff equipped with the camera waiting for a whale to surface. Photo by Cynthia Leonard.

Haley Kent (Fig. 2), my co-captain and Marine Studies Initiative (MSI) intern, an Environmental Science major, is going into her senior year at OSU this fall. She is focused and driven, which I know will enable her to pursue her dream of becoming a shark researcher (I can’t even begin to describe her excitement when we saw the thresher shark on our GoPro video). I couldn’t have asked for a better right hand person for my first year taking over this project and I am excited to see what results she will reveal through her project of individual gray whale foraging preferences. Also, Haley has a big obsession for board games and provided the team with many evenings of entertainment thanks to Munchkin and King of Tokyo.

Figure 3. Dylan in the stern of the kayak on a foggy day reeling down the GoPro stick on the downrigger. Photo by Haley Kent.

Dylan Gregory (Fig. 3) is transferring from Portland Community College and is going to be an OSU junior this fall. Not only was Dylan always extremely helpful in working with me to come up with ways to troubleshoot or fix gear, but his portable speaker and long list of eclectic podcasts always made him a very good cliff team partner. He was also Team Whale Storm’s main chef in the kitchen, and while some of his dishes caused tears & sweat among some team members (Dylan is a big fan of spices), there were never any leftovers, indicating how delicious the food was.

Figure 4. Robyn on one of our day’s off visiting the gigantic Redwoods in California. Photo by Haley Kent.

Robyn Norman (Fig. 4) will be a sophomore at OSU this fall and her commitment to zooplankton identification has been invaluable to the project. Last year when she was a freshman, Robyn was given our zooplankton samples from 2017, a few identification guides and instructions on how to use the dissecting microscope, before she was left to her own devices. Her level of independence and dedication as a freshman was incredible and I am very grateful for the time and skills she has given to this work. Besides this though, Robyn always brought an element of happiness to the room and I can speak on behalf of the rest of the team, that when she was gone for a week on a dive trip, the house did not feel the same without her.

Figure 5. Hayleigh Middleton at the community presentation. Her dry humour and quips earned her a lot of laughter from the audience keeping them entertained. Photo by Tom Calvanese.

Hayleigh Middleton (Fig. 5), a fresh high school graduate and freshly turned 18 during the project, is starting as a freshman at OSU this fall. She is extremely perceptive and would (thankfully) often remind others of tasks that they had forgotten to do (like take the batteries out of the theodolite or to mention the Secchi depth on the GoPro videos). I was very impressed by Hayleigh’s determination to continue working on the kayak despite her propensity for sea sickness (though after a few days we did remedy this by giving her raw ginger to chew on – not her favourite flavour or texture but definitely very, very effective!). She is inquisitive about almost everything and I know she will do very well in her first year at OSU.

Thank you, Team Whale Storm (Fig. 6), for giving me six weeks of your summer and for making my first year as project leader as seamless as it could have been! Without each and every one of you, I would not have been able to survey for 149.2 hours on the cliff, collect over 300 zooplankton samples, identify 31 gray whales, or launch a tandem kayak at 6:30 am every morning.

Figure 6. Team Whale Storm. Back row, from left to right: Haley Kent, Robyn Norman, Hayleigh Middleton, Dylan Gregory. Front row, from left to right: Tom Calvanese, Dr. Leigh Torres, Lisa Hildebrand. Photo by Mike Baran.

My interns were not the only ones to experience many “firsts” during this field season. I learned many new things for the first time right alongside them. While taking leadership is not a foreign concept to me, these six weeks were my first real experience of leading a project and a team for a sustained period of time. Managing teams, delegating tasks and compiling data felt gratifying because I felt like I was exactly where I should be (Fig. 7).

Figure 7. From left to right: Tom, myself, Hayleigh & Dylan on the cliff site looking for whales. Photo by Leigh Torres.
Figure 8. Haley & I on a cold evening out on the water but very excited to have gotten back the GoPro stick retrieved by divers after it had been stuck in a crevice for over 5 days. Photo by Lisa Hildebrand.

I dealt with many daunting tasks, yet thanks to the support of my interns, as well as Tom (Port Orford field station’s incredible station manager), Florence and Leigh, I learned how to resolve my problems: I fixed and replaced broken or lost gear (I am not a very mechanically inclined person; Fig. 8), budgeted food for five hungry people doing tiring field work (I’ve only ever budgeted for one person previously), and taught people how to use gear that I had not often used before (I can say now that the theodolite and I are friends, but this wasn’t the case for the first few weeks…).


Figure 9. Me with all the gear packed into the truck ready to leave Port Orford after the end of the field season. Photo by Haley Kent.

In the lead up to the summer field season this year, Leigh said to me, in one of the many emails we exchanged, that leading the project was a big task but that it was just six weeks long. She suggested that I rest up and get organised as much as I could ahead of time because, after all, the data collected this summer was going to be my thesis data, so I would want it to be as good as possible. Looking back, she couldn’t have been more right – the six weeks simply flew by, I did need the rest she had advised, and it definitely was a big task. I can’t wait for it to happen all over again next summer.