Keeping it simple: A lesson in model construction

By: Kate Colson, MSc Student, University of British Columbia, Institute for the Oceans and Fisheries, Marine Mammal Research Unit

Models can be extremely useful tools to describe biological systems and answer ecological questions, but they are often tricky to construct. If I have learned anything in my statistics classes, it is the importance of resisting the urge to throw everything but the kitchen sink into a model. However, this is usually much easier said than done, and model construction takes a lot of practice. The principle of simplicity is currently at the forefront of my thesis work, as I try to embody the famous quote by Albert Einstein:

 “Everything should be made as simple as possible, but no simpler.”

As you might remember from my earlier blog, the goal of my thesis is to use biologging data to define different foraging behaviors of Pacific Coast Feeding Group (PCFG) gray whales, and then calculate the energetic cost of those behaviors. I am defining PCFG foraging behaviors at two scales: (1) dives that represent different behavior states (e.g., travelling vs foraging), and (2) roll events, which are periods during dives where the whale is rolled onto their side, that represent different foraging tactics (e.g., headstanding vs side-swimming).

Initially, I was planning to use a clustering analysis to define these different foraging behaviors at both the dive and roll event scale, as this method has been used to successfully classify different foraging strategies for Galapagos sea lions (Schwarz et al., 2021). In short, this clustering analysis uses summary variables from events of interest to group events based on their similarity. These can be any metric that describes the event such as duration and depth, or body positioning variables like median pitch or roll. The output of the clustering analysis method results in groups of events that can each be used to define a different behavior.

However, while this method works for defining the foraging tactics of PCFG gray whales, my discussions with other scientists have suggested that there is a better method available for defining foraging behavior at the dive scale: Hidden Markov Models (HMMs). HMMs are similar to the clustering method described above in that they use summary variables at discrete time scales to define behavior states, but HMMs take into account the bias inherent to time series data – events that occur closer together in time are more likely to be more similar. This bias of time can confound clustering analyses, making HMMs a better tool for classifying a series of dives into different behavior states.

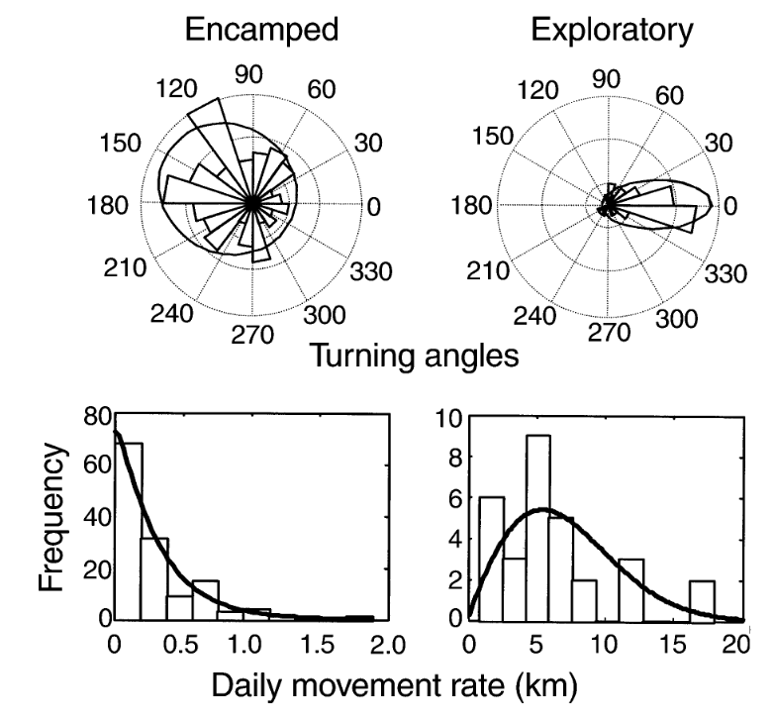
Like many analytical methods, the HMM framework was first proposed in a terrestrial system where it was used to classify the movement of translocated elk (Morales et al., 2004). The initial framework proposed using the step length, or the spatial distance between the animal’s locations at the start of subsequent time intervals, and the corresponding turning angle, to isolate “encamped” from “exploratory” behaviors in each elk’s movement path (Figure 1, from Morales et al., 2004). “Encamped” behaviors are those with short step lengths and high turning angles that show the individual is moving within a small area, and they can be associated with foraging behavior. On the other hand, “exploratory” behaviors are those with long step lengths and low turning angles that show the individual is moving in a relatively straight path and covering a lot of ground, which is likely associated with travelling behavior.

Figure 1. The difference between “encamped” and “exploratory” behavior states from a simple Hidden Markov Model (HMM) in a translocated elk equipped with a GPS collar (Fig. 1 in Morales et al., 2004). The top rose plots show the turning angles while the bottom histograms show the step lengths as a daily movement rate. The “encamped” state has short step lengths (low daily movement rate) and high turning angles while the “exploratory” state has long step lengths (high daily movement rate) and low turning angle. These behavior states from the HMM can then be interpollated to elk behavior, as the low daily movement and tight turns of the “encamped” behavior state likely indicates foraging while the high daily movement and direct path of the “exploratory” behavior state likely indicates traveling. Thus, it is important to keep the biological relevance of the study system in mind while constructing and interpreting the model.

In the two decades following this initial framework proposed by Morales et al. (2004), the use of HMMs in anlaysis has been greatly expanded. One example of this expansion has been the development of mutlivariate HMMs that include additional data streams to supplement the step length and turning angle classification of “encamped” vs “exploratory” states in order to define more behaviors in movement data. For instance, a multivariate HMM was used to determine the impact of acoustic disturbance on blue whales (DeRuiter et al., 2017). In addition to step length and turning angle, dive duration and maximum depth, the duration of time spent at the surface following the dive, the number of feeding lunges in the dive, and the variability of the compass direction the whale was facing during the dive were all used to classify behavior states of the whales. This not only allowed for more behavior states to be identified (three instead of two as determined in the elk model), but also the differences in behavior states between individual animals included in the study, and the differences in the occurrence of behavior states due to changes in environmental noise.

The mutlivariate HMM used by DeRuiter et al. (2017) is a model I would ideally like to emulate with the biologging data from the PCFG gray whales. However, incorporating more variables invites more questions during the model construction process. For example, how many variables should be incorporated in the HMM? How should these variables be modeled? How many behavior states can be identified when including additional variables? These questions illustrate how easy it is to unnecessarily overcomplicate models and violate the principle of simiplicity toted by Albert Einstein, or to be overwhelmed by the complexity of these analytical tools.

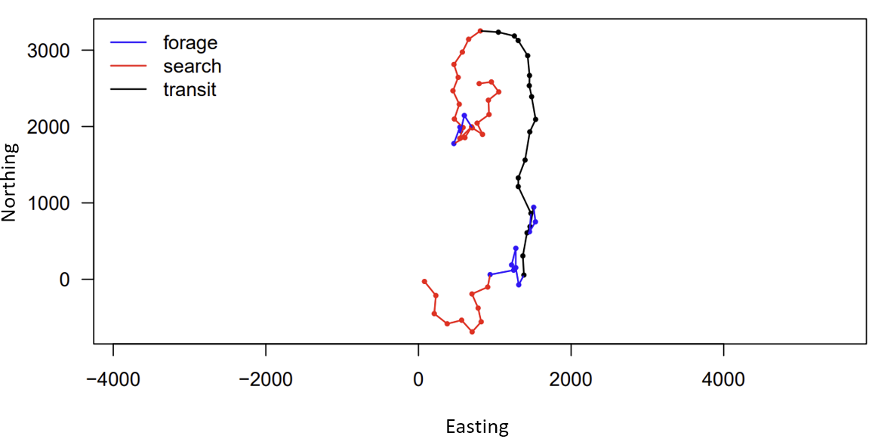
Figure 2. Example of expected output of Hidden Markov Model (HMM) for the PCFG gray whale biologging data (GEMM Lab; National Marine Fisheries Service (NMFS) permit no. 21678). The figure shows the movement track the whale swam during the deployment of the biologger, with each point representing the start of a dive. The axes show “Easting” and “Northing” rather than map coordinates because this is the relative path the whale took rather than GPS coordinates of the whale’s location. Each color represents a different behavior state—blue has short step lengths and high turning angles (likely foraging), red has intermediate step lengths and turning angles (likely searching), and black has long step lengths and low turning angles (likely transiting). These results will be refined as I construct the multivariate HMM that will be used in my thesis.  

Luckily, I can draw on the support of Gray whale Response to Ambient Noise Informed by Technology and Ecology (GRANITE) project collaborators Dr. Leslie New and Dr. Enrico Pirotta to guide my HMM model construction and assist in interpreting the outputs (Figure 2). With their help, I have been learning the importance of always asking if the change I am making to my model is biologically relevent to the PCFG gray whales, and if it will help give me more insight into the whales’ behavior. Even though using complex tools, such as Hidden Markov Models, has a steep learning curve, I know that this approach is not only placing this data analysis at the cutting edge of the field, but helping me practice fundamental skills, like model construction, that will pay off down the line in my career.

Loading

Sources

DeRuiter, S. L., Langrock, R., Skirbutas, T., Goldbogen, J. A., Calambokidis, J., Friedlaender, A. S., & Southall, B. L. (2017). A multivariate mixed Hidden Markov Model for blue whale behaviour and responses to sound exposure. Annals of Applied Statistics, 11(1), 362–392. https://doi.org/10.1214/16-AOAS1008

Morales, J. M., Haydon, D. T., Frair, J., Holsinger, K. E., & Fryxell, J. M. (2004). Extracting more out of relocation data: Building movement models as mixtures of random walks. Ecology, 85(9), 2436–2445. https://doi.org/10.1890/03-0269

Schwarz, J. F. L., Mews, S., DeRango, E. J., Langrock, R., Piedrahita, P., Páez-Rosas, D., & Krüger, O. (2021). Individuality counts: A new comprehensive approach to foraging strategies of a tropical marine predator. Oecologia, 195(2), 313–325. https://doi.org/10.1007/s00442-021-04850-w

The final chapter:  “The effects of vessel traffic and ocean noise on gray whale stress hormones”

By Leila S. Lemos, Ph.D., Postdoctoral Associate at Florida International University, former member of the GEMM Lab (Defended PhD. March 2020)

It’s been a long time since I wrote a blog post for the GEMM Lab (more than two years ago!). You may remember me as a former Ph.D. student working with gray whale body condition and hormone variation in association with ambient noise… and so much has happened since then!

After my graduation, since I have tropical blood running in my veins, I literally crossed the entire country in search of blue and sunny skies, warm weather and ocean, and of course different opportunities to continue doing research involving stressors and physiological responses in marine mammals and other marine organisms. It didn’t take me long to start a position as a postdoctoral associate with the Institute of Environment at Florida International University. I have learned so much in these past two years while mainly working with toxicology and stress biomarkers in a wide range of marine individuals including corals, oysters, fish, dolphins, and now manatees. I have started a new chapter in my life, and I am very eager to see where it takes me.

Talking about chapters… my Ph.D. thesis comprised four different chapters and I had published only the first one when I left Oregon: “Intra- and inter-annual variation in gray whale body condition on a foraging ground”. In this study we used drone-based photogrammetry to measure and compare gray whale body condition along the Oregon coast over three consecutive foraging seasons (June to October, 2016-2018). We described variations across the different demographic units, improved body condition with the progression of feeding seasons, and variations across years, with a better condition in 2016 compared to the following two years. Then in 2020, I was able to publish my second chapter entitled “Assessment of fecal steroid and thyroid hormone metabolites in eastern North Pacific gray whales”. In this study, we used gray whale fecal samples to validate and quantify four different hormone metabolite concentrations (progestins, androgens, glucocorticoids, and thyroid hormone). We reported variation in progestins and androgens by demographic unit and by year. Almost a year later, my third chapter “Stressed and slim or relaxed and chubby? A simultaneous assessment of gray whale body condition and hormone variability was published. In this chapter, we documented a negative correlation between body condition and glucocorticoids, meaning that slim whales were more stressed than the chubby ones.

These three chapters were “relatively easy” to publish compared to my fourth chapter, which had a long and somewhat stressful process (which is funny as I am trying to report stress responses in gray whales). Changes between journals, titles, analyses, content, and focus had to be made over the past year and a half for it to be accepted for publication. However, I believe that it was worth the extra work and invested time as our research definitely became more robust after all of the feedback provided by the reviewers. This chapter, now entitled “Effects of vessel traffic and ocean noise on gray whale stress hormones” was finally published earlier this month at the Nature Scientific Reports journal, and I’ll describe it further below.

Increased human activities in the last decades have altered the marine ecosystem, leaving us with a noisier, warmer, and more contaminated ocean. The noise caused by the dramatic increase in commercial and recreational shipping and vessel traffic1-3 has been associated with negative impacts on marine wildlife populations4,5. This is especially true for baleen whales, whose frequencies primarily used for communication, navigation, and foraging6,7 are “masked” by the noise generated by this watercraft. Several studies have reported alterations in marine mammal behavioral states8-11, increased group cohesion12-14, and displacement8,15 due to this disturbance, however, just a few studies have considered their physiological responses. Examples of physiological responses reported in marine mammals include altered metabolic rate15,16 and variations in stress-related hormone (i.e., glucocorticoids) concentrations relative to vessel abundance and ambient noise17,18. Based on this context and on the scarcity of such assessments, we attempted to determine the effects of vessel traffic and associated ambient noise, as well as potential confounding variables (i.e., body condition, age, sex, time), on gray whale fecal glucocorticoid concentrations.

In addition to the data used in my previous three chapters collected from gray whales foraging off the Oregon coast, we also collected ambient noise levels using hydrophones, vessel count data from the Oregon Department of Fish and Wildlife (ODFW), and wind data from NOAA National Data Buoy Center (NDBC). Our first finding was a positive correlation between vessel counts and underwater noise levels (Fig. 1A), likely indicating that vessel traffic is the dominant source of noise in the area. To confirm this, we also compared underwater noise levels with wind speed (Fig. 1B), but no correlations were found.

Figure 1: Linear correlations between noise levels (daily median root mean square [rms] sound pressure level [SPL] in dB [re 1 μPa]; 50–1000 Hz) recorded on a hydrophone deployed outside the Newport harbor entrance during June to October of 2017 and 2018 and (A) vessel counts in Newport and Depoe Bay, Oregon, USA, and (B) daily median wind speed (m/s) from an anemometer station located on South Beach, Newport, Oregon, USA (station NWPO3). Asterisk indicates significant correlations between SPL and vessel counts in both years.

We also investigated noise levels by the hour of the day (Fig. 2), and we found that noise levels peaked between 6 and 8 am most days, coinciding with the peak of vessels leaving the harbor to get to fishing grounds. Another smaller peak is seen at 12 pm, which may represent “half-day fishing charter” vessels returning to the harbor. In contrast, wind speeds (in the lower graph) peaked between 3 and 4 pm, thus confirming the absence of correlation between noise and wind and providing more evidence that noise levels are dominated by the vessel activity in the area. 

Figure 2: Median noise levels (root mean square sound pressure levels—SPLrms) for each hour of each day recorded on a hydrophone (50–10,000 Hz) deployed outside the Newport harbor entrance during June to October of 2017 (middle plot) and 2018 (upper plot), and hourly median noise level (SPL) against hourly median wind speed (lower plot) from an anemometer station located on South Beach, Newport, Oregon, USA (station NWPO3) over the same time period.

Finally, we assessed the effects of vessel counts, month, year, sex, whale body condition, and other hormone metabolites on glucocorticoid metabolite (GCm; “stress”) concentrations. Since we are working with fecal samples, we needed to consider the whale gut transit time and go back in time to link time of exposure (vessel counts) to response (glucocorticoid concentrations). However, due to uncertainty regarding gut transit time in baleen whales, we compared different time lags between vessel counts and fecal collection. The gut transit time in large mammals is ~12 hours to 4 days3,19,20, so we investigated the influence of vessel counts on whale “stress hormone levels” from the previous 1 to 7 days. The model with the most influential temporal scale included vessel counts from previous day, which showed a significant positive relationship with GCm (the “stress hormone level”) (Fig. 3).

Figure 3: The effect of vessel counts in Newport and Depoe Bay (Oregon, USA) on the day before fecal sample collection on gray whale fecal glucocorticoid metabolite (GCm) concentrations.

Thus, the “take home messages” of our study are:

  1. The soundscape in our study area is dominated by vessel noise.
  2. Vessel counts are strongly correlated with ambient noise levels in our study area.
  3. Gray whale glucocorticoid levels are positively correlated with vessel counts from previous day meaning that gray whale gut transit time may occur within ~ 24 hours of the disturbance event.

These four chapters were all very important studies not only to advance the knowledge of gray whale and overall baleen whale physiology (as this group is one of the most poorly understood of all mammals given the difficulties in sample collection21), but also to investigate potential sources for the unusual mortality event that is currently happening (2019-present) to the Eastern North Pacific population of gray whales. Such studies can be used to guide future research and to inform population management and conservation efforts regarding minimizing the impact of anthropogenic stressors on whales.

I am very glad to be part of this project, to see such great fruits from our gray whale research, and to know that this project is still at full steam. The GEMM Lab continues to collect and analyze data for determining gray whale body condition and physiological responses in association with ambient noise (Granite, Amber and Diamond projects). The gray whales thank you for this!

Loading

Cited Literature

1. McDonald, M. A., Hildebrand, J. A. & Wiggins, S. M. Increases in deep ocean ambient noise in the Northeast Pacific west of San Nicolas Island, California. J. Acoust. Soc. Am. 120, 711–718 (2006).

2. Kaplan, M. B. & Solomon, S. A coming boom in commercial shipping? The potential for rapid growth of noise from commercial ships by 2030. Mar. Policy 73, 119–121 (2016).

3. McCarthy, E. International regulation of underwater sound: establishing rules and standards to address ocean noise pollution (Kluwer Academic Publishers, 2004).

4. Weilgart, L. S. The impacts of anthropogenic ocean noise on cetaceans and implications for management. Can. J. Zool. 85, 1091–1116 (2007).

5. Bas, A. A. et al. Marine vessels alter the behaviour of bottlenose dolphins Tursiops truncatus in the Istanbul Strait, Turkey. Endanger. Species Res. 34, 1–14 (2017).

6. Erbe, C., Reichmuth, C., Cunningham, K., Lucke, K. & Dooling, R. Communication masking in marine mammals: a review and research strategy. Mar. Pollut. Bull. 103, 15–38 (2016).

7. Erbe, C. et al. The effects of ship noise on marine mammals: a review. Front. Mar. Sci. 6 (2019).

8. Sullivan, F. A. & Torres, L. G. Assessment of vessel disturbance to gray whales to inform sustainable ecotourism. J. Wildl. Manag. 82, 896–905 (2018).

9. Pirotta, E., Merchant, N. D., Thompson, P. M., Barton, T. R. & Lusseau, D. Quantifying the effect of boat disturbance on bottlenose dolphin foraging activity. Biol. Conserv. 181, 82–89 (2015).

10. Dans, S. L., Degrati, M., Pedraza, S. N. & Crespo, E. A. Effects of tour boats on dolphin activity examined with sensitivity analysis of Markov chains. Conserv. Biol. 26, 708–716 (2012).

11. Christiansen, F., Rasmussen, M. & Lusseau, D. Whale watching disrupts feeding activities of minke whales on a feeding ground. Mar. Ecol. Prog. Ser. 478, 239–251 (2013).

12. Bejder, L., Samuels, A., Whitehead, H. & Gales, N. Interpreting short-term behavioural responses to disturbance within a longitudinal perspective. Anim. Behav. 72, 1149–1158 (2006).

13. Nowacek, S. M., Wells, R. S. & Solow, A. R. Short-term effects of boat traffic on Bottlenose dolphins, Tursiops truncatus, in Sarasota Bay, Florida. Mar. Mammal. Sci. 17, 673–688 (2001).

14. Bejder, L., Dawson, S. M. & Harraway, J. A. Responses by Hector’s dolphins to boats and swimmers in Porpoise Bay, New Zealand. Mar. Mammal Sci. 15, 738–750 (1999).

15. Lusseau, D. Male and female bottlenose dolphins Tursiops spp. have different strategies to avoid interactions with tour boats in Doubtful Sound. New Zealand. Mar. Ecol. Prog. Ser. 257, 267–274 (2003).

16. Sprogis, K. R., Videsen, S. & Madsen, P. T. Vessel noise levels drive behavioural responses of humpback whales with implications for whale-watching. Elife 9, e56760 (2020).

17. Ayres, K. L. et al. Distinguishing the impacts of inadequate prey and vessel traffic on an endangered killer whale (Orcinus orca) population. PLoS ONE 7, e36842 (2012).

18. Rolland, R. M. et al. Evidence that ship noise increases stress in right whales. Proc. R. Soc. B Biol. Sci. 279, 2363–2368 (2012).

19. Wasser, S. K. et al. A generalized fecal glucocorticoid assay for use in a diverse array of nondomestic mammalian and avian species. Gen. Comp. Endocrinol. 120, 260–275 (2000).

20. Hunt, K. E., Trites, A. W. & Wasser, S. K. Validation of a fecal glucocorticoid assay for Steller sea lions (Eumetopias jubatus). Physiol. Behav. 80, 595–601 (2004).

21. Hunt, K. E. et al. Overcoming the challenges of studying conservation physiology in large whales: a review of available methods. Conserv. Physiol. 1, cot006–cot006 (2013).

Decisions, decisions: New GEMM Lab publication reveals trade-offs in prey quantity and quality in gray whale foraging

By Lisa Hildebrand, PhD student, OSU Department of Fisheries, Wildlife, & Conservation Sciences, Geospatial Ecology of Marine Megafauna Lab

Obtaining enough food is crucial for predators to ensure adequate energy gain for maintenance of vital functions and support for energetically costly life history events (e.g., reproduction). Foraging involves decisions at every step of the process, including prey selection, capture, and consumption, all of which should be as efficient as possible. Making poor foraging decisions can have long-term repercussions on reproductive success and population dynamics (Harris et al. 2007, 2008, Grémillet et al. 2008), and for marine predators that rely on prey that is spatially and temporally dynamic and notoriously patchy (Hyrenbach et al. 2000), these decisions can be especially challenging. Prey abundance and density are frequently used as predictors of marine predator distribution, movement, and foraging effort, with predators often selecting highly abundant or dense prey patches (e.g., Goldbogen et al. 2011, Torres et al. 2020). However, there is increased recognition that prey quality is also an important factor to consider when assessing a predator’s ecology and habitat use (Spitz et al. 2012), and marine predators do show a preference for higher quality prey items (e.g., Haug et al. 2002, Cade et al. 2022). Moreover, negative impacts of low-quality prey on the health and breeding success of some marine mammals (Rosen & Trites 2000, Trites & Donnelly 2003) have been documented. Therefore, examining multiple prey metrics, such as prey quantity and quality, in predator ecology studies is critical.

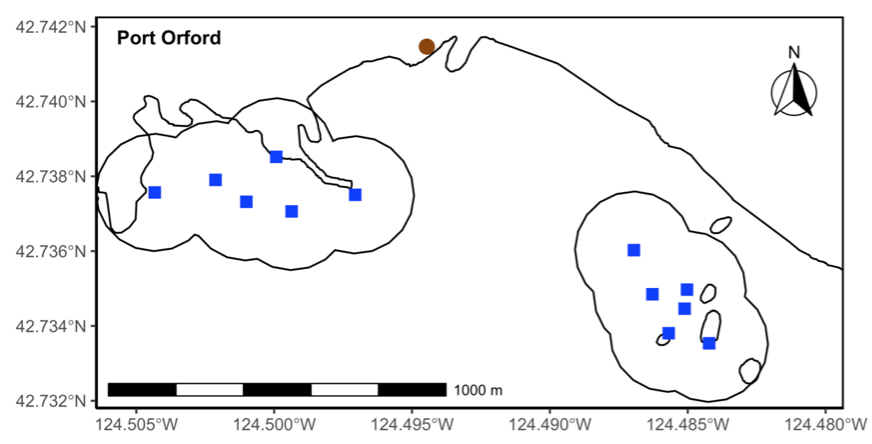
Figure 1. Site map of the Port Orford TOPAZ/JASPER integrated projects. Blue squares represent the location of the 12 sampling stations within the 2 study sites (site boundaries demarcated with black lines). Brown dot represents the cliff-top observation site where theodolite tracking occurred.

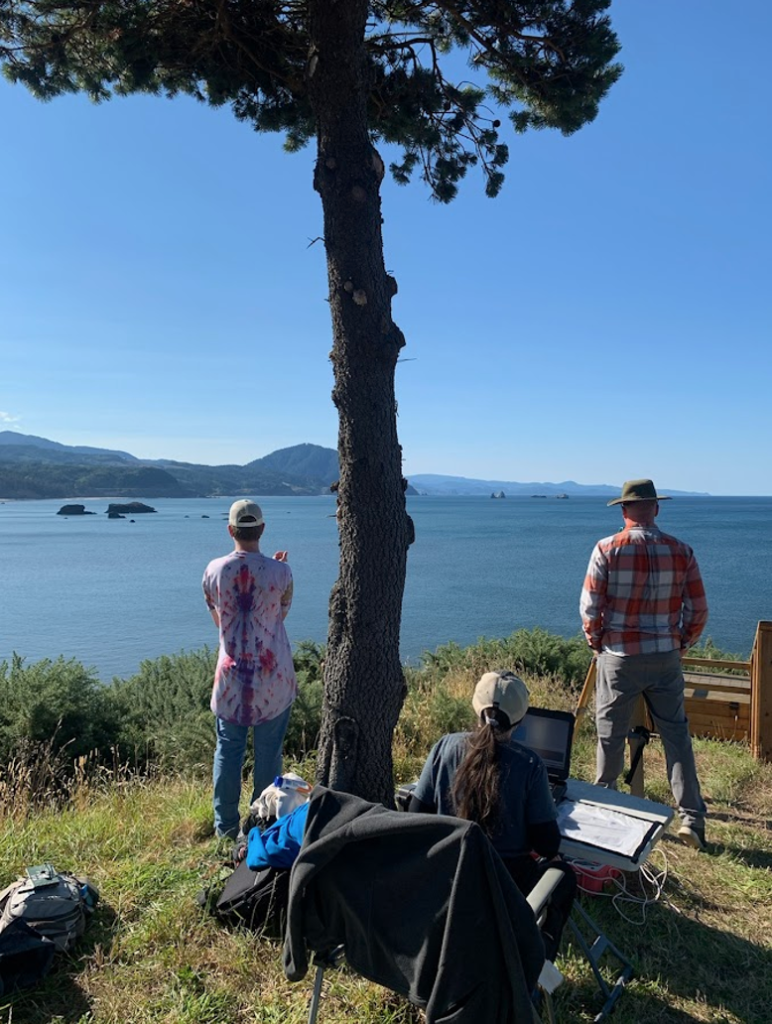
Our integrated TOPAZ/JASPER projects in Port Orford do just this! We collect both prey quantity and quality data from a tandem research kayak, while we track Pacific Coast Feeding Group (PCFG) gray whales from shore. The prey and whale sampling overlap spatially (and often temporally within the same day). This kind of concurrent predator-prey sampling at similar scales is often logistically challenging to achieve, yet because PCFG gray whales have an affinity for nearshore, coastal habitats, it is something we have been able to achieve in Port Orford. Since 2016, a field team comprised of graduate, undergraduate, and high school students has collected data during the month of August to investigate gray whale foraging decisions relative to prey. Every day, a kayak team collects GoPro videos (to assess relative prey abundance; AKA: quantity) and zooplankton samples using a tow net (to assess prey community composition; AKA: quality through caloric content of different species) (Figure 1). At the same time, a cliff team surveys for gray whales from shore and tracks them using a theodolite, which provides us with tracklines of individual whales; We categorize each location of a whale into three broad behavior states (feeding, searching, transiting) based on movement patterns. Over the years, the various students who have participated in the TOPAZ/JASPER projects have written many blog posts, which I encourage you to read here (particularly to get more detailed information about the field methods). 

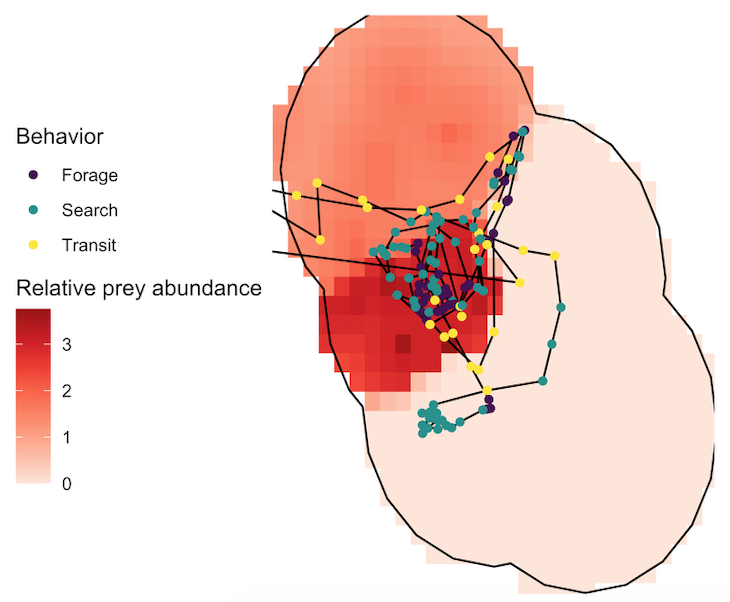
Figure 2. An example daily layer of relative prey abundance (increasing color darkness corresponds with increasing abundance) in one study site with a whale theodolite trackline recorded on the same day overlaid and color-coded by behavioral state.

Several years of data are needed to conduct a robust analysis for our ecological questions about prey choice, but after seven years, we finally had the data and I am excited to share the results, which are due to the many years of hard work from many students! Our recent paper in Marine Ecology Progress Series aimed to determine whether PCFG gray whale foraging decisions are driven by prey quantity (abundance) or quality (caloric content of species) at a scale of 20 m (which is slightly less than 2 adult gray whale body lengths). In this study, we built upon results from my previous Master’s publication, which revealed that there are significant differences in the caloric content between the six common nearshore zooplankton prey species that PCFG gray whales feed on (Hildebrand et al. 2021). Therefore, in this study we addressed the hypothesis that individual whales will select areas where the prey community is dominated by the mysid shrimp Neomysis rayii, since it is significantly higher in caloric content than the other two prey species we identified, Holmesimysis sculpta (a medium quality mysid shrimp species) and Atylus tridens (a low quality amphipod species) (Hildebrand et al. 2021). We used spatial statistics and model to make daily maps of prey abundance and quality that we compared to our whale tracks and behavior from the same day. Please read our paper for the details on our novel methods that produced a dizzying amount of prey layers, which allowed us to tease apart whether gray whales target prey quantity, quality, or a mixture of both when they forage. 

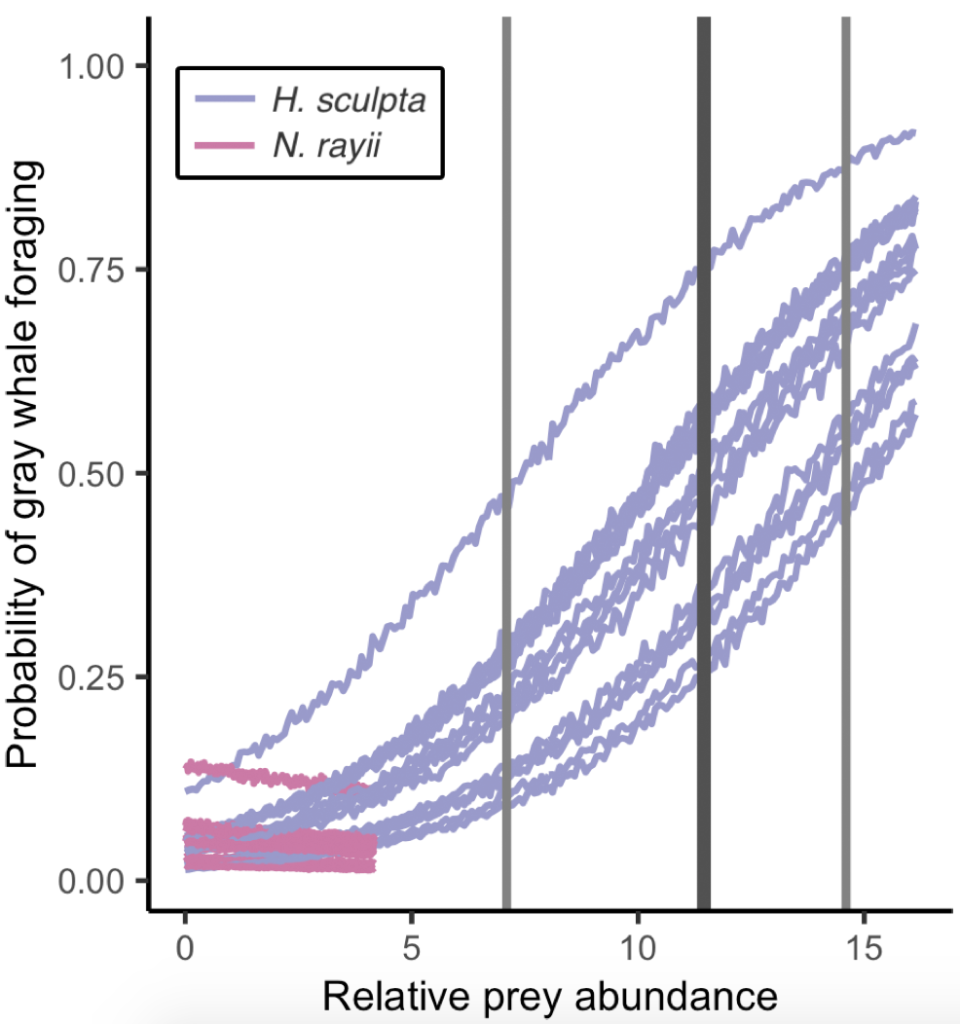
Figure 3. Figure shows the probability of gray whale foraging relative to prey abundance (color-coded by prey species). Dark grey vertical line represents the mean threshold for the H. sculpta curves (12.0); light grey vertical lines: minimum (7.2) and maximum (15.3) thresholds for the H. sculpta curves. Inflection points could not be calculated for the N. rayii curves

So, what did we find? The models proved our hypothesis wrong: foraging probability was significantly correlated with the quantity and quality of the mysid H. sculpta, which has significantly lower calories than N. rayii. This result puzzled us, until we started looking at the overall quantity of these two prey types in the study area and realized that the amount of calorically-rich N. rayii never reached a threshold where it was beneficial for gray whales to forage. But, there was a lot of H. sculpta, which likely made for an energetic gain for the whales despite not being as calorically rich as N. rayii. We determined a threshold of H. sculpta relative abundance that is required to initiate the gray whale foraging behavior, and the abundance of N. rayii never came close to this level (Figure 3). Despite not having the highest quality, H. sculpta did have the highest abundance and showed a significant positive relationship with foraging behavior, unlike the other prey items. Interestingly, whales never selected areas dominated by the low-calorie species A. tridens. These results demonstrate trade-off choices by whales for this abundant, medium-quality prey.

To our knowledge, individual baleen whale foraging decisions relative to available prey quantity and quality have not been addressed previously at this very fine-scale. Interestingly, this trade-off between prey quantity and quality has also been detected in humpback whales foraging in Antarctica at depths deeper than where the densest krill patches occur; while the whales are exploiting less dense krill patches, these krill composed of larger, gravid, higher-quality krill (Cade et al. 2022). While it is unclear how baleen whales differentiate between prey species or reproductive stages, several mechanisms have been suggested, including visual and auditory identification (Torres 2017). We assume here that gray whales, and other baleen whale species, can differentiate between prey species. Thus, our results showcase the importance of knowing the quality (such as caloric content) of prey items available to predators to understand their foraging ecology (Spitz et al. 2012). 

References

Cade DE, Kahane-Rapport SR, Wallis B, Goldbogen JA, Friedlaender AS (2022) Evidence for size-selective pre- dation by Antarctic humpback whales. Front Mar Sci 9:747788

Goldbogen JA, Calambokidis J, Oleson E, Potvin J, Pyenson ND, Schorr G, Shadwick RE (2011) Mechanics, hydrody- namics and energetics of blue whale lunge feeding: effi- ciency dependence on krill density. J Exp Biol 214:131−146

Grémillet D, Pichegru L, Kuntz G, Woakes AG, Wilkinson S, Crawford RJM, Ryan PG (2008) A junk-food hypothesis for gannets feeding on fishery waste. Proc R Soc B 275: 1149−1156

Harris MP, Beare D, Toresen R, Nøttestad L, and others (2007) A major increase in snake pipefish (Entelurus aequoreus) in northern European seas since 2003: poten- tial implications for seabird breeding success. Mar Biol 151:973−983

Harris MP, Newell M, Daunt F, Speakman JR, Wanless S (2008) Snake pipefish Entelurus aequoreus are poor food for seabirds. Ibis 150:413−415

Haug T, Lindstrøm U, Nilssen KT (2002) Variations in minke whale (Balaenoptera acutorostrata) diet and body condi- tion in response to ecosystem changes in the Barents Sea. Sarsia 87:409−422

Hildebrand L, Bernard KS, Torres LG (2021) Do gray whales count calories? Comparing energetic values of gray whale prey across two different feeding grounds in the eastern North Pacific. Front Mar Sci 8:1008

Hyrenbach KD, Forney KA, Dayton PK (2000) Marine pro- tected areas and ocean basin management. Aquat Con- serv 10:437−458

Rosen DAS, Trites AW (2000) Pollock and the decline of Steller sea lions: testing the junk-food hypothesis. Can J Zool 78:1243−1250

Spitz J, Trites AW, Becquet V, Brind’Amour A, Cherel Y, Galois R, Ridoux V (2012) Cost of living dictates what whales, dolphins and porpoises eat: the importance of prey quality on predator foraging strategies. PLOS ONE 7:e50096

Torres LG, Barlow DR, Chandler TE, Burnett JD (2020) Insight into the kinematics of blue whale surface forag- ing through drone observations and prey data. PeerJ 8: e8906

Torres LG (2017) A sense of scale: foraging cetaceans’ use of scale-dependent multimodal sensory systems. Mar Mamm Sci 33:1170−1193

Trites AW, Donnelly CP (2003) The decline of Steller sea lions Eumetopias jubatus in Alaska: a review of the nutri- tional stress hypothesis. Mammal Rev 33:3−28

Putting Fitbits on whales: How tag data allows for estimating calories burned by foraging PCFG gray whales

By: Kate Colson, MSc Student, University of British Columbia, Institute for the Oceans and Fisheries, Marine Mammal Research Unit

Hello! My name is Kate Colson and I am a master’s student at the University of British Columbia, co-supervised by Dr. Andrew Trites of the Marine Mammal Research Unit and Dr. Leigh Torres of the GEMM Lab. As part of my thesis work, I have had the opportunity to spend the summer field season with Leigh and the GEMM Lab team. 

For my master’s I am studying the foraging energetics of Pacific Coast Feeding Group (PCFG) gray whales as part of the much larger Gray whale Response to Ambient Noise Informed by Technology and Ecology (GRANITE) project. Quantifying the energy expenditure of PCFG gray whales during foraging can help establish a baseline for how disturbance impacts the ability of this unique population to meet their energy needs. Additionally, determining how many calories are burned during different PCFG foraging behaviors might help explain why some gray whales are in better body condition than others.

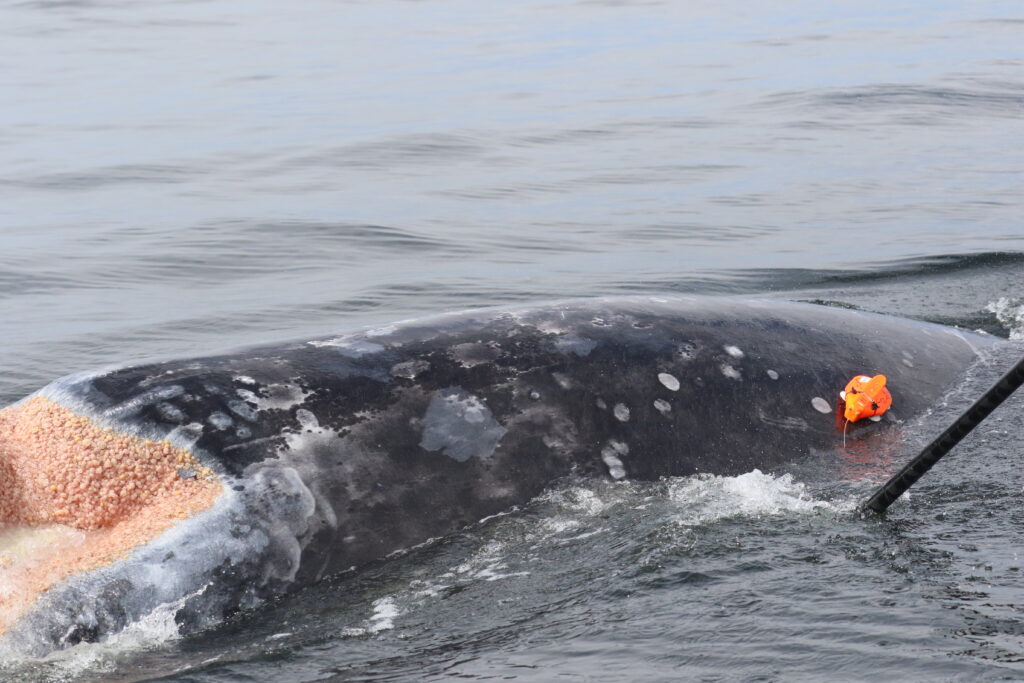
To understand how much energy different PCFG foraging behaviors cost, I am using data from suction cup tags we have temporarily applied on PCFG gray whales (Figure 1). You can read more about the why the GEMM Lab started using these tags in an earlier blog here. What I want to talk about in this blog is how exactly we can use this tag data to estimate energy expenditure of PCFG gray whales. 

Figure 1. The famous “Scarlett” with a suction cup tag just attached using a carbon fiber pole (seen on far right). This minimally invasive tag has many data sensors, all of which sample at high frequencies, that can allow for an estimation of energy expenditure for different gray whale behaviors. Source: GEMM Lab; National Marine Fisheries Service (NMFS) permit no. 21678 

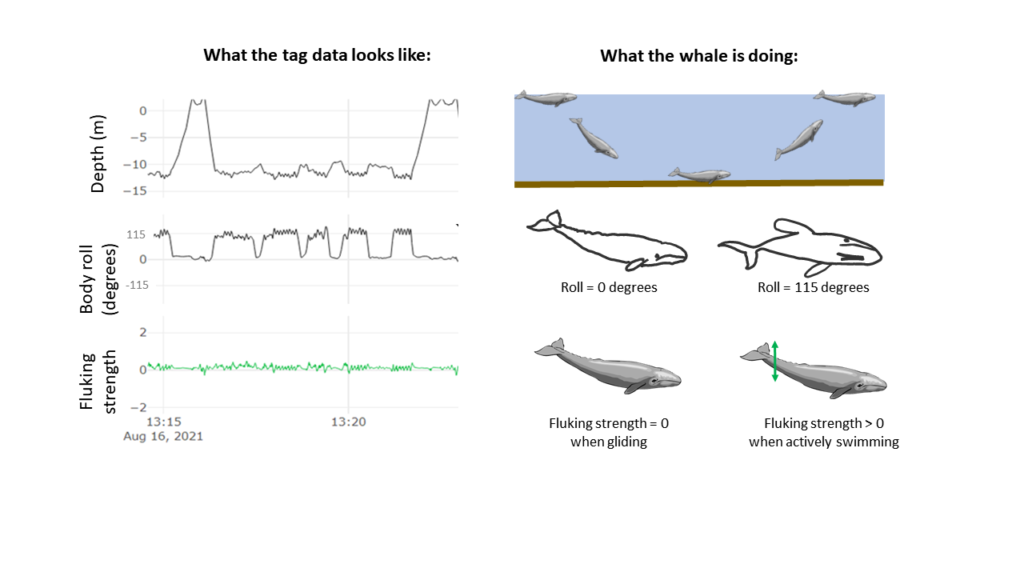
The suction cups tags used in this project have many data sensors that are useful for describing the movement of the tagged whale including accelerometers, magnetometers, gyroscopes, and pressure sensors, and all are sampling at high frequencies. For example, the accelerometer is taking 400 measurements per second! The accelerometer, magnetometer, and gyroscope take measurements in 3 dimensions along the X, Y, and Z-axes. The whale’s movement around the X-axis indicates roll (if the whale is swimming on its side), while movement around the Y-axis indicates pitch (if the whales head is oriented towards the surface or the sea floor). Changes in the whale’s movement around the Z-axis indicates if the whale is changing its swimming direction. Together, all of these sensors can describe the dive profile, body orientation, fluking behavior, and fine-scale body movements of the animal down to the second (Figure 2). This allows for the behavior of the tagged whale to be specifically described for the entirety of the tag deployment. 

Figure 2. An example of what the tag sensor data looks like. The top panels show the depth of the animal and can be used to determine the diving behavior of the whale. The middle panels show the body roll of the whale (the X axis) —a roll value close to 0 means the whale is swimming “normally” with no rotation to either side, while a higher roll value means the whale is positioned on its side. The bottom panels show the fluking behavior of the animal: each spike is the whale using its tail to propel itself through the water, with higher spikes indicating a stronger fluke stroke. Source: GEMM Lab, NMFS permit no. 21678

Although these suction cup tags are a great advancement in collecting fine-scale data, they do not have a sensor that actually measures the whale’s metabolism, or rate of calories burned by the whale. Thus, to use this fine-scale tag data as an estimate for energy expenditure, a summary metric must be calculated from the data and used as a proxy. The most common metric found in the literature is Overall Dynamic Body Acceleration (ODBA) and many papers have been published discussing the pros and cons of using ODBA as a proxy for energy expenditure (Brown et al., 2013; Gleiss et al., 2011; Halsey, 2017; Halsey et al., 2011; Wilson et al., 2020). The theory behind ODBA is that because an animal’s metabolic rate is primarily comprised of movement costs, then measuring the acceleration of the body is an effective way of determining energy expenditure. This theory might seem very abstract, but if you have ever worn a Fitbit or similar fitness tracking device to estimate how many calories you’ve burned during a workout, the same principle applies. Those fitness devices use accelerometers and other sensors, to measure the movement of your limbs and produce estimates of energy used. 

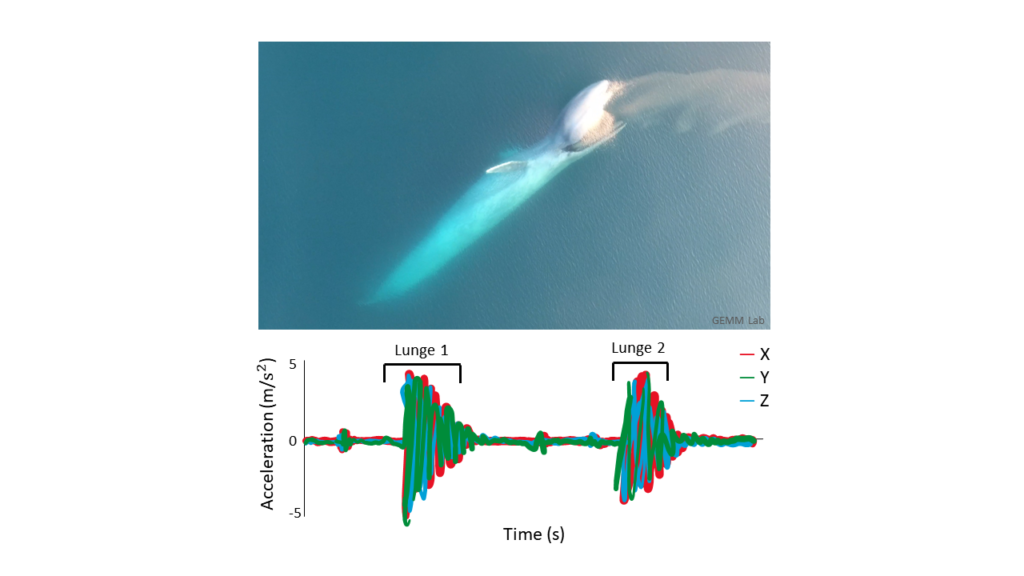
So now that we’ve established that the goal of my research is to essentially use these suction cup tags as Fitbits for PCFG gray whales, let’s look at how accelerometry data has been used to detect foraging behavior in large whales so far. Many accelerometry tagging studies have used rorquals as a focal species (see Shadwick et al. (2019) for a review). Well-known rorqual species include humpback, fin, and blue whales. These species forage by using lunges to bulk feed on dense prey patches in the water column. Foraging lunges are indicated by isolated periods of high acceleration that are easily detectable in the tag data (Figure 3; Cade et al., 2016; Izadi et al., 2022). 

Figure 3. Top image: A foraging blue whale performing a surface lunge (Photo credit: GEMM Lab). Note the dense aggregation of krill in the whale’s mouth. Bottom image: The signature acceleration signal for lunge feeding (adapted from Izadi et al., 2022). Each color represents one of the 3D axes of whale movement. The discrete periods of high acceleration represent lunges

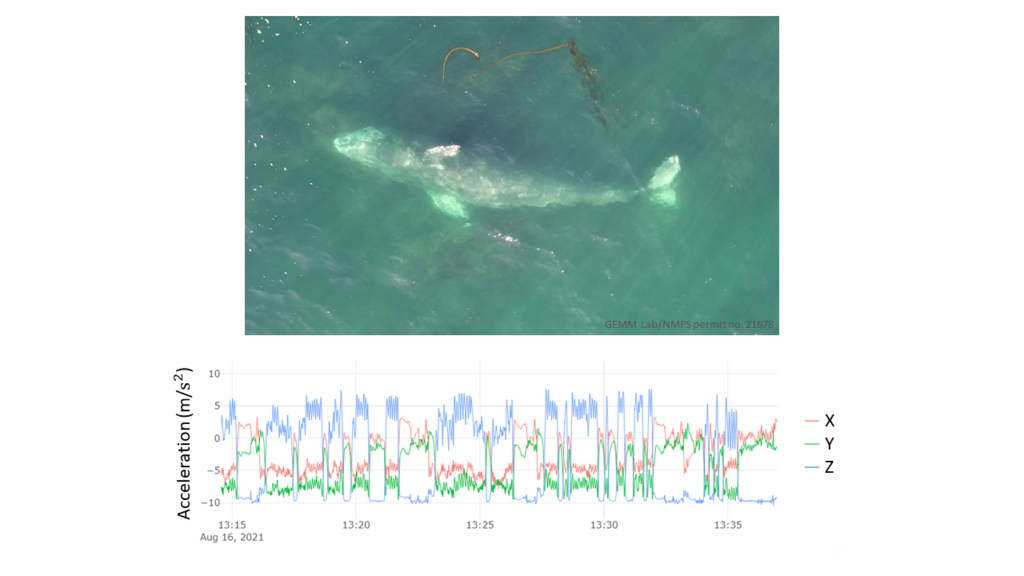
However, gray whales feed very differently from rorquals. Gray whales primarily suction feed on the benthos, using their head to dig into the sediment and filter prey out of the mud using their baleen. Yet,  PCFG gray whales often perform many other foraging behaviors such as headstanding and side-swimming (Torres et al., 2018). Additionally, PCFG gray whales tend to feed in water depths that are often shallower than their body length. This shallow depth makes it difficult to isolate signals of foraging in the accelerometry data from random variation in the data and separate the tag data into periods of foraging behaviors (Figure 4).

Figure 4. Top image: A foraging PCFG gray whale rolls on its side to feed on mysid prey. Bottom image: The graph shows the accelerometry data from our suction cup tags that can be used to calculate Overall Dynamic Body Acceleration (ODBA) as a way to estimate energy expenditure. Each color represents a different axis in the 3D motion of the whale. The X-axis is the horizontal axis shows forward and backward movement of the whale, the Y-axis shows the side-to-side movement of the whale, and the Z-axis shows the up-down motion of the whale. Note how there are no clear periods of high acceleration in all 3 axes simultaneously to indicate different foraging behaviors like is apparent during lunges of rorqual whales. However, there is a pattern showing that when acceleration in the Z-axis (blue line) is positive, the X- and Y-axes (red and green lines) are negative. Source: GEMM Lab; NMSF permit no. 21678

But there is still hope! Thanks to the GEMM Lab’s previous work describing the foraging behavior of the PCFG sub-group using drone footage, and the video footage available from the suction cup tags deployed on PCFG gray whales, the body orientation calculated from the tag data can be a useful indication of foraging. Specifically, high body roll is apparent in many foraging behaviors known to be used by the PCFG, and when the tag data indicates that the PCFG gray whale is rolled onto its sides, lots of sediment (and sometimes even swarms of mysid prey) is seen in the tag video footage. Therefore, I am busy isolating these high roll events in the collected tag data to identify specific foraging events. 

My next steps after isolating all the roll events will be to use other variables such as duration of the roll event and body pitch (i.e., if the whales head is angled down), to define different foraging behaviors present in the tag data. Then, I will use the accelerometry data to quantify the energetic cost of performing these behaviors, perhaps using ODBA. Hopefully when I visit the GEMM Lab again next summer, I will be ready to share which foraging behavior leads to PCFG gray whales burning the most calories!

References

Brown, D. D., Kays, R., Wikelski, M., Wilson, R., & Klimley, A. P. (2013). Observing the unwatchable through acceleration logging of animal behavior. Animal Biotelemetry1(1), 1–16. https://doi.org/10.1186/2050-3385-1-20

Cade, D. E., Friedlaender, A. S., Calambokidis, J., & Goldbogen, J. A. (2016). Kinematic diversity in rorqual whale feeding mechanisms. Current Biology26(19), 2617–2624. https://doi.org/10.1016/j.cub.2016.07.037

Duley, P. n.d. Fin whales feeding [photograph]. NOAA Northeast Fisheries Science Center Photo Gallery. https://apps-nefsc.fisheries.noaa.gov/rcb/photogallery/finback-whales.html

Gleiss, A. C., Wilson, R. P., & Shepard, E. L. C. (2011). Making overall dynamic body acceleration work: On the theory of acceleration as a proxy for energy expenditure. Methods in Ecology and Evolution2(1), 23–33. https://doi.org/10.1111/j.2041-210X.2010.00057.x

Halsey, L. G. (2017). Relationships grow with time: A note of caution about energy expenditure-proxy correlations, focussing on accelerometry as an example. Functional Ecology31(6), 1176–1183. https://doi.org/10.1111/1365-2435.12822

Halsey, L. G., Shepard, E. L. C., & Wilson, R. P. (2011). Assessing the development and application of the accelerometry technique for estimating energy expenditure. Comparative Biochemistry and Physiology – A Molecular and Integrative Physiology158(3), 305–314. https://doi.org/10.1016/j.cbpa.2010.09.002

Izadi, S., Aguilar de Soto, N., Constantine, R., & Johnson, M. (2022). Feeding tactics of resident Bryde’s whales in New Zealand. Marine Mammal Science, 1–14. https://doi.org/10.1111/mms.12918

Shadwick, R. E., Potvin, J., & Goldbogen, J. A. (2019). Lunge feeding in rorqual whales. Physiology34, 409–418. https://doi.org/10.1152/physiol.00010.2019

Torres, L. G., Nieukirk, S. L., Lemos, L., & Chandler, T. E. (2018). Drone up! Quantifying whale behavior from a new perspective improves observational capacity. Frontiers in Marine Science5, 1–14. https://doi.org/10.3389/fmars.2018.00319

Wilson, R. P., Börger, L., Holton, M. D., Scantlebury, D. M., Gómez-Laich, A., Quintana, F., Rosell, F., Graf, P. M., Williams, H., Gunner, R., Hopkins, L., Marks, N., Geraldi, N. R., Duarte, C. M., Scott, R., Strano, M. S., Robotka, H., Eizaguirre, C., Fahlman, A., & Shepard, E. L. C. (2020). Estimates for energy expenditure in free-living animals using acceleration proxies: A reappraisal. Journal of Animal Ecology89(1), 161–172. https://doi.org/10.1111/1365-2656.13040

Dive into Oregon’s underwater forests

By Lisa Hildebrand, PhD student, OSU Department of Fisheries, Wildlife, & Conservation Sciences, Geospatial Ecology of Marine Megafauna Lab

When I was younger, I aspired to be a marine mammal biologist. I thought it was purely about knowing as much about marine mammal species as possible. However, over time and with experience in this field, I have realized that in order to understand a species, you need to have a holistic understanding of its prey, habitat, and environment. When I first applied to be advised by Leigh in the GEMM Lab, I had no idea how much of my time I would spend looking at tiny zooplankton under a microscope, thinking about the different benefits of different habitat types, or reading about oceanographic processes. But these things have been incredibly vital to my research to date and as a result, I now refer to myself as a marine ecologist. This holistic understanding that I am gaining will only grow throughout my PhD as I am broadly looking at the habitat use, site fidelity, and population dynamics of the Pacific Coast Feeding Group (PCFG) of gray whales for my thesis research. 

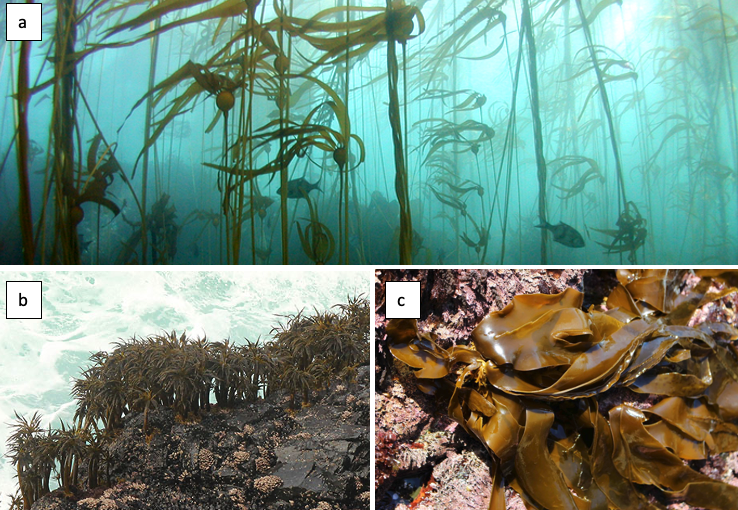
The PCFG display many foraging tactics and occupy several habitat types along the Oregon coast while they spend their summer feeding seasons here (Torres et al. 2018). Here, I will focus on one of these habitats: kelp. When you hear the word kelp, you probably conjure an image of long, thick stalks that reach from the ocean floor to the surface, with billowing fronds waving around (Figure 1a). However, this type is only one of three basic morphologies (Filbee-Dexter & Scheibling 2014) and it is called canopy kelp, which often forms extensive forests. The other two morphologies are stipitate and prostrate kelps. The former forms midwater stands (Figure 1b) while the latter forms low-lying kelp beds (Figure 1c). All three of these morphologies exist on the Oregon coast and create a mosaic of understory and canopy kelp patches that dot our coastline.

Figure 1. Examples of the three different kelp morphologies. a: bull kelp (Nereocystis luetkeana) is a type of canopy kelp and the dominant kelp on the Oregon coast (Source: Oregon Coast Aquarium); b: sea palm (Postelsia palmaeformis) is a type of stipitate kelp that forms mid-water stands (Source: Oregon Conservation Strategy); c: sea cabbage (Saccharina sessilis) is a type of prostrate kelp that is stipeless and forms low-lying kelp beds (Source: Central Coast Biodiversity).

One of the most magnificent things about kelp is that it is not just a species itself, but it provides critical habitat, refuge, and food resources to a myriad of other species due to its high rates of primary production (Dayton 1985). Kelp is often referred to as a foundation species due to all of these critical services it provides. In Oregon, many species of rockfish, which are important commercial and recreational fisheries, use kelp as habitat throughout their life cycle, including as nursery grounds. Lingcod, another widely fished species, forages amongst kelp. A large number of macroinvertebrates can be found in Oregon kelp forests, including anemones, limpets, snails, sea urchins, sea stars, and abalone, to name a fraction of them. 

Kelps grow best in cold, nutrient-rich waters (Tegner et al. 1996) and their growth and distribution patterns are highly naturally variable on both temporal and spatial scales (Krumhansl et al. 2016). However, warm water, low nutrient or light conditions, intensive grazing by herbivores, and severe storm activity can lead to the erosion and defoliation of kelp beds (Krumhansl et al. 2016). While these events can occur naturally in cyclical patterns, the frequency of several of these events has increased in recent years, as a result of climate change and anthropogenic impacts. For example, Dawn’s blog discussed increasing marine heatwaves that represent an influx of warm water for a prolonged period of time. In fact, kelps can be useful sentinels of change as they tend to be highly responsive to changes in environmental conditions (e.g., Rogers-Bennet & Catton 2019) and their nearshore, coastal location directly exposes them to human activities, such as pollution, harvesting, and fishing (Bennett et al. 2016).

Due to its foundational role, changes or impacts to kelp can reverberate throughout the ecosystem and negatively affect many other species. As mentioned previously, kelp is naturally highly variable, and like many other ecological processes, undergoes boom and bust cycles. For over four decades, dense, productive kelp forests have been shown to transition to sea urchin barrens, and back again, in natural cycles (Sala et al. 1998; Pinnegar et al. 2000; Steneck et al. 2002; Figure 2). These transitions are called phase shifts. In a healthy, balanced kelp forest, sea urchins typically passively feed on detrital plant matter, such as broken off pieces of kelp fronds that fall to the seafloor. A phase shift occurs when the grazing intensity of sea urchins increases, resulting in them actively feeding on kelp stalks and fronds to a point where the kelp in an area can become greatly reduced, creating an urchin barren. Sea urchin grazing intensity can change for a number of reasons, including reduction in sea urchin predators (e.g., sea otters, sunflower sea stars) or poor kelp recruitment events (e.g., due to warm water temperature). Regardless of the reason, the phases tend to transition back and forth over time. However, there is concern that sea urchin barrens may become an alternative stable state of the subtidal ecosystem from which kelp in an area cannot recover (Filbee-Dexter & Scheibling 2014). 

Figure 2. Screenshots from GoPro videos from 2016 (left) and 2018 (right) at the same kayak sampling station in Port Orford showing the difference between a dense kelp forest and what appears to be an urchin barren. (Source: GEMM Lab).

For example, in 2014, bull kelp canopy cover in northern California was reduced by >90% and has not shown signs of recovery since (Rogers-Bennet & Catton 2019; Figure 3). This massive decline was attributed to two major events: 1) the onset of sea star wasting disease (SSWD) in 2013 and 2) the “warm blob” of 2014-2016. SSWD affected over 20 sea star species along the coast from Mexico to Alaska, with the predatory sunflower sea star, which consumes purple sea urchins, most affected, including population declines of 80-100% along the coast (Harvell et al. 2019). Following this SSWD outbreak, the “warm blob”, which was an extreme marine heatwave in the Pacific Ocean, caused ocean temperatures to spike. These two events allowed purple sea urchin populations to grow unchecked by their predators, and created nutrient-poor and warm water conditions, which limited kelp growth and productivity. Intense grazing on bull kelp by growing urchin populations resulted in the >90% reduction in bull kelp canopy cover and has left behind widespread urchin barrens instead (Rogers-Bennet & Catton 2019). Consequently, there have been ecological and economic impacts on the ecosystem and communities in northern California. Without bull kelp, red abalone and red sea urchin populations starved, leading to a subsequent loss of the recreational red abalone (estimated value of $44 million/year) and commercial red urchin fisheries in northern California (Rogers-Bennet & Catton 2019).

Figure 3. Surface kelp canopy area pre- and post-impact from sites in Sonoma and Mendocino counties, northern California from aerial surveys (2008, 2014-2016). Figure and figure caption taken from Rogers-Bennett & Catton (2019).

As I mentioned earlier, while phase shifts between kelp forests and urchin barrens are common cycles, the intensity of the events described above in northern California are an example of sea urchin barrens potentially becoming a stable state of the subtidal ecosystem (Filbee-Dexter & Scheibling 2014). Given that marine heatwaves are only expected to increase in intensity and frequency in the future (Frölicher et al. 2018), the events documented in northern California may not be an isolated incidence. 

Considering that parts of the Oregon coast, particularly the southern portion, are very similar to northern California biogeographically, and that it was not exempt from the “warm blob”, similar changes in kelp forests may be occurring along our coast. There are many individuals and groups that are actively working on this issue to examine potential impacts to kelp and the species that depend on the services it provides. For more information, check out the Oregon Kelp Alliance

Figure 4. A gray whale surfaces in a large kelp bed during a foraging bout along the Oregon coast. (Source: GEMM Lab).

So, what does all of this information have to do with gray whales? Given their affinity for kelp habitats (Figure 4) and their zooplankton prey that aggregates there, changes to kelp ecosystems may affect gray whale health and ecology. This aspect of the complex kelp trophic web has not been examined to date; thus one of my PhD chapters focuses on the response of gray whales to changing kelp ecosystems along the southern Oregon coast. To do this, I am examining 6 years of data collected during the TOPAZ/JASPER project in Port Orford, to look at the relationships between kelp health, sea urchin density, zooplankton abundance, and gray whale foraging effort over space and time. Documenting impacts of changing kelp forests on gray whales is important to assist management efforts as healthy and abundant kelp seems critical in providing ample food opportunities for these iconic Pacific Northwest marine predators.

Did you enjoy this blog? Want to learn more about marine life, research, and conservation? Subscribe to our blog and get a weekly alert when we make a new post! Just add your name into the subscribe box on the left panel.

References

Bennett S, et al. The ‘Great Southern Reef’: Social, ecological and economic value of Australia’s neglected kelp forests. Marine and Freshwater Research 67:47-56.

Dayton PK (1985) Ecology of kelp communities. Annual Review of Ecology and Systematics 16:215-245.

Filbee-Dexter K, Scheibling RE (2014) Sea uechin barrens as alternative stable states of collapsed kelp ecosystems. Marine Ecology Progress Series 495:1-25.

Frölicher TL, Fischer EM, Gruber N (2018) Marine heatwaves under global warming. Nature 560:360-364.

Harvell CD, et al. (2019) Disease epidemic and a marine heat wave are associated with the continental-scale collapse of a pivotal predator (Pycnopodia helianthoides). Science Advances 5(1) doi:10.1126/sciadv.aau7042.

Krumhansl KA, et al. (2016) Global patterns of kelp forest change over the past half-century. Proceedings of the National Academy of Sciences of the United States of America 113(48):13785-13790.

Pinnegar JK, et al. (2000) Trophic cascades in benthic marine ecosystems: lessons for fisheries and protected-area management. Environmental Conservation 27:179-200.

Rogers-Bennett L, Catton CA (2019) Marine heat wave and multiple stressors tip bull kelp forest to sea urchin barrens. Scientific Reports 9:15050.

Sala E, Boudouresque CF, Harmelin-Vivien M (1998) Fishing, trophic cascades and the structure of algal assemblages; evaluation of an old but untested paradigm. Oikos 82:425-439.

Steneck RS, et al. (2002) Kelp forest ecosystems: biodiversity, stability, resilience and future. Environmental Conservation 29:436-459.

Tegner MJ, Dayton PK, Edwards PB, Riser KL (1996) Is there evidence for the long-term climatic change in southern California kelp forests? California Cooperative Oceanic Fisheries Investigations Report 37:111-126.

Torres LG, Nieukirk SL, Lemos L, Chandler TE (2018) Drone up! Quantifying whale behavior from a new perspective improves observational capacity. Frontiers in Marine Science doi:10.3389/fmars.2019.00319.

Wavelet analysis to describe biological cycles and signals of non-stationarity

By Allison Dawn, GEMM Lab Master’s student, OSU Department of Fisheries, Wildlife, and Conservation Sciences, Geospatial Ecology of Marine Megafauna Lab 

During my second term of graduate school, I have been preparing to write my research proposal. The last two months have been an inspiring process of deep literature dives and brainstorming sessions with my mentors. As I discussed in my last blog, I am interested in questions related to pattern and scale (fine vs. mesoscale) in the context of the Pacific Coast Feeding Group (PCFG) of gray whales, their zooplankton prey, and local environmental variables.

My work currently involves exploring which scales of pattern are important in these trophic relationships and whether the dominant scale of a pattern changes over time or space. I have researched which analysis tools would be most appropriate to analyze ecological time series data, like the impressive long-term dataset the GEMM lab has collected in Port Orford as part of the TOPAZ  project, where we have monitored the abundance of whales and zooplankton, as well as environmental variables since 2016. 

A useful analytical tool that I have come across in my recent coursework and literature review is called wavelet analysis. Importantly, wavelet analysis can handle non-stationarity and edge detection in time series data. Non-stationarity is when a dataset’s mean and/or variance can change over time or space, and edge detection is the identification of the change location (in time or space). For example, it is not just the cycles or “ups and downs” of zooplankton abundance I am interested in, but when in time or where in space these cycles of “ups and downs” might change in relation to what their previous values, or distances between values, were. Simply stated, non-stationarity is when what once was normal is no longer normal. Wavelet analysis has been applied across a broad range of fields, such as environmental engineering (Salas et al. 2020), climate science (Slater et al. 2021), and bio-acoustics (Buchan et al. 2021). It can be applied to any time series dataset that might violate the traditional statistical assumption of stationarity. 

In a recent review of climate science methodology, Slater et al. (2021) outlined the possible behavior of time series data. Using theoretical plots, the authors show that data can a) have the same mean and variance over time, or b) have non-stationarity that can be broken into three major groups – trend, step change, or shifts in variance. Figure 1 further demonstrates the difference between stationary vs. non-stationary data in relation to a given variable of interest over time. 

Figure 1. Plots showing the possible magnitude of a given variable across a time series: a) Stationary behavior, b) Non-stationary trend, step-change, and a shift in variance. [Taken from Slater et. al (2021)].

Traditional correlation statistics assumes stationarity, but it has been shown that ecological time series are often non-stationary at certain scales (Cazelles & Hales, 2006). In fact, ecological data rarely meets the requirements of a controlled experiment that traditional statistics require. This non-stationarity of ecological data means that while widely-used methods like generalized linear models and analyses of variances (ANOVAs) can be helpful to assess correlation, they are not always sufficient on their own to describe the complex natural phenomena ecologists seek to explain. Non-stationarity occurs frequently in ecological time series, so it is appropriate to consider analysis tools that will allow us to detect edges to further investigate the cause.

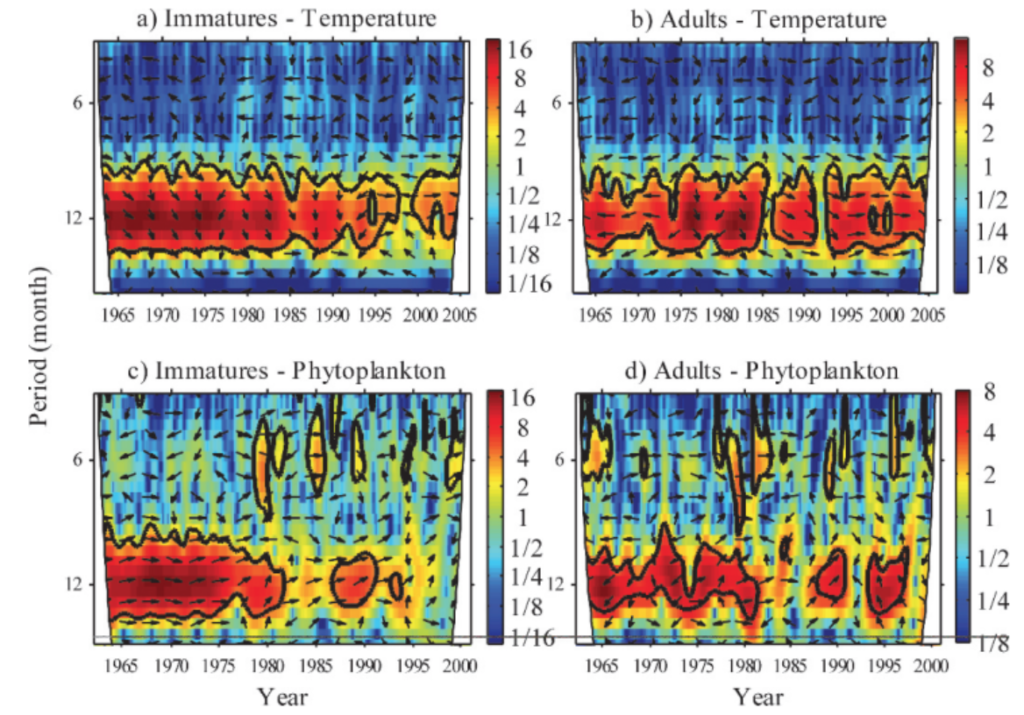
Wavelet analysis can also be conducted across a time series of multiple response variables to assess if these variables share high common power (correlation). When data is combined in this way it is called a cross-wavelet analysis. An interesting paper used cross-wavelet analysis to assess the seasonal response of zooplankton life history in relation to climate warming (Winder et. al 2009). Results from their cross-wavelet analysis showed that warming temperatures over the past two decades increased the voltinism (number of broods per year) of copepods. The authors show that where once annual recruitment followed a fairly stationary pattern, climate warming has contributed to a much more stochastic pattern of zooplankton abundance. From these results, the authors contribute to the hypothesis that climate change has had a temporal impact on zooplankton population dynamics, and recruitment has increasingly drifted out of phase from the original annual cycles. 

Figure 2. Cross-wavelet spectrum for immature and adult Leptodiaptomus ashlandi for 1965 through either 2000 or 2005. Plots show a) immatures and temperature, b) adults and temperature, c) immatures and phytoplankton, and d) adults and phytoplankton. Arrows indicate phase between combined time series. 0 degrees is in-phase and 180 degrees is anti-phase. Black contour lines show “cone of influence” or the 95% significance level, every value within the cone is considered significant. Left axis shows the temporal period, and the color legend shows wavelet frequency power, with low frequencies in blue and high frequencies in red. Plots show strong covariation of high common power at the 12-month period until the 1980s. This pattern is especially evident in plot c) and d). [Taken from (Winder et. al 2009)].

While wavelet and cross-wavelet analyses should not be the only tool used to explore data, due to its limitations with significance testing, it is still worth implementing to gain a better understanding of how time series variables relate to each other over multiple spatial and/or temporal scales. It is often helpful to combine multiple methods of analysis to get a larger sense of patterns in the data, especially in spatio-temporal research.

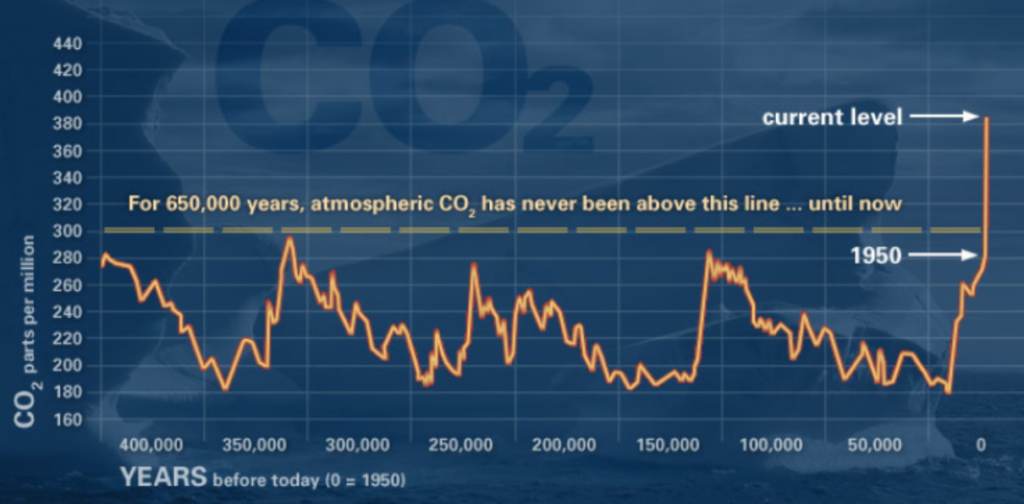
When conducting research within the context of climate change, where the concentration of CO2 in ppm in the atmosphere is a non-stationary time series itself (Figure 3), it is important to consider how our datasets might be impacted by climate change and wavelet analysis can help identify the scales of change. 

Figure 3. Plot showing the historic fluctuations of CO^2 and the recent deviation from normal levels. Source: https://globalclimate.ucr.edu/resources.html

When considering our ecological time series of data in Port Orford, we want to evaluate how changing ocean conditions may be related to data trends. For example, has the annual mean or variance of zooplankton abundance changed over time, and where has that change occurred in time or space? These changes might have occurred at different scales and might be invisible at other scales. I am eager to see if wavelet analysis can detect these sorts of changes in the abundance of zooplankton across our time series of data, particularly during the seasons of intense heat waves or upwelling. 

Did you enjoy this blog? Want to learn more about marine life, research and conservation? Subscribe to our blog and get a weekly email when we make a new post! Just add your name into the subscribe box on the left panel.

References

Buchan, S. J., Pérez-Santos, I., Narváez, D., Castro, L., Stafford, K. M., Baumgartner, M. F., … & Neira, S. (2021). Intraseasonal variation in southeast Pacific blue whale acoustic presence, zooplankton backscatter, and oceanographic variables on a feeding ground in Northern Chilean Patagonia. Progress in Oceanography, 199, 102709.

Cazelles, B., & Hales, S. (2006). Infectious diseases, climate influences, and nonstationarity. PLoS Medicine, 3(8), e328.

Salas, J. D., Anderson, M. L., Papalexiou, S. M., & Frances, F. (2020). PMP and climate variability and change: a review. Journal of Hydrologic Engineering, 25(12), 03120002.

Slater, L. J., Anderson, B., Buechel, M., Dadson, S., Han, S., Harrigan, S., … & Wilby, R. L. (2021). Nonstationary weather and water extremes: a review of methods for their detection, attribution, and management. Hydrology and Earth System Sciences, 25(7), 3897-3935.

Winder, M., Schindler, D. E., Essington, T. E., & Litt, A. H. (2009). Disrupted seasonal clockwork in the population dynamics of a freshwater copepod by climate warming. Limnology and Oceanography, 54(6part2), 2493-2505.

A little help from my friends to study gray whales in Port Orford

By Lisa Hildebrand, PhD student, OSU Department of Fisheries, Wildlife, & Conservation Sciences, Geospatial Ecology of Marine Megafauna Lab

The 2021 TOPAZ (Theodolite Overlooking Predators And Zooplankton) field season in Port Orford has come to a close. Its close also signals the end of my tenure as field project lead, after I took over from my predecessor Florence Sullivan (OSU/GEMM Lab MSc grad) in the summer of 2018. Allison Dawn, incoming GEMM Lab Master’s student, is my successor and I am excited to pass the torch to her and see what new directions she will take the project. In today’s post, I will not recap the field season as I often do at the end of August. However, I strongly encourage you to read the blog posts written by the JASPER (Journey for Aspiring Scientists Pursuing Ecological Research) interns that made up Team “Heck Yeah”, Nadia Leal, Damian Amerman-Smith, and Jasen White, as they did an excellent job summarizing what we saw and experienced over the last six weeks. Instead, I want to take this opportunity to highlight a few people in Port Orford (and their most memorable gray whale encounters) who created a home away from home for me in Port Orford and played a large part in creating rich and meaningful experiences during my time as field project lead.

Tom Calvanese. Source: WildHuman.

Up first is Tom Calvanese, the OSU Port Orford Field Station manager. The field station can be an extremely busy place, especially during the summer when ideal weather conditions allow many marine scientists to conduct their research. There can be a lot of comings and goings at the field station, with swift turnarounds between groups and individuals from different departments and projects; some staying just one night, while others (such as the TOPAZ field teams) stay for several weeks. Leigh and I like to call Tom “the man behind the machine” because he manages to keep this busy field station running smoothly. From the get go, Tom has been a solid rock for me in Port Orford and he has never hesitated to give me the time and attention I needed, be it because I was seeking him out for advice about how to handle a personnel issue, a lesson in how to tie strong knots, or just a friendly conversation at the end of a long field day. I know that I have found a life-long friend and colleague in Tom through this project and for this I am very grateful.

One of Tom’s most iconic gray whale encounters happened when he was kayak fishing with a few friends in Tichenor Cove (coincidentally one of the two TOPAZ study sites). The individual kayakers were scattered throughout the cove, all in search of a good spot to hook some rockfish or lingcod. The group had not been out on the water for very long, which likely plays a large part in the shock and surprise that comes next, when Tom suddenly heard the blow of whale. He looked up from his fishing in the direction of the blow, only to see that a gray whale was surfacing right underneath one of his kayak fishing friends. Said friend could do nothing as he sat paralyzed in his kayak which slowly slid off the back of the gray whale as it dove once again. Neither whale nor human was harmed in this encounter, as the whale went back to foraging in the area, and the human (after several minutes of incredulity) went back to fishing. Every year, Tom has warned me of this location where this interaction happened (an uncharacteristically deep spot in Tichenor Cove compared to the rest of the area), though his warning is always accompanied with a twinkle in his eye.

An image captured by 2018’s Team “Whale Storm” aboard the kayak while sampling in Tichenor Cove, Port Orford. Source: GEMM Lab.
Dave Lacey. Source: L Hildebrand.

Dave Lacey owns South Coast Tours (SCT), a tour operating business that offers boat, kayak, and snorkeling tours, as well as surf lessons. Dave has been one of the most generous individuals to the TOPAZ/JASPER projects, never hesitating to loan us wetsuits and/or kayaks and allowing us to use his office and storage areas every day. He has also delivered excellent kayak paddle & safety instruction to the field teams over the last two years. Dave has truly become a vital partner during the Port Orford field seasons. It has been such a pleasure to be able to learn from and work with him, as well as see his business grow each year. Even though I will not be leading the project in Port Orford anymore, I am excited to continue my working relationship with Dave through obtaining important photo identification and sighting data of gray whales in the area when the GEMM Lab team is not there.

Although SCT is not even 10 years old (though it will be next year in 2022!), Dave has had so many gray whale encounters that he said it was really hard for him to pick just one. However, he ultimately picked the first time that he smelled a gray whale’s breath. It happened during a kayak tour when the group rounded the corner from Tichenor to Nellie’s Cove and a whale suddenly surfaced right in front of everyone, hitting them with the misty cloud of its blow. Up until this moment, Dave had both seen and heard hundreds of whale blows, but had never smelled one. He says, “to hear and see [the blow] is pretty normal but to get the third sense [of smell] is really phenomenal.”. Upon asking what he thinks of the smell, Dave replied that he does not think it is as gross as some people may think and during tours on his boat, the Black Pearl, he now actually tries to (safely) maneuver the boat downwind of the blow so that his clients can get a whiff as well.

The misty cloud emitted by whales when they come to the surface to breathe is referred to as the “blow”. Source: GEMM Lab.
Mike Baran. Source: L Hildebrand.

Mike Baran is a co-owner of Port Orford Sustainable Seafood (POSS) and he also occasionally guides kayak and snorkel tours for SCT. POSS is a community supported fishery that delivers wild, line-caught seafood direct from Port Orford to communities throughout western Oregon. I developed a great friendship with Mike through seeing him on the water a lot as a kayak guide for SCT in my first summer leading the TOPAZ/JASPER projects (2018), as well as seeing him at the field station on most days since POSS’ office and fish-processing facility are located there as well. If you are a keen follower of the GEMM Lab blog, you will know by now that the field season in Port Orford is short, yet very intense and taxing. Therefore, uplifting and sometimes goofy interactions with someone can really turn an upsetting day (potentially due to kayak gear loss or simply exhaustion) into a better one. Mike provided me with a lot of uplifting and goofy interactions and always helped put a smile on my face. 

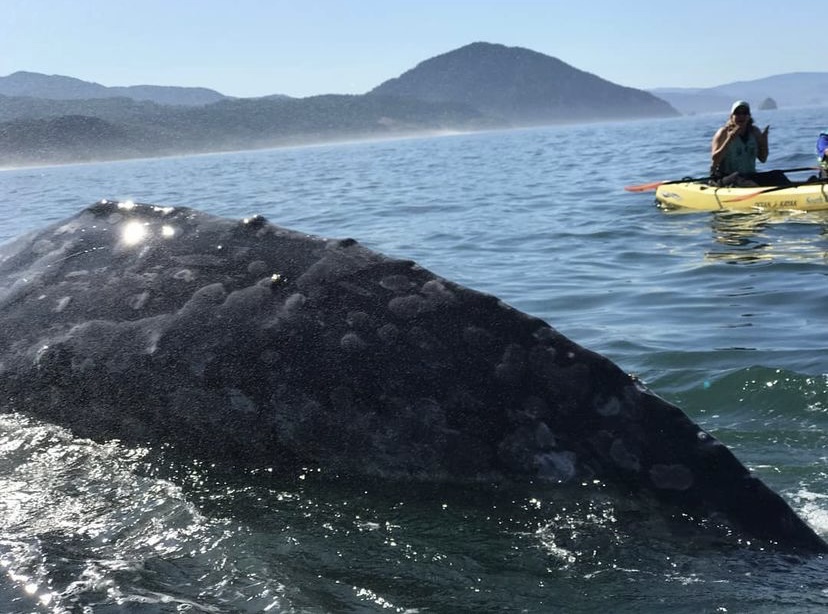
As a SCT kayak guide, Mike has also had many gray whale encounters, however none are as memorable as the one he had on August 2nd, 2019. Mike describes it as a typical Port Orford day: “windy with lots of whale activity all morning”, though all of the activity had been at a distance (the whale blows were far away). Yet, on the paddle back through Tichenor Cove along the backside of the port jetty, Mike and his tour glimpsed a whale that was headstanding along the jetty rocks. The paddlers slowed down and kept their distance, watching as the gray whale foraged, diving down for 3-4 minutes at a time before resurfacing in almost the same location as it had surfaced in before. Suddenly, the whale surfaced right in the middle of the kayak group, with Mike to its left, a mere meter or so away, and the rest of the group to its right. Despite the fact that the sudden appearance of the whale scared the living daylights out of Mike, he was able to take a picture of the surfacing, which features one of the tour clients in the background with her hands lifted up to her face in total shock. So, thankfully for us the moment is not just eternalized in Mike’s memory but also in photographic form.

The photo of the gray whale that surfaced right next to Mike’s kayak, which also captured the shock & surprise of one of the tour clients in the background. Source: South Coast Tours.
Tara Ramsey. Source: L Hildebrand.

Last but certainly not least is Tara Ramsey, the coordinator of the Redfish Rocks Community Team since the summer of 2020. Despite arriving to Port Orford and her job in the middle of a pandemic, Tara has developed a lot of exciting new outreach and education material for the Redfish Rocks Marine Reserve, including an excellent walking tour of Port Orford (if you are ever there, I cannot recommend it highly enough – it starts at the Visitor Center!). While I have not known Tara as long as the other individuals featured in this blog, she has become a really great friend of mine, teaching me a lot about the reserve and Port Orford in general, including the best spot on Battle Rock beach for a small nighttime bonfire. 

Tara’s most memorable encounter with a gray whale is in fact her only encounter with a gray whale to date, and it happened just a few weeks ago when she was doing an Instagram livestream of the Redfish Rocks Marine Reserve aboard SCT’s Black Pearl. The purpose of the livestream was to bring the public into the reserve without having to leave the comfort and current safety of their homes. Tara describes the conditions in the reserve as “quite eerie” that day as there was a combination of smoke, fog, and no wind in the air. These conditions resulted in some pretty poor visibility, but gave the reserve an almost mystical appearance. Tara was actually mid-sentence on the livestream, talking about how special this moment was for her because it was her first time being in the reserve, when a whale surfaced a few meters from the boat. While the encounter was brief (the whale only surfaced 3 or 4 times before disappearing into the fog), Tara says the vision will be etched in her memory forever as Redfish Rocks is “a circle of islands, kind of like an amphitheater and it was amazing to see the whale just in the middle of it all.” 

An aerial view of Redfish Rocks Marine Reserve. Source: FishTracker.

I will miss being the field project lead of the TOPAZ and JASPER projects. I will miss kayaking every other day and spying on gray whales from the cliff site. I will miss having the opportunity to work closely with and train a new crop of aspiring marine scientists. I will miss my daily interactions with Tom, Dave, Mike, Tara, and many more individuals, when I do not go to Port Orford for six weeks next summer. I will cherish all the memories I have amassed over my last four summers in Port Orford for a very long time. Most of all, I will always be grateful to the gray whales that brought me back every summer and who (in a way) made all those memories happen.

PI Leigh Torres and Lisa at the end of the 2021 TOPAZ field season in Port Orford after the annual community presentation with Battle Rock Beach, Humbug Mountain, and Redfish Rocks Marine Reserve in the background. Source: L Torres.

The Unpredictable Nature of Field Work & a Mystery Mysid

By Jasen C. White, GEMM Lab summer intern, OSU senior, Department of Fisheries, Wildlife, and Conservation Sciences

Field work is predictably unpredictable. Even with years of experience and exhaustive planning, nature always manages to throw a few curveballs, and this gray whale foraging ecology field season is no exception. We are currently in our sixth week of data collection here in Port Orford, and we have been battling the weather, our equipment, and a notable lack of whales and their zooplankton prey. Throughout all of these setbacks, Team “Heck Yeah” has lived up to its mantra as we have approached each day ready to hit the ground running. When faced with any of our myriad of problems, we have managed to work collaboratively to assess our options and develop solutions to keep the project on track. 

For those of you that are unfamiliar with Port Orford, it is windy here, and when it is not, it can be foggy. Both of these weather patterns have the potential to make unsafe paddling conditions for our kayak sampling team. This summer we have frequently delayed or altered our field work routines to accommodate these weather patterns. Occasionally, we had to call off kayaking altogether as the winds and swell precluded us from maintaining our boat “on station” at the predetermined GPS coordinates during our samples, only for the winds to die down once we had returned to shore and completed the daily gear maintenance. Despite weather challenges, we have made the most of our data collection opportunities over these past six weeks, and we have only been forced to give up four total days of data collection. Flexibility to take advantage of the good weather windows when they arrive is the key!

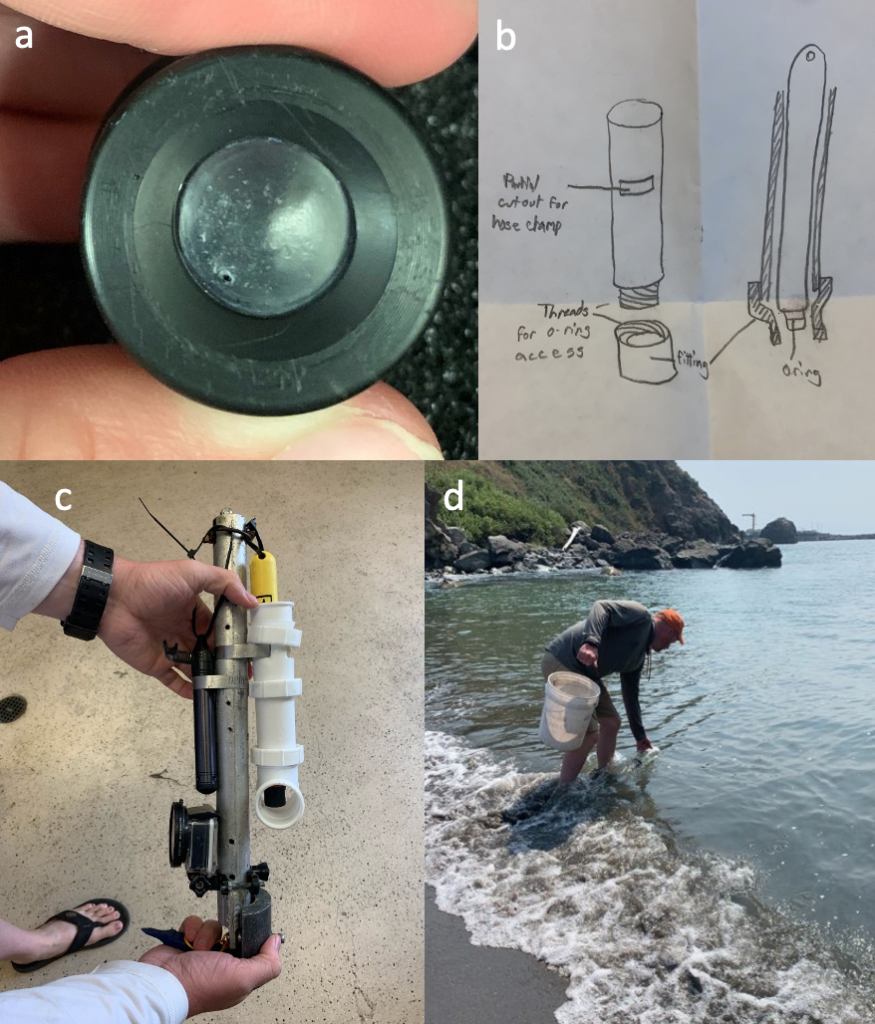
Equipment issues can be even more unpredictable than the weather. The first major stumbling block for our equipment was a punctured membrane in the dissolved oxygen probe that we lower into the water at each of our twelve sample locations. This puncture was likely the result of a stray urchin’s spine that was in the wrong place at the wrong time. Soon after noticing the problem, we quickly rallied to refurbish the membrane, recalibrate the sensor, and design a protective housing using some plumbing parts from the local hardware store to prevent any future damage to the membrane (Figures 1a-d). Within 6 days, we were back up and running with the dissolved oxygen sensor.

Figure 1. a) Punctured dissolved oxygen sensor membrane; b) plans for constructing a protective housing for the sensor; c) the new protective housing for the dissolved oxygen sensor (yellow) is attached to the sensor array; d) intern Jasen White measuring seawater for the dissolved oxygen sensor calibration after replacing the punctured membrane. Source: A. Dawn

The next major equipment issue involved a GoPro camera whose mounting hardware snapped while being retrieved at a sample site. This event was captured on the camera itself (see below). Fortunately, thanks to our collaborators at the Oregon Institute of Marine Biology, we were soon able to recover the lost GoPro camera, and in the meantime, we relied on our spare to continue sampling. 

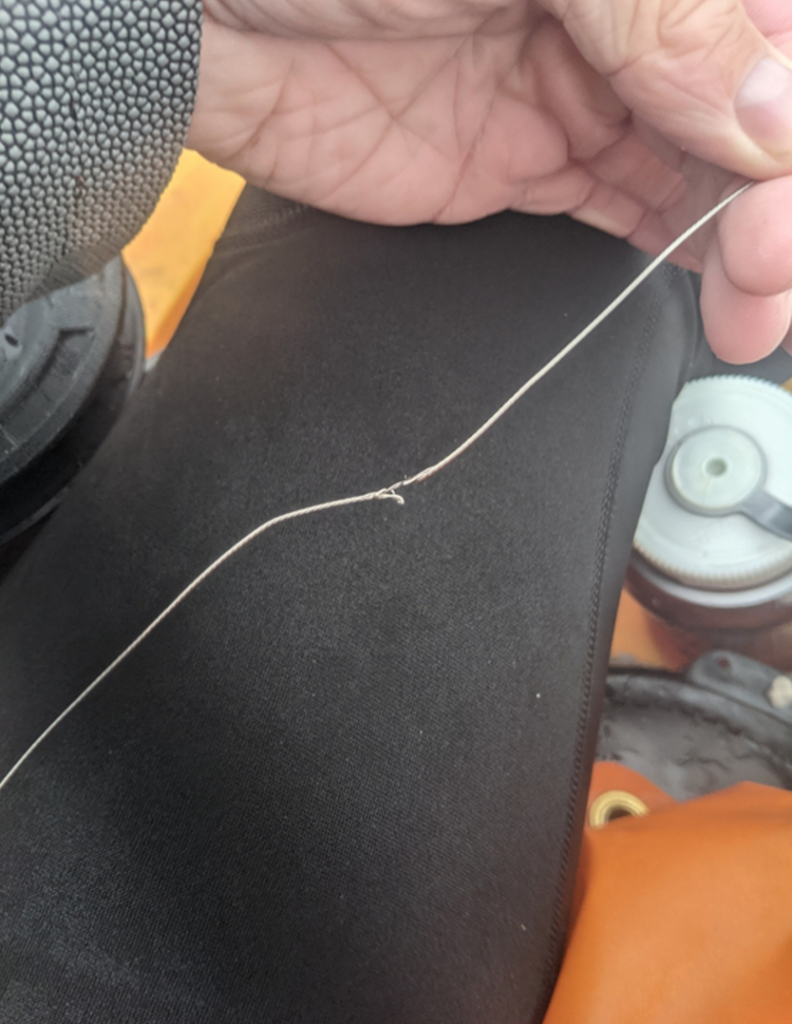
Figure 2. The steel cable of the downrigger used to deploy and retrieve our sensor array had worn down until only two strands remained intact. Source: J. White.

The most recent equipment problem was a fraying cable (Figure 2) on our downrigger. We use the downrigger as a winch to lower and raise our sensor array and zooplankton nets into the water to obtain our samples. Fortunately, keen eyes on our team noticed the fray before it fully separated while the sensor array was in the water which could have resulted in losing our gear. We were quickly able to find the necessary repair part locally and get back on the water to finish out our sample regime within an hour of noticing the problem. 

Finally, as Damian mentioned in his post last week, this season seemed to start much slower than the previous field seasons. In the early weeks, many of our zooplankton sampling nets repeatedly came up almost empty. There was often nothing but murky water to see in the GoPro videos that accompany the zooplankton samples. Likely due to the lack of prey, we have only managed to spot a couple of transitory whales that rarely entered our study area. Those few whales that we did observe were difficult to track as the relatively high winds and waves quickly dissipated the tell-tale blows and camouflaged their briefly exposed backs and flukes. 

Our determination and perseverance have recently started to pay off, however, as the prey abundance in at least some of our sample sites has begun to increase. This increase in prey has also corresponded to a slight increase in whale sightings. One whale even spent nearly 30 minutes around the sampling station that consistently yields the most prey, likely indicating foraging behavior. These modest increases in zooplankton prey and whale sightings provide more evidence in support of the hypothesis Damian mentioned last week that reduced whale abundance in the area is likely the result of low prey abundance.

Figure 3. Example of a previously unidentified mysid that dominates several of our zooplankton samples. Due to the unique fat and flat telson (the “tail”) portion, we have been affectionately calling these “beavertail” mysids. Source: J. White.

As the zooplankton abundance finally started to increase, we noticed an interesting shift in the kinds of prey that we are capturing compared to previous seasons. Donovan Burns, an intern from the 2019 field season, noted in his blog post that the two most common types of zooplankton they found in their samples were the mysid species Holmesimysis sculpta and members of the genus Neomysis. While Neomysis mysid shrimp are continuing to make up a large proportion of our prey samples this year, we have noticed that many of our samples are dominated by a different type of mysid shrimp (Figure 3) which, in previous years, was a very rare capture. After searching through several mysid identification guides, this unknown mysid appears to be a member of the genus Lucifer, identified based on the presence of some distinctive characteristics that are unique to this genus (Omori 1992). 

This observation is interesting because historically, Lucifer mysid shrimp are typically found in warmer tropical and subtropical waters and were rarely reported in the eastern North Pacific Ocean before the year 1992 (Omori 1992). Additionally, a key to common coastal mysid shrimp of Oregon, Washington, and British Columbia does not include members of the Lucifer genus, nor does it include any examples of mysids that resemble these new individuals showing up in our zooplankton nets (Daly and Holmquist 1986). If our initial identification of this mysid species is correct, then the sudden rise in the abundance of a typically warm water mysid species in Port Orford may indicate some fascinating shifts in oceanographic conditions that could lend some insight into why our prey and subsequent whale observations are so different this year than in years past.

Figure 4. View from the cliff site where we track gray whales using a theodolite. Source: A. Dawn.

As the 2021 field season draws to a close in Port Orford, I cannot help but reflect on what a wonderful opportunity we have been given through this summer internship program. I have loved the short time that I have spent living in this small but lively community for these past five weeks. Most days we could either be found kayaking around the nearshore to sample for the tiny creatures that our local gray whales call dinner, or we were on a cliff, gazing at the tirelessly beautiful, rugged coastline (Figure 4), hoping to glimpse the blow of a foraging whale so that we could track its course with our theodolite. Though the work can be physically exhausting during long and windy kayaking trips, mentally taxing when processing the data for each of the new samples after a full day of fieldwork, or incredibly frustrating with equipment failures, weather delays and shy whales, it is also tremendously satisfying to know that I contributed in a small but meaningful way to the mission of the GEMM Lab. I cannot imagine a better way to obtain the experience that my fellow interns and I have gained from this work, and I know that it will serve each of us well in our future ambitions.

References

Daly, K. L., and C. Holmquist. 1986. A key to the Mysidacea of the Pacific Northwest. Canadian Journal of Zoology 64:1201–1210.

Omori, M. 1992. Occurrence of Two Species of Lucifer (Dendrobranchiata: Sergestoidea: Luciferidae) off the Pacific Coast of America. Journal of Crustacean Biology 12:104–110.

Where are all the whales: Thoughts from the first half of the Port Orford project 2021

By Damian Amerman-Smith, Pacific High School senior, GEMM Lab summer intern

Left to right: Damian, Nadia, Jasen. The group scans the ocean looking for whales, while Damian puts on sunscreen. Source: A. Dawn. 

Growing up in Port Orford, a short ten-minute walk from the Pacific Ocean, has certainly shaped my life a lot. It has given me a great regard for the ocean, the diversity of life within it, and how life seems to bypass human derived borders in order to go wherever it can. I often marvel at all the beautiful, intricate ecosystems that are able to exist inside of our planet’s vast oceanic expanses. Along with my love of the ocean has come a great regard for marine mammals and the novelties of these animals that allow them to live entirely in the ocean despite not having gills. Every new discovery of these beautiful ocean creatures brings me such simple and pure joy, such as my very recent discovery that baleen whales have two blow holes. These blow holes look so peculiar on the top of their bodies, like a short upside-down nose. 

Photo of a gray whale’s blow hole. Source: NOAA.

My interest in the ocean and its inhabitants was a large part of what made me so enthused to take a part in the gray whale foraging ecology (GWFE) project in Port Orford this summer. When Elizabeth Kelly, my friend and a previous intern for the GWFE project mentioned her experiences from the previous summer, I was very happy when she put me in contact with Lisa Hildebrand and Leigh Torres so that I could apply to be an intern. Since then, I have been very ecstatically awaiting the beginning of the project and could hardly believe it when it finally began, and I was able to meet my fellow team members: Lisa Hildebrand, the PhD student who has been leading the GWFE project for the last four years; Allison Dawn, a Master’s student who is going to take over the project in Lisa’s stead; Nadia Leal, an OSU undergrad hoping to further pursue the field of marine biology; and Jasen White, an OSU undergrad whose time in the Navy has made him a very steeling presence while out on the water. 

The three weeks that we have spent together learning the procedures that make up the project have been well spent, teaching all of us a lot of new things, such as what a theodolite is, how to operate a dissolved oxygen sensor, and (for me) how to use Excel. The first two weeks were largely spent just learning about how we collect data and improving our field skills, but as we have become more comfortable with our skills, we have also begun looking beyond the procedures, towards the data itself and what it can mean. Primarily, we started to notice the distinct lack of gray whales and almost complete lack of zooplankton prey for any gray whales in the area to eat. 

A calm & beautiful, yet whale-less, view from the cliff site. Source: L. Hildebrand.

As we pass the halfway point in the project, we have only witnessed two whales inside our study area. While in the beginning it was not surprising that there were no whales, it has started to become concerning to me. We have a strong working hypothesis about why there have not been many whale sightings in our monitored sites of Mill Rocks and Tichenor’s Cove: there is not nearly enough zooplankton prey to attract them. Monday, August 9th is a good example to support this hypothesis. On that day, when we pulled up our sample net at Tichenor Cove station #1, we collected fifty-three individual Neomysis mysid shrimp, which are a tasty treat for gray whales. However, all the other prey samples from the remaining eleven kayak sampling stations had perhaps a maximum of five assorted zooplankton each, which is certainly not enough to attract the attention of such a large predator as Eschrichtius robustus (a gray whale). Unfortunately, we have yet to see much change in zooplankton prey availability in our sampling nets over the season so far, but we are hopeful that swarms of zooplankton in the area will resurge and the gray whales will begin using the area around the port as their August feeding grounds.

Our hopes aside, it is intriguing to think about why there has been so few zooplankton at our sampling sites. A main factor is likely the decrease of Port Orford’s kelp forests over the past few years. Kelp is very important to zooplankton, particularly mysids, as it allows them to seek shelter from predators. Declines in kelp forests have been documented all along the southern Oregon coast, and are believed to be fueled by many factors (ORKA, 2021). A combination of warming waters with decreasing amount of nutrients available to the kelp (Richardson 2008), and the increasing abundances of purple sea urchins that eat the kelp has vastly impacted the amount of kelp in the area. The decline in local kelp forests may be the reason that we are seeing fewer mysid swarms than in previous years. This reduced kelp and mysid availability could, in turn, be making Port Orford waters an unappetizing area for hungry whales to visit this year. While this trophic cascade is still just an educated hypothesis, it is important for us and others to keep watch on the situation, and to see how it changes. There are organizations such as the Oregon Kelp Alliance (ORKA) that are working hard to study why the kelp populations are hurting and how we can help. We will power through the season with the hopes that the gray whales will come. It is still very possible that the zooplankton will resurge and the whales will return with plenty to feed on.

References

Richardson, Anthony J. 2008. In hot water: zooplankton and climate change, ICES Journal of Marine Science, Volume 65, Issue 3, Pages 279–295, https://doi.org/10.1093/icesjms/fsn028

ORKA, 2021. “Kelp.” Oregon Kelp Alliancewww.oregonkelp.com/.

Food for thought: conscious reasoning among foraging gray whales

By Nadia Leal, GEMM Lab summer intern, OSU senior, Department of Fisheries, Wildlife, and Conservation Sciences

The OSU GEMM Lab gray whale foraging ecology project in Port Orford is in its seventh year of research. I have the honor to serve as a field assistant for the project as part of Team “Heck Yeah” for the summer 2021 field season. In doing so, I have been presented with the opportunity to take part in its enduring legacy. It is a legacy characterized by novel discovery, distinguished leadership, and endless adventure. These particular aspects motivated me to pursue this internship. Further, the desire to seek out gray whales (Eschrichtius robustus) — a species epitomizing the ability to exhibit resilience in the face of adversity after having experienced two unusual mortality events (UME) in the past two decades and having recovered from historically low population abundances due to whaling — sparked immeasurable excitement.

Figure 1. Nadia operating the theodolite to calculate the location of a gray whale. Source: A. Dawn.

The skills we are acquiring during this field season are essential to master so that I can pursue my aspirations of becoming a marine conservation biologist. For example, we have learned how to operate a theodolite, which is a surveying tool used regularly in marine mammal research to accurately calculate the location of cetaceans and track their movements (Figure 1). We are also learning how to operate a number of other research equipment, to navigate a tandem kayak using a GPS, to process various forms of data, and to identify gray whales! I have especially enjoyed collecting prey samples and navigating our tandem kayak, as kayaking is a summer tradition for my family and the opportunity to kayak in this context is certainly the high point of this internship. The kayak is named “Robustus” after the scientific name of the gray whale: Eschrichtius robustus! (Figure 2). 

Figure 2. Nadia navigating Robustus, the research kayak.

The Port Orford project aims to determine how gray whale foraging is affected by prey quantity and quality. In fact, gray whales exhibit specificity in their selection of prey on the basis of caloric content (Hildebrand 2020). I am particularly interested in the underlying implications these findings imply: the notion of conscious reasoning and decision-making by individual whales as they seek the most suitable prey for its dietary needs among other options to maximize its survivability. Are gray whales in possession of an awareness that allows them to exhibit intentional preference? Can the behavior be attributed to instinct and/or learned behavior, or to cognition comparable to human preference? These and similar questions are my motivation for studying the realm of marine mammal biology. These questions concern intelligence and evolution, which can be effectively investigated through an analysis of cetacean brain structure, as it likely has compelling relationships to their extensive behavioral abilities (Hof and Van Der Gucht 2007). 

For instance, the brain of the gray whale has expanded and developed extensively over evolutionary time in response to distinct selection pressures. Evidence affirms that the behavioral challenges associated with foraging exert strong selection pressures on the evolution of their brain size and structure (Muller and Montgomery 2019)! Selection pressures associated with social cognition are also believed to have contributed to such growth (Connor et al. 1998; Marino 2002; Shultz and Dunbar 2010 ). Further, their neural organization has increased in complexity, leading to greater function and usage of the cortical portion of the brain, which is the portion responsible for higher level activity (Oelschläger and Oelschläger 2002). 

Figure 3. Structure of humpback whale brain representative of baleen species used to infer about gray whales (Hof and Van Der Gucht 2007). 

Though research about baleen whale brain morphology is not as pervasive as that of toothed whales (due to increased susceptibility of toothed whales to captivity given the feasibility of their capture and subsequent analysis in lab/controlled setting), studies have indicated that the brain of baleen whales share similarities to those of humans (Wade et. al 2012). In particular, similarities exist in the frontal lobe of the brain, which is responsible for the complex activities of self-awareness, reasoning, and behavior, as well as for problem-solving and motivation (Hof and Van Der Gucht 2007) (Figure 3). These findings indicate that baleen whales, including the gray whale, have the capability to exhibit intentional preference and take part in conscious decision-making in the recognition of different prey species. The mechanisms responsible for how gray whales may discern prey likely involve a number of the sensory systems, differing in respect to spatial scale (Torres 2017). Thus, gray whales likely rely on various sensory methods, such as vision, sound perception/reception, chemoreception, or an oceanographic stimulus, at differing scales to locate and discern prey. The sensory method employed is dependent on their distance from prey. 

Though we cannot yet confirm whether and/or how gray whales are capable of distinguishing between prey species, what is certain, is that the gray whale is intelligent and quite similar to us. Moreover, they are representative of strength and endurance, providing lessons we can learn from and qualities we can embody. Despite the threats to the species from fishing gear entanglement, ship collisions, climate change, oil industry developments, and being historically hunted, they have remarkably persisted. Thus, we must ensure the existence of the gray whale so they too may thrive for the rest of time, with healthy lives and habitat that is rightfully theirs.

P.S. I would like to thank the GEMM Lab, Oregon State University, Shalynn Pack, Port Orford Sustainable Seafood, Port Orford Co-op, South Coast Tours, Nicki’s Knick Knacks, Leigh Torres, Lisa Hildebrand, Allison Dawn, Clara Bird, Tom Calvanese, Maddie English, Jasen White, and Damian Amerman-Smith for making the internship as special and memorable as it is/was. 

References

Connor, R. C., Mann, J., Tyack, P. L., and Whitehead, H. (1998). Social evolution in toothed whales. Trends in Ecology and Evolution, 13(6): 228– 232. doi: https://doi.org/10.1016/S0169‐5347(98)01326‐3 

Hildebrand, L. (2020). Tonight’s specials include mysids, amphipods, and more: an examination of the zooplankton prey of Oregon gray whales and its impact on foraging choices and prey selection. Master’s thesis, Oregon State University. 

Hof, P.R., and Van Der Gucht, E. (2007). Structure of the cerebral cortex of the humpback whale, Megaptera novaengliae(Cetacea, Mysticeti, Balaenopteridae). The Anatomical Record 290:1-31 doi: 10.1002/ar.a.20407

Marino, L. (2002). Convergence of complex cognitive abilities in cetaceans and primates. Brain, Behavior, and Evolution59: 21–32. doi:  https://doi. org/10.1159/000063731 

Oelschläger, H.A., and Oelschläger, J.S. (2002). Brains. In: Perrin WF, Wu¨ rsig B, Thewissen JGM, editors. Encyclopedia of marine mammals. San Diego, CA: Academic Press. p 133–158.            

Shultz, S., & Dunbar, R. (2010). Encephalization is not a universal macroevolutionary phenomenon in mammals but is associated with sociality. Proceedings of the National Academy of Sciences of the United States of America 107(50): 21582–21586. doi: https://doi.org/10.1073/ pnas.1005246107 

Torres, L.G. (2017). A sense of scale: foraging cetaceans’ use of scale-dependent multimodal sensory systems. Marine Mammal Science 33: 1170-1193. doi:  10.1111/mms.12426 

Wade, P.R., Reeves, R.R., and Mesnick, S.L. (2012). Social and behavioral factors in cetacean responses to overexploitation: are odontocetes less “resilient” than mysticetes?. The Journal of Marine Biology 2012: 1-15. doi:10.1155/2012/567276