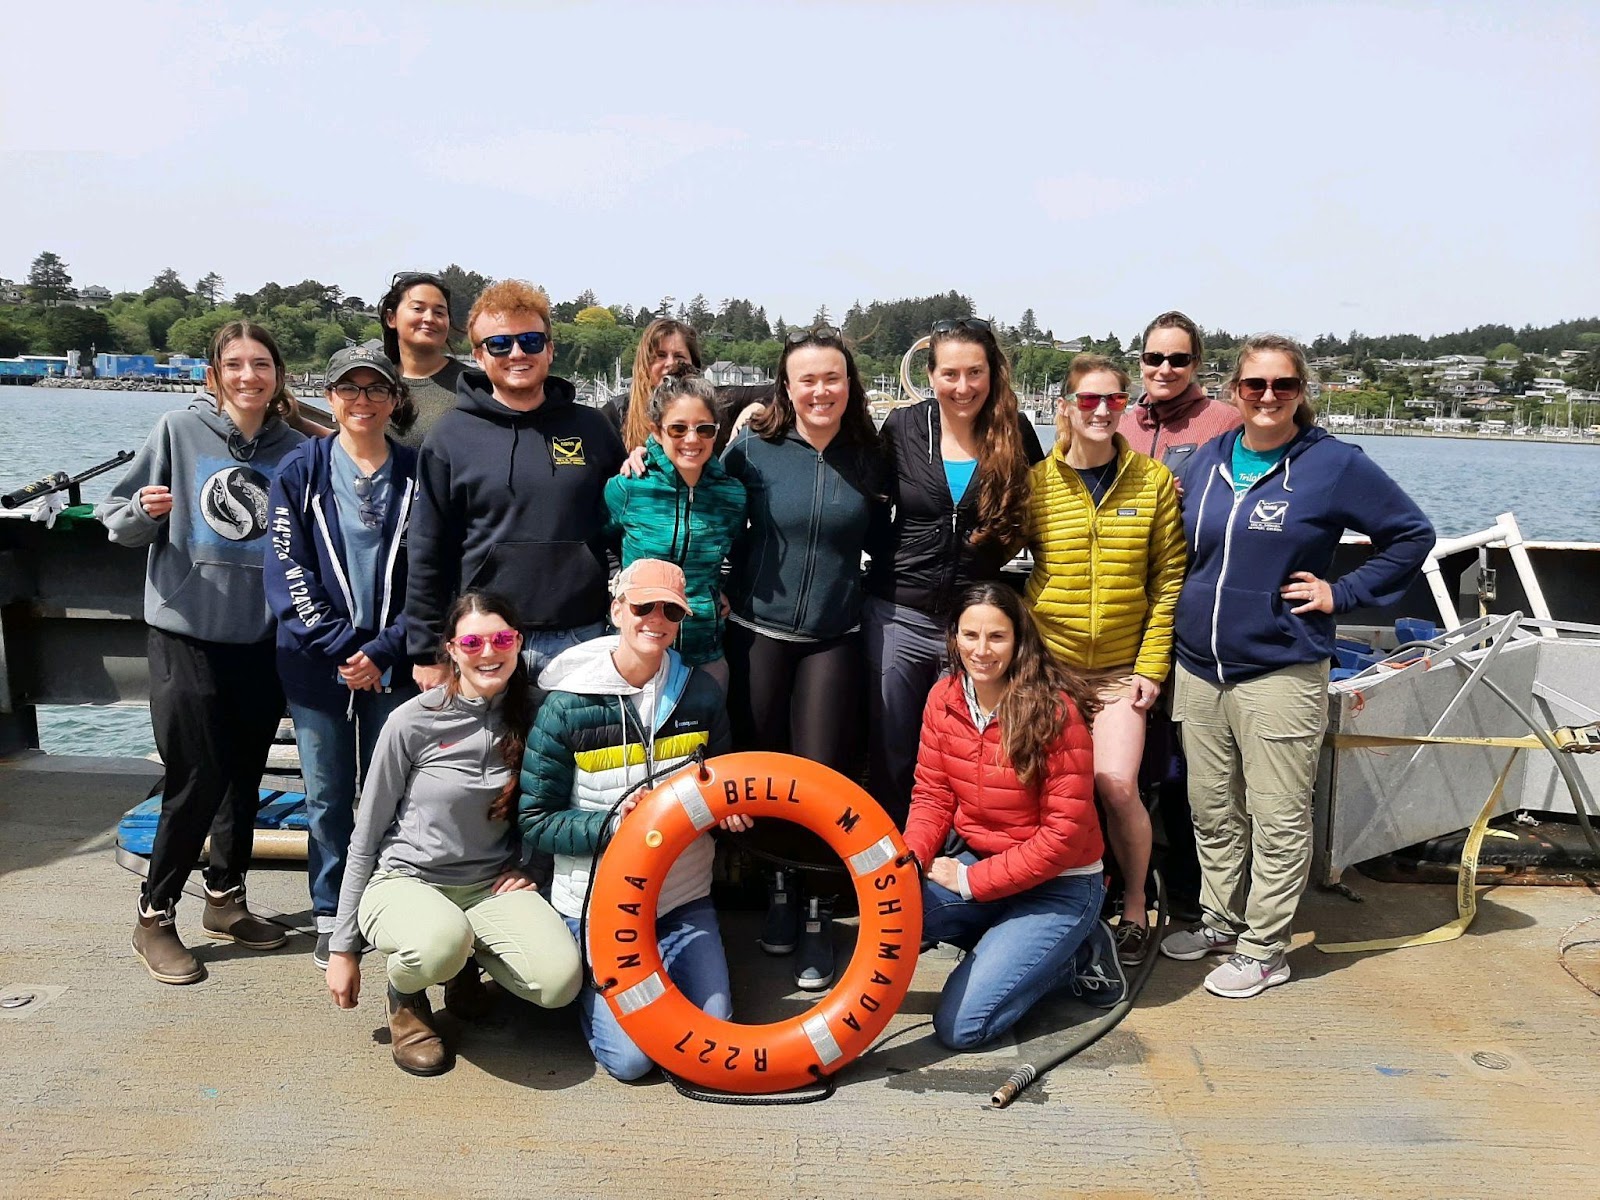
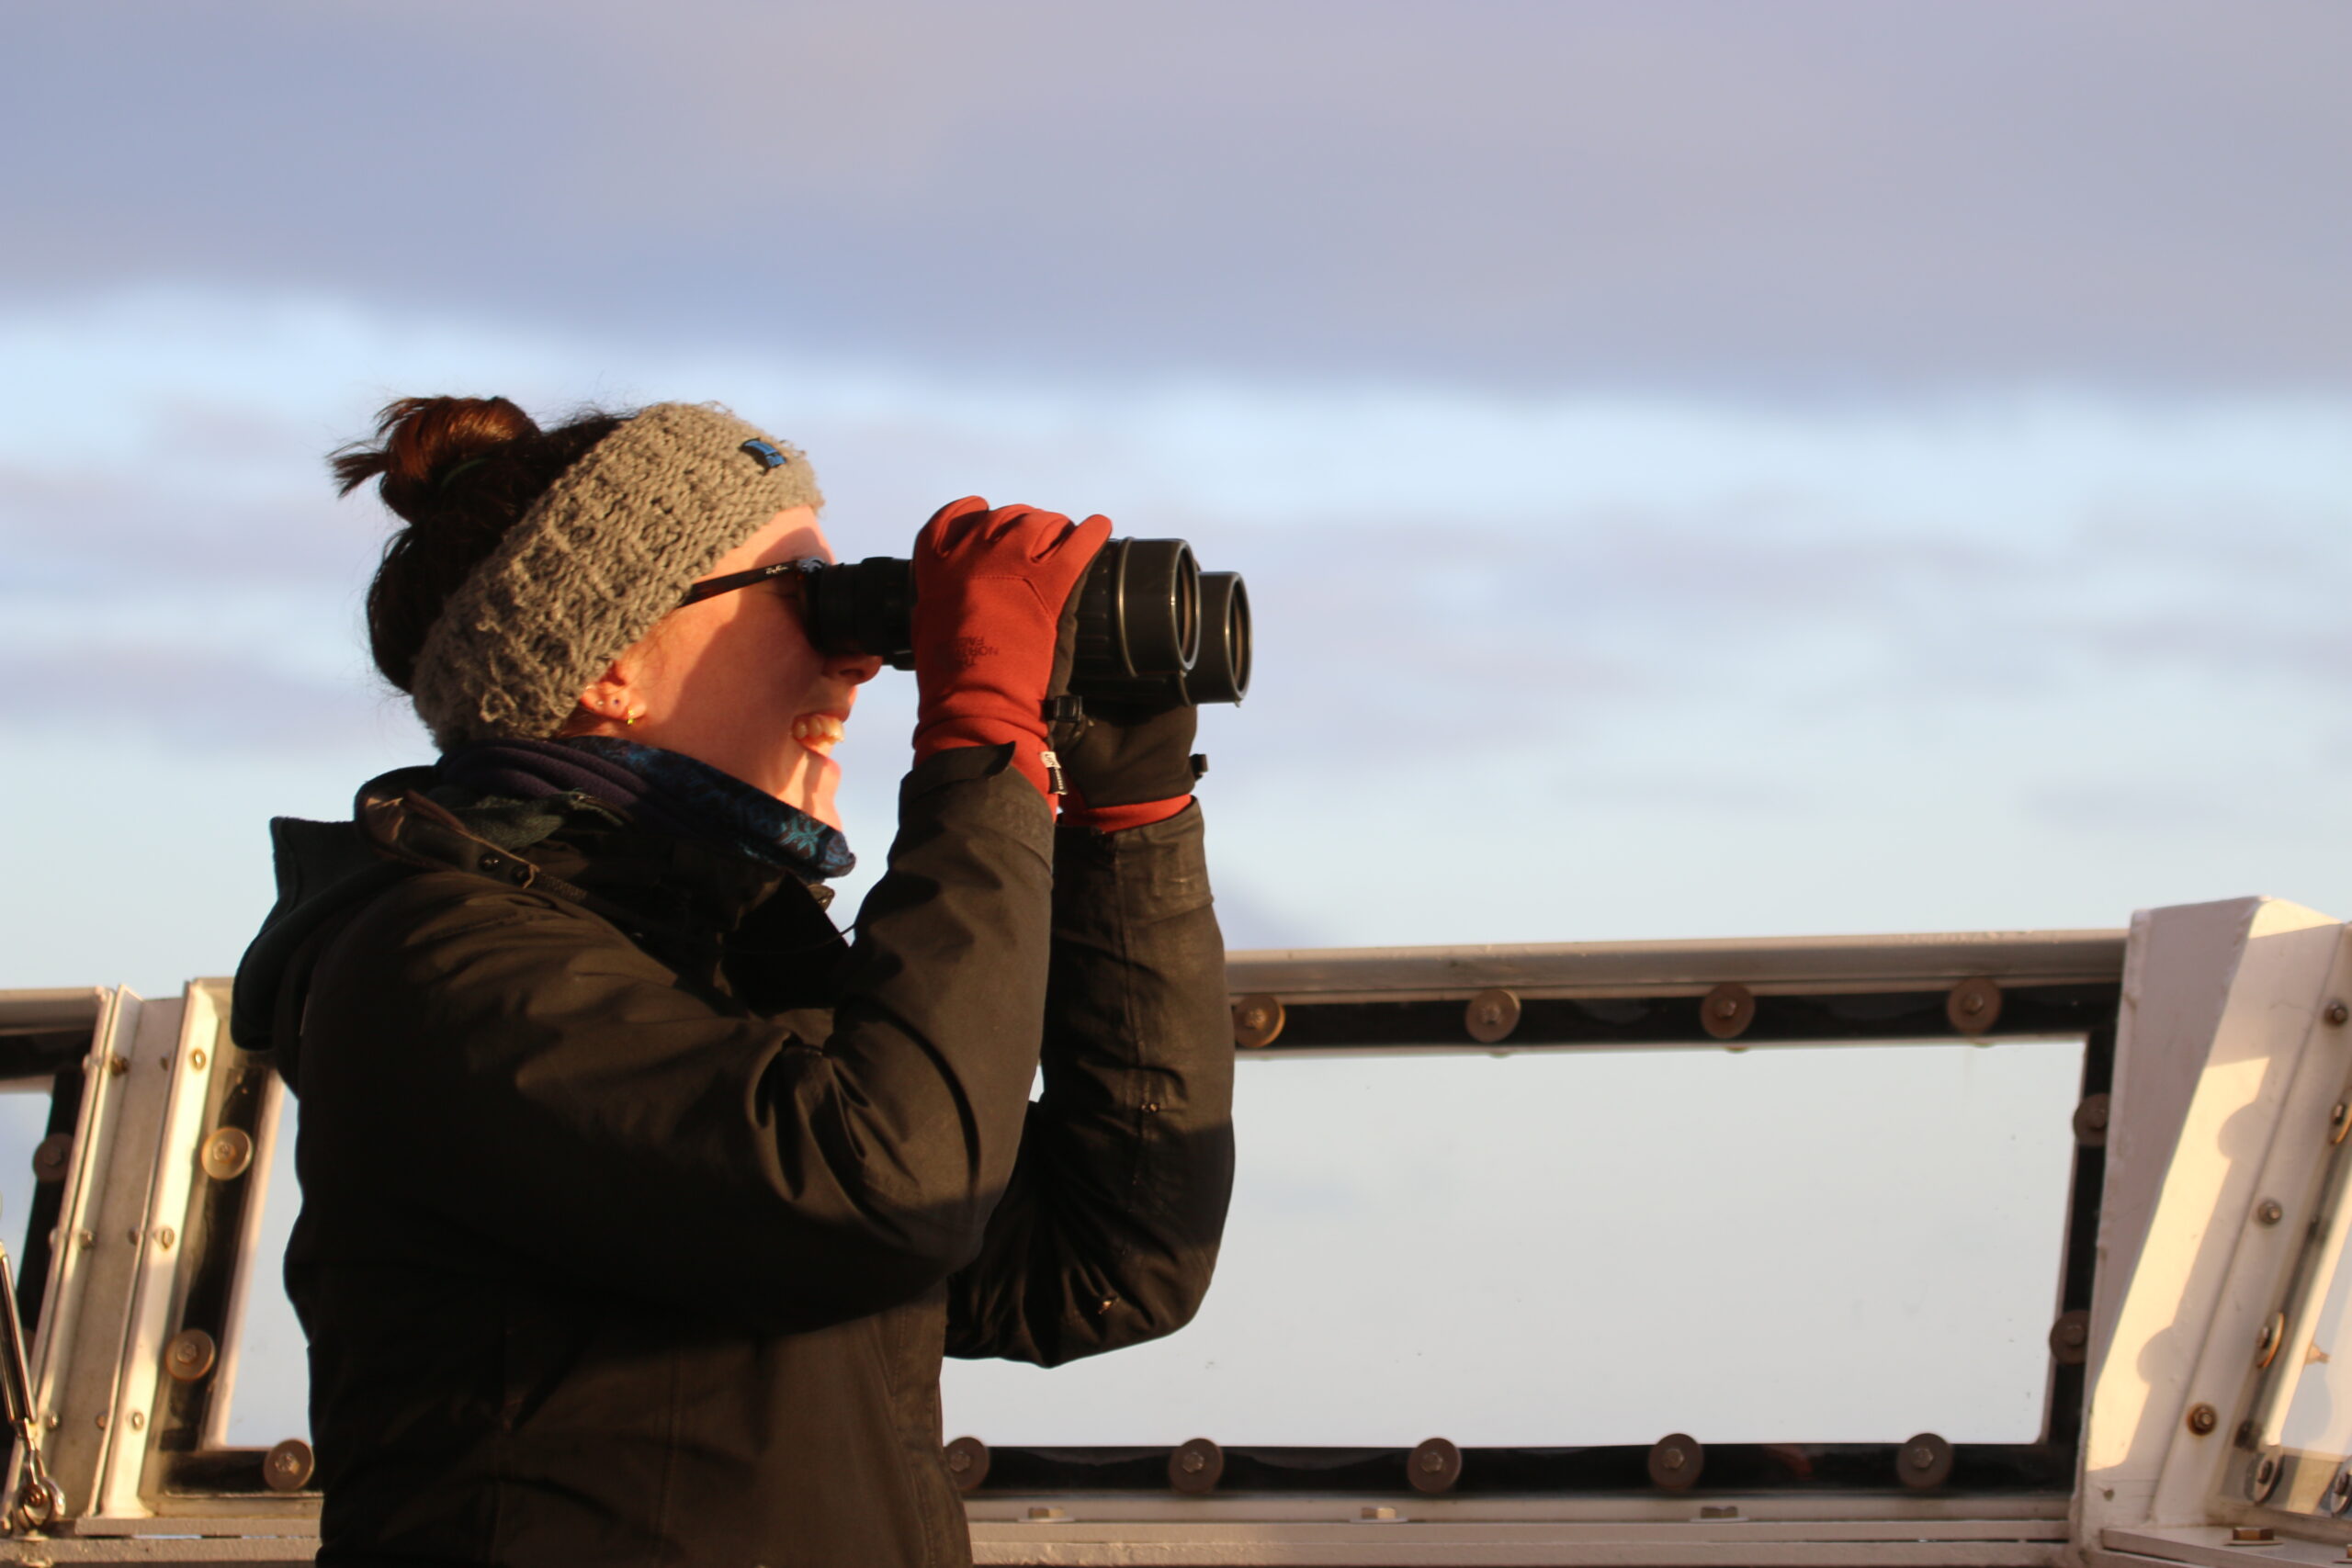
Clara Bird, PhD Candidate, OSU Department of Fisheries, Wildlife, and Conservation Sciences, Geospatial Ecology of Marine Megafauna Lab
We need energy to function and survive. For animals in the wild who may have limited food availability, knowing how they spend their energy is a critical question for many scientists because it fundamentally informs how we understand their decisions about where they go and what they do. The entire field of foraging theory is founded on the concept that animals optimize their ratio of energy in and energy out so that they have enough energy to survive, reproduce (pass on their genes), watch out for threats, if need be, and rest. And, if we understand an animal’s ‘typical’ energy budget, we can then try to predict how disturbance or environmental change will affect their actual energy budgets as a consequence of that change. But how do we measure energy expenditure?
The most commonly measured energy currency is oxygen. Since our cells use oxygen to produce energy (this is why we need oxygen to live), we can measure oxygen consumption as a metric of energy expenditure. The more oxygen we consume, the more energy we’re expending. In ideal lab settings, oxygen consumption can be accurately measured by placing the subject in a chamber where the oxygen flow can be controlled (Speakman, 1999). However, you can probably see how that approach is problematic for measuring oxygen consumption in most large free-living animals, especially cetaceans. It isn’t exactly feasible to put a whale in a box.

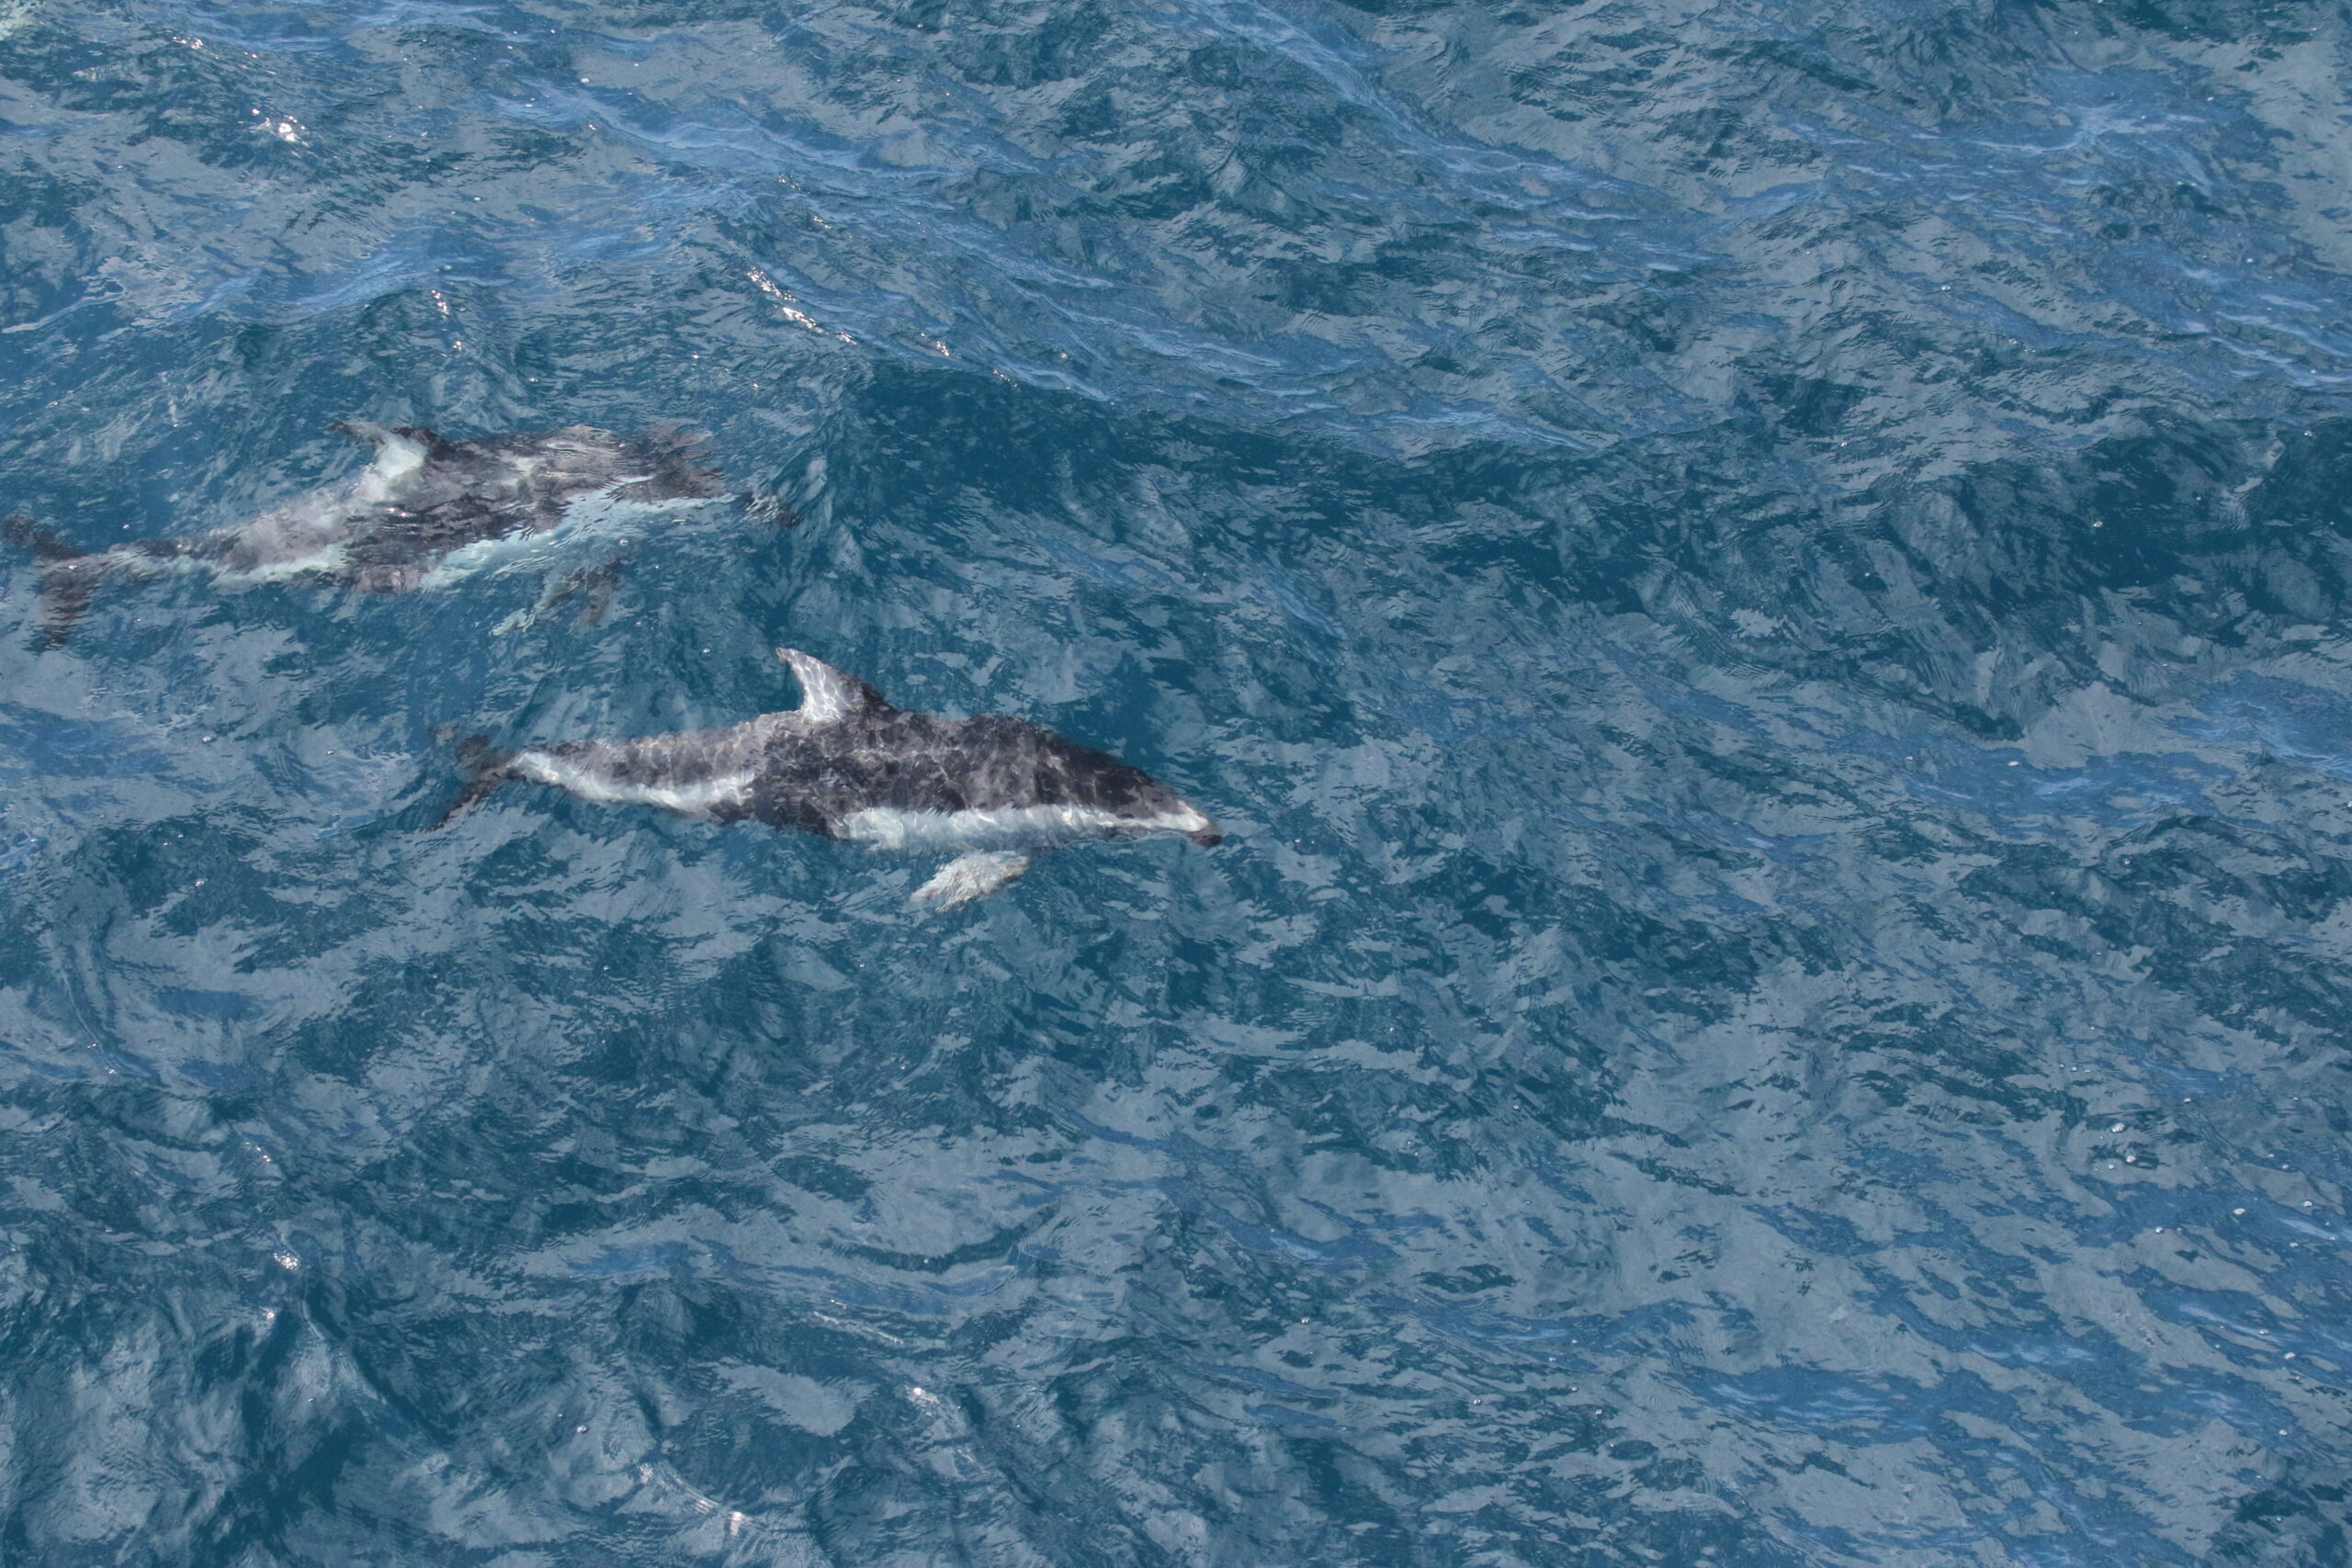
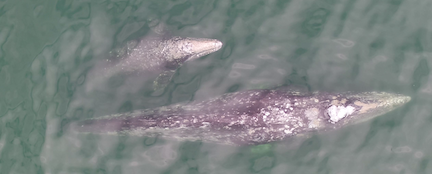
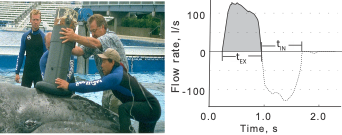
Fortunately, a tool called a spirometer was developed to measure oxygen consumption in restrained cetaceans. A spirometer is a device that can be placed over the blowhole(s) of an individual to accurately measure the amount of air that is exhaled and inhaled (Figure 1). For trained cetaceans in captivity (e.g., dolphins), spirometers can be used to quantify how respiration changes after the animal performs certain behaviors (Fahlman et al., 2019). The breathing patterns of diving mammals are particularly interesting because they cannot breathe during most of their exercise (energy expenditure) as they are underwater. So, their breathing patterns after a dive tell us a lot about how much energy they spent during that dive. For example, Fahlman et al. (2019) used spirometer data from dolphins in captivity to study how their breathing patterns changed while recovering from dives of different durations. Interestingly, they found that after longer dives, dolphins took larger breaths (i.e., inhaled more air) while recovering but did not change the number of breaths. This finding is particularly relevant to the work we are conducting in the GEMM lab, where we utilize breathing patterns to quantify the energy expenditure of cetaceans in the wild, where spirometers cannot be used.
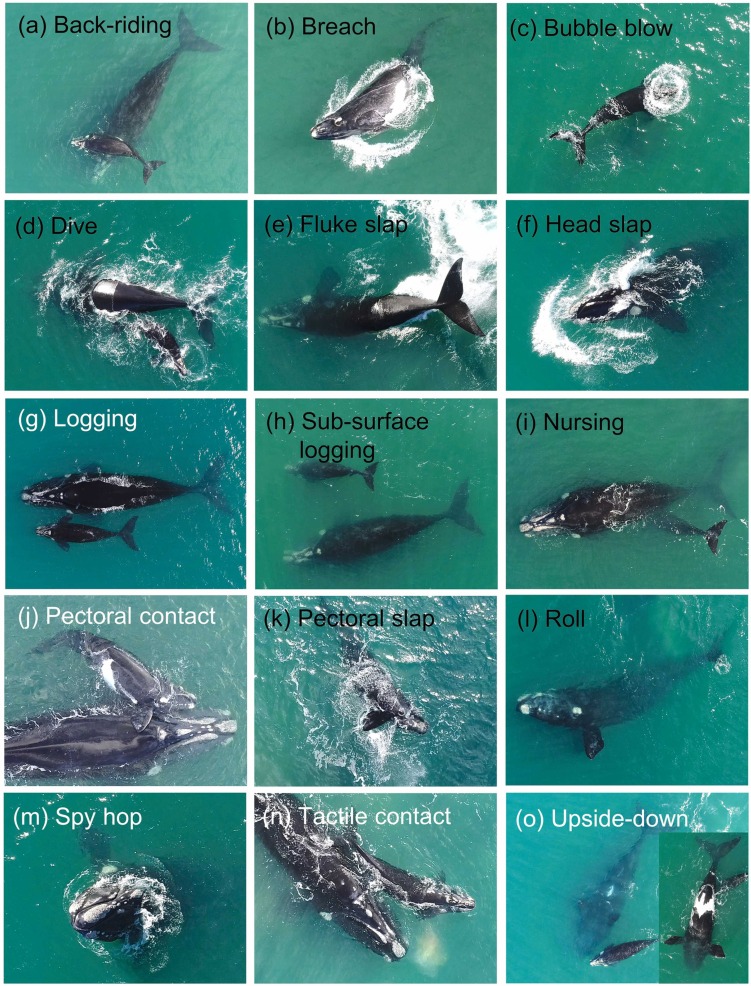
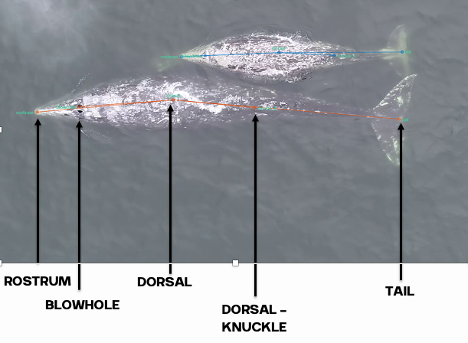
In a previous blog, I described how inter-breath intervals (the time between consecutive blows) are useful for estimating energy expenditure in free-living cetaceans. Essentially, a shorter interval indicates that the whale was just engaged in an energetically demanding activity. When you’re recovering from a sprint, you breathe faster (i.e., with shorter inter-breath intervals), than when you’re recovering from a walk. However, a big assumption in using inter-breath intervals as a proxy for energy expenditure is that every breath is equal. But as Fahlman et al. emphasize in their 2016 paper, every blow is not equal (Fahlman et al., 2016). In addition to varying the time between breaths, an animal can vary the intensity of each breath (e.g., Fahlman et al., 2019), the duration of each breath (Sumich et al., 2023), the number of breaths, and even the expansion of their nostrils (Nazario et al., 2022; check out this blog for more).
Altogether, this means that it’s important to measure every breath and that no one metric tells the complete story. This also means my research question focused on comparing the energetic costs of different tactics is more complicated than I originally thought. If we go back to the first blog I wrote on this topic, I was planning ons only using inter-breath intervals to estimate energy expenditure. Fast forward four years, with all my new knowledge gained on respiration variability, I’ve modified my plan and now I’m working to first understand how all these different metrics of breathing relate to each other. Then, I’ll compare how breathing varies between different foraging tactics, which is an important follow up to my questions around individual specialization of foraging tactics. If different whales are using different foraging behaviors, does that mean they’re spending different amounts of energy? If so, are certain behaviors more advantageous than others? Of course, these answers are incomplete without understanding the prey the whales are eating, but that’s something that PhD student Nat Chazal is working to understand (check out her recent blog here). For now, I’m working on bringing integrating all the measures of breathing, then we will start putting the story together and finding some answers to our pressing questions.
Did you enjoy this blog? Want to learn more about marine life, research, and conservation? Subscribe to our blog and get a weekly alert when we make a new post! Just add your name into the subscribe box below!
References
Broggi, J., Hohtola, E., Koivula, K., Orell, M., & Nilsson, J. (2009). Long‐term repeatability of winter basal metabolic rate and mass in a wild passerine. Functional Ecology, 23(4), 768–773. https://doi.org/10.1111/j.1365-2435.2009.01561.x
Fahlman, A., Brodsky, M., Miedler, S., Dennison, S., Ivančić, M., Levine, G., Rocho-Levine, J., Manley, M., Rocabert, J., & Borque-Espinosa, A. (2019). Ventilation and gas exchange before and after voluntary static surface breath-holds in clinically healthy bottlenose dolphins, Tursiops truncatus. Journal of Experimental Biology, 222(5), jeb192211. https://doi.org/10.1242/jeb.192211
Fahlman, A., van der Hoop, J., Moore, M. J., Levine, G., Rocho-Levine, J., & Brodsky, M. (2016). Estimating energetics in cetaceans from respiratory frequency: Why we need to understand physiology. Biology Open,5(4), 436–442. https://doi.org/10.1242/bio.017251
Nazario, E. C., Cade, D. E., Bierlich, K. C., Czapanskiy, M. F., Goldbogen, J. A., Kahane-Rapport, S. R., Hoop, J. M. van der, Luis, M. T. S., & Friedlaender, A. S. (2022). Baleen whale inhalation variability revealed using animal-borne video tags. PeerJ, 10, e13724. https://doi.org/10.7717/peerj.13724
Speakman, J. R. (1999). The Cost of Living: Field Metabolic Rates of Small Mammals. In A. H. Fitter & D. G. Raffaelli (Eds.), Advances in Ecological Research (Vol. 30, pp. 177–297). Academic Press. https://doi.org/10.1016/S0065-2504(08)60019-7
Sumich, J. L., Albertson, R., Torres, L. G., Bird, C. N., Bierlich, K. C., & Harris, C. (2023). Using audio and UAS-based video for estimating tidal lung volumes of resting and active adult gray whales (Eschrichtius robustus). Marine Mammal Science, 1(8). https://doi.org/10.1111/mms.13081