Stories from a whale’s life: how whale photo-identification is an essential part of the whale physiology toolkit

By Alejandro Fernandez Ajo, PhD student at the Department of Biology, Northern Arizona University, Visiting scientist in the GEMM Lab working on the gray whale physiology and ecology project  

Two years ago, in August 2018, I came to Newport and visited the Hatfield Marine Science Center for the first time with an NSF/RCN-founded laboratory exchange with the GEMM Lab and met Dr. Leigh Torres. My goals during this exchange where to learn about non-invasive fieldwork techniques for studying free-range whales while interacting, exchanging ideas, and networking with the GEMM Lab members; also, to discuss some projects and thoughts for future collaborations with Dr. Torres. During those two weeks in Newport, I had the opportunity to help with field work on the project “Evaluation of gray whale ecology and physiology in response to variable ambient ocean noise conditions”, which aims to evaluate the hormonal variability and health of the gray whales that forage along the Oregon coast in the context of multiple stressors. I would return during the summers of 2019 and 2020 as a visiting scientist and research assistant to work on this project. This year the experience has been a bit different in terms of interactions with the HMSC community due to COVID-19; however, we were able to successfully start the field season in time and now we are wrapping up our second month of surveys with many new and interesting data gathered, and many new, unforgettable memories to be treasured. Working with these animals is incredibly fascinating because there are so many things we don´t know about them, and the questions can become both overwhelming and exciting.

An essential part of this project, and arguably any research project done with cetaceans, is the identification of individuals. Hence, considerable effort is expended each year attempting to photograph every gray whale possible within our study region and to identify each whale we encounter. The GEMM Lab maintains a catalog of the gray whales that visit the Oregon coast, a sub-population known as the Pacific Coast Feeding Group (PCFG). This catalog currently consists of 173 individuals. which we frequently compare with a larger catalog of gray whales that includes 2060 individuals observed since 1977 (Cascadia Research Collective). These methods allow us to know who is who among the whales we encounter each day at sea.

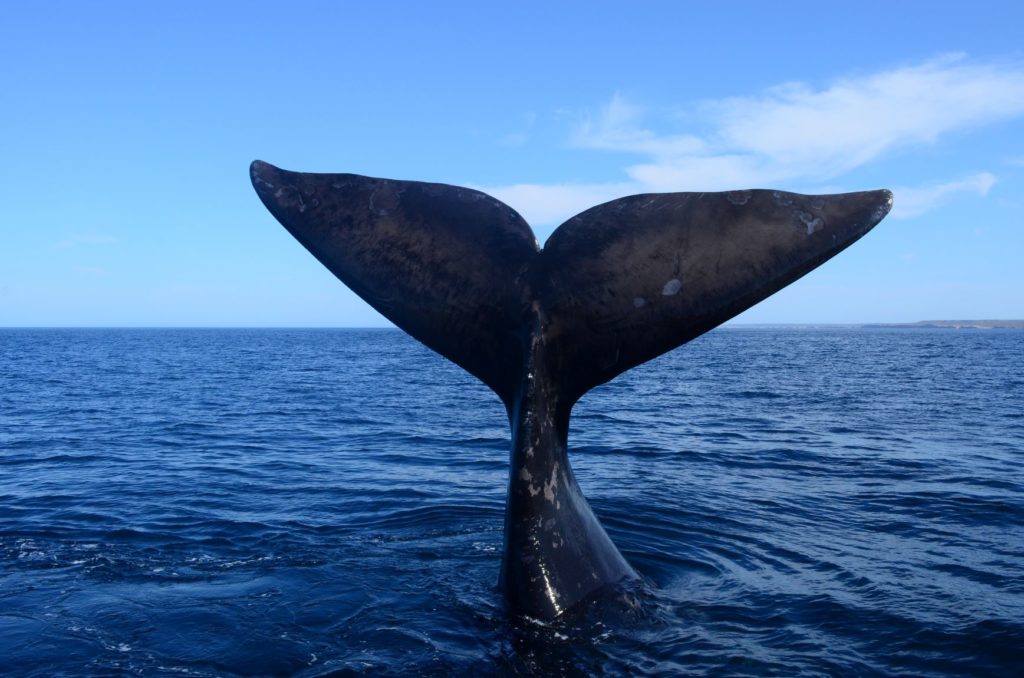
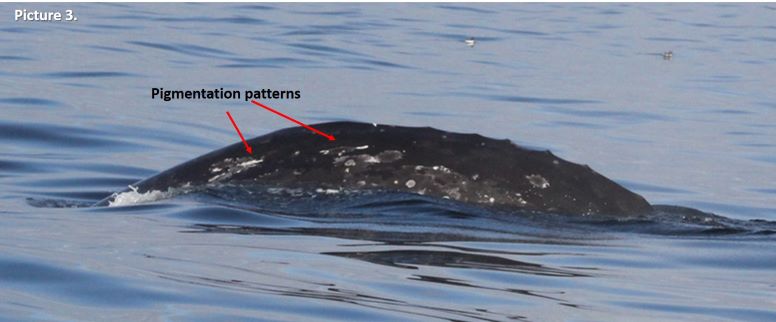
The different species of cetaceans can be individually identified by markings on their bodies, very much like fingerprints in humans. Some features on these animals are unique and conserved through life. For example, Southern and Northern right whales are identified by the callosity patters in their heads (Picture 1), while humpback whales are mostly identified individually by the shape and the patterns of black and white pigmentation on the underside of their fluke (Picture 2). Gray whales have very mottled skin coloration, so we use a combination of markings and features to identify individuals: pigmentation patterns, scars, shape and pigmentation of their fluke, and sometimes the shape of their knuckles, which are a series of “humps” that gray whales have instead of a dorsal fin on their back. It might sound very difficult to do, and it can be a tedious task, however as you train your eye it becomes easier, and features that at first seemed undistinguishable become recognizable and unique (Picture 3). As a reward, it is such a joy to find a match and recognize old friends when they arrive from their long journeys in the vast ocean each year to the Oregon coast.

The callosity pattern of a southern right whale. Photo by Alejandro Fernández Ajó – Instituto de Conservación de Ballenas.
Three different humpback whales with notably different pigmentation patterns on their flukes. Photographs captured under NOAA/NMFS permit #21678.
The gray whale “Knife” we have observed frequently this summer off the Oregon coast. Can you see how the right pigmentation pattern identified looks like a knife? Photograph captured under NOAA/NMFS permit #21678.

As a result of our photo-identification efforts and the high site-fidelity of the whales we study, the large majority of the gray whales we observe here in Oregon are known individually. For many whales, we also have detailed sightings records that can span years and decades, that document calving history, lactation, appearance of scars indicative of injury or entanglement, minimum age, sex, habitat-use patterns, behaviors, etc. Holding such detailed information of individual whales provides incredible contributions to our understanding of the basic patterns in life history of whales, such as reproduction rates, calving intervals, age of first reproduction, etc. Moreover, when these life history events are linked with physiological sample collection large steps can be made in the development and validation of physiological methods. Many endocrine assays currently in use for whales are based on non-traditional sample types including feces, respiratory vapor, and baleen, which have been validated using the catalogs of well-known individuals to verify that measured hormones reflect patterns expected for various physiological states. For example, we can compare endocrine data of confirmed pregnant females, known mature males, and known-injured whales to learn how whale physiological responses are different during different life history events (e.g., Burgess et al. 2017, 2018, Corkeron et al. 2017, Hunt et al. 2006, 2016, 2018, Lysiak et al. 2018, Rolland et al. 2005).

Here in Oregon we are learning from the lives of the gray whales we study, and here I want to share with you two of their stories, one happy and one not-so-happy.

Let´s start with the not-so-happy story so we can end with some brighter news. On June 24 this year, we encountered a whale near Cape Foulweather, which is a very tricky area to work as there are many rocks and shallow water that make the sea conditions very choppy even with low swell. We started documenting the sighting as usual, taking pictures of the left side, the right side and ideally also the fluke of the whale. As we approached this whale, we started noting that something was wrong with its fluke. With the challenging sea conditions, it was not easy to approach the whale and the whale was not exposing its fluke when diving. When we put our drone up to collect photogrammetry and behavior data we gained a much better perspective. This whale has a bad injury on it fluke (Picture 4.C). On the boat we started making conjectures about the cause of this terrible injury that had basically amputate most of its left fluke lobe. Once back on shore, we sorted out the photos and compared the field images captured during the day with the photo-ID catalog and we made a match. This whale is known in our catalog as “ROLLER SKATE”, is a female, and was first sighted in 2015, so she is at least 5 years old today.

The story unfolded when we reviewed Roller Skate’s sighting history. Interestingly we observed this same whale in the same location last September 2019. Unfortunately, it was a very brief encounter but enough for photo documentation of the whale and an interesting observation. Here I quote the field notes that Dr. Torres wrote from this sighting: “September 6th, 2019. Sighting 9: Scattered whales feeding and/or traveling across area to north of Cape Foulweather. One whale had recently chopped fluke; tried to re-find to get better photos but could not (looking at photos now, this whale is clearly entangled in line!). Ceiling too low for UAS [drone flight].” (Picture 4.B).

Progressive photos of Roller Skate’s fluke. In 2017, her fluke was healthy (A). In 2019, we observed her fluke with a line entanglement and “chewed up” (B). In 2020, we have observed the resulting wound and healing process (C). Photographs captured under NOAA/NMFS permit #21678.

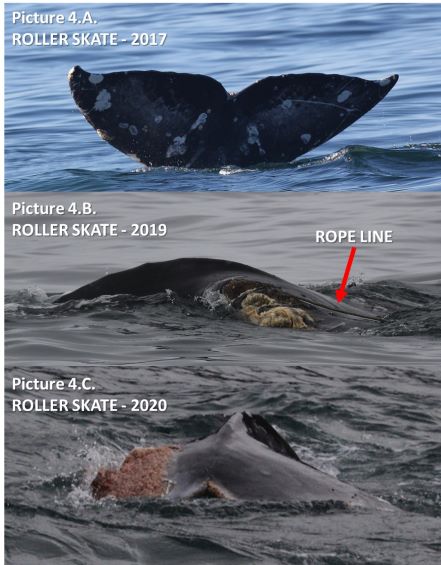
Roller skate’s story is an example of how essential is to keep an ID catalog. After a close-up examination of the 2019 picture, we can clearly see a rope entanglement (Picture 4.B). Photos from previous years show how beautiful and healthy her fluke was before this event (Picture 4.A). This event is heart breaking to witness, but this whale could be considered lucky because she was able to shed the gear and survive this entanglement, at least in the short term. Additionally, we can learn from Roller Skate’s misfortune to help us understand what the consequences of such an injury (stressor) may be on the physiology of a whale. We have been eager to collect a fecal sample from Roller Skate to analyze how her hormone levels compare to non-injured whales. Fortunately, we got lucky a couple weeks ago and collected this sample, so now we need to get in the lab and analyze the samples. But more questions remain: Will this injury impact her ability to reproduce? If so, for how long? And at a larger scale, what are the population consequences of such events? If we can understand the magnitude of lethal and sublethal human caused impacts on individual whales and their populations from events such as entanglements, we can develop better methods to mitigate and limit such hazards for whales in their environments.

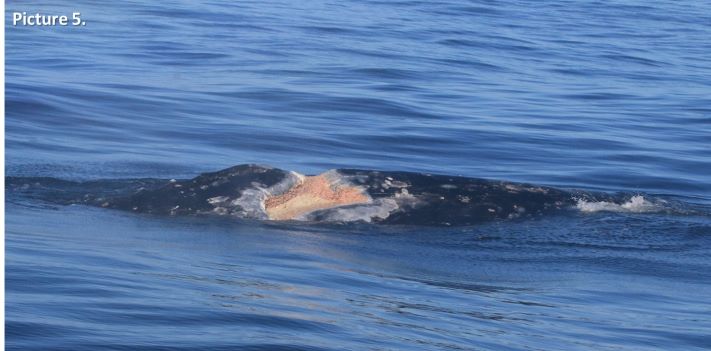
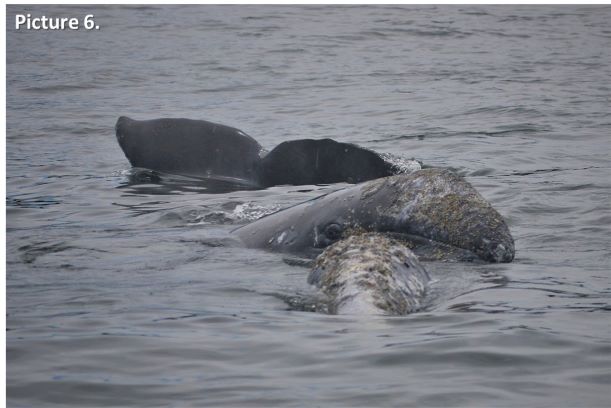
As I promised, there is also some good news to share. A very well-known PCFG whale, almost a celebrity I dear to say, is “Scarback”, or as we like to call her “Scarlett”. Scarlett is a female known since 1996, making her at least 24 years old, and she also has a very bad injury of unknown origin. Scarlett has a terrible scar on her back that is theorized to have been caused by an explosive harpoon, or maybe a bad ship-strike (Picture 5), but we really do not know. However, we do know she survived this injury and this year she brought a new calf into the population (Picture 6). This is the second calf we have documented from Scarlett, with her previous calf sighted during the 2016 field season and we call it “Brown”. Scarlett is an example of how resilient these amazing giants can be; however, it is likely that while she was recovering from this injury, she was unable to reproduce. How many calves from Scarlett did the PCFG population “lose” due to such a tragedy? We can´t know, but we are learning, and her story will also help us understand whale physiology as we will analyze her fecal hormones and body condition during pregnancy, lactation, and resting phases.

The scar on Scarlett’s back. This significant wound has an unknown origin. Photograph captured under NOAA/NMFS permit #21678.

Scarlett is a survivor. We need to recognize that we are sharing the ocean with different forms of life. We need to acknowledge their existence and understand how our use of the oceans is affecting them, and, more importantly, work toward improving their conditions. I hope that with our research we highlight and communicate how amazing are these animals, and how important are they for marine ecosystems. And ultimately, I hope our work helps minimize the impacts that affect other forms of ocean life that coexist with us, both above and below the surface.

The well-known gray whale “Scarlett” surfaces under her calf while it checks out the GEMM Lab field team. Photo by Alejandro Fernandez Ajo taken under NOAA/NMFS permit #21678.

References:

Burgess, E., Hunt, K. E., Kraus, S. D. and Rolland, R. M. (2016). Get the most out of blow hormones: validation of sampling materials, field storage and extraction techniques for whale respiratory vapor samples. Conservation Physiology, 4, cow024.

Burgess, E. A., Hunt, K. E., Kraus, S. D. and Rolland, R. M. (2018). Quantifying hormones in exhaled breath for physiological assessment of large whales at sea. Scientific Reports, 8, 10031.

Corkeron, P. J., Rolland, R. M., Hunt, K. E. and Kraus, S. D. (2017). A right whale PooTree: Fecal hormones and classification trees identify reproductive states in North Atlantic right whales (Eubalaena glacialis). Conservation Physiology, 5, cox006. DOI: 10.1093/conphys/cox006.

Hunt, K., Lysiak, N., Moore, M. and Rolland, R. (2017). Multi-year longitudinal profiles of cortisol and corticosterone recovered from baleen of North Atlantic right whales (Eubalaena glacialis). General and Comparative Endocrinology, 254, 50-59. DOI: 10.1016/j.ygcen.2017.09.009.

Hunt, K., Lysiak, N. S. J., Matthews, C. J. D., et al. (2018). Multi-year patterns in testosterone, cortisol and corticosterone in baleen from adult males of three whale species. Conservation Physiology, 6, coy049. DOI: 10.1093/conphys/coy049.

Hunt, K. E., Rolland, R. M., Kraus, S. D. and Wasser, S. K. (2006). Analysis of fecal glucocorticoids in the North Atlantic Right Whale (Eubalaena glacialis). General and Comparative Endocrinology, 148, 260-272.

Lysiak, N., Trumble, S., Knowlton, A. and Moore, M. (2018). Characterizing the duration and severity of fishing gear entanglement on a North Atlantic right whale (Eubalaena glacialis) using stable isotopes, steroid and thyroid hormones in baleen. Frontiers in Marine Science. DOI: 10.3389/fmars.2018.00168.

Rolland, R. M., Hunt, K. E., Kraus, S. D. and Wasser, S. K. (2005). Assessing reproductive status of right whales (Eubalaena glacialis) using fecal hormone metabolites. General and Comparative Endocrinology, 142, 308-317.

Whales are amazing, and also provide amazing benefits to our oceans and human society

By Alejandro Fernandez Ajo, PhD student at the Department of Biology, Northern Arizona University, Visiting scientist in the GEMM Lab working on the gray whale physiology and ecology project  

Whales are among the most amazing and enigmatic animals in the world. Whales are not only fascinating, they are also biologically special. Due to their key ecological role and unique biological traits (i.e., their large body size, long lifespans, and sizable home ranges), whales are extremely important in helping sustain the entire marine ecosystem.

Working towards the conservation of marine megafauna, and large charismatic animals in general, is often seen as a mere benevolent effort that conservationist groups, individuals, and governments do on behalf of the individual species. However, mounting evidence demonstrates that restoring populations of marine megafauna, including large whales, can help buffer marine ecosystems from destabilizing stresses like human driven CO2 emissions and global change due to their ability to sequester carbon in their bodies (Pershing et al. 2010). Furthermore, whales can enhance primary production in the ocean through their high consumption and defecation rates, which ultimately provides nutrients to the ecosystem and improves fishery yields (Roman-McCarthy, 2010; Morissette et al. 2012).

Relationships between humans and whales have a long history, however, these relationships have changed. For centuries, whales were valued in terms of the number of oil barrels they could yield, and the quality of their baleen and meat. In the North Atlantic, whaling started as early as 1000 AD with “shore whaling” of North Atlantic right whales by Basque whalers. This whaling was initially limited to the mother and calve pairs that were easy to target due to their coastal habits and the fact that calves are more vulnerable and slower (Reeves-Smith, 2006). Once the calving populations of near-shore waters off Europe were depleted, offshore whaling began developing. Whalers of multiple nations (including USA, British, French, Norwegian, Portuguese, and Dutch, among others), targeted whales around the world, mainly impacting the gray whale populations, and all three right whale species along with the related bowhead whale. Later, throughout the phase of modern whaling using industrialized methods, the main target species consisted of the blue, fin, humpback, minke, sei and sperm whale (Schneider- Pearce, 2004).

By the early twentieth century, many of the world´s whale populations where reduced to a small fraction of their historical numbers, and although pre-whaling abundance of whale stocks is a subject of debate, recent studies estimate that at least the 66%, and perhaps as high as 90% for some whale species and populations (Branch-Williams 2006; Christensen, 2006), where taken during this period. This systematic and serial depletion of whale papulations reduced the biomass and abundance of great whales around the world, which has likely altered the structure and function of the oceans (Balance et al. 2006; Roman et al. 2014; Croll, et al. 2006).

After centuries of unregulated whale hunting, commercial whaling was banned in the mid-twentieth century. This ban was the result of multiple factors including reduced whale stocks below the point where commercial whaling would be profitable, and a fortunate shift in public perception of whales and the emergence of conservation initiatives (Schneider- Pearce, 2004). Since this moratorium on whaling, several whale populations have recovered around the world, and some populations that were listed as endangered have been delisted (i.e., the Eastern North Pacific gray whale) and some populations are estimated to have re-bounced to their pre-whaling abundance.

Although, the recovery of some populations has motivate some communities or nations to obtain or extend their whaling quotas (see Blog Post by Lisa Hildebrand), it is important to acknowledge that the management of whale populations is arguably one of the most complicated tasks, and is distinguished from management of normal fisheries due to various biological aspects. Whales are long living mammals with slow reproduction rates, and on average a whale can only produce a calf every two or three years. Hence, the gross addition to the stock rarely would exceed 25% of the number of adults (Schneider- Pearce, 2004), which is a much lower recovery rate that any fish stock. Also, whales usually reach their age of sexual maturity at 6-10 years old, and for many species there are several uncertainties about their biology and natural history that make estimations of population abundance and growth rate even harder to estimate.

Fig 1: Human relationship with whales has changed through history. Once valued for their meat and oil, now they are a natural attraction that amaze and attract crowds to whale watching destinations all over the globe. Photo: Stephen Johnson, Península Valdés-Argentina.

Moreover, while today´s whales are generally not killed directly by hunting, they are exposed to a variety of other increasing human stressors (e.g., entanglement in fishing gear, vessel strikes, shipping noise, and climate change). Thus, scientists must develop novel tools to overcome the challenges of studying whales and distinguish the relative importance of the different impacts to help guide conservation actions that improve the recovery and restoration of whale stocks (Hunt et al. in press). With the restoration of great whale populations, we can expect positive changes in the structure and function of the world’s oceans (Chami et al. 2019; Roman et al. 2010).

So, why it is worth keeping whales healthy?

Whales facilitate the transfer of nutrients by (1) releasing nutrient-rich fecal plumes near the surface after they have feed at depth and (2) by moving nutrients from highly productive, polar and subpolar latitude feeding areas to the low latitude calving areas (Roman et al. 2010). In this way, whales help increase the productivity of phytoplankton that in turn support zooplankton production, and thus have a bottom up effect on the productivity of many species including fish, birds, and marine mammals, including whales. These fertilization events can also facilitate mitigation of the negative impacts of climate change. The amount of iron contained in the whales’ feces can be 10 million times greater than the level of iron in the marine environment, triggering important phytoplankton blooms, which in turn sequester thousands of tons of carbon from, and release oxygen to, the atmosphere annually (Roman et al. 2016; Smith et al. 2013; Willis, 2007). Furthermore, when whales die, their massive bodies fall to the seafloor, making them the largest and most nutritious source of food waste, which is capable of sustaining a succession of macro-fauna assemblages for several decades, including some invertebrate species that are endemic to whale carcasses (Smith et al. 2015).

Figure 2. The figure shows a conceptual model of the “whale pump”. From Roman-McCarthy, 2010.

Despite the several environmental services that whales provide, and the positive impact on local economies that depend on whale watching tourism, which has been valued in millions of dollars per year (Hoyt E., 2001), the return of whales and other marine mammals has often been implicated in declines in fish populations, resulting in conflicts with human fisheries (Lavigne, D.M. 2003). Yet there is insufficient direct evidence for such competition (Morissette et al. 2010). Indeed, there is evidence of the contrary: In ecosystem models where whale abundances are reduced, fish stocks show significant decreases, and in some cases the presence of whales in these models result in improved fishery yields. Consistent with these findings, several models have shown that alterations in marine ecosystems resulting from the removal of whales and other marine mammals do not lead to increases in human fishery yields (Morissette et al. 2010; 2012). Although the environmental services and benefits provided by great whales, which potentially includes the enhancement of fisheries yields, and enhancement on ocean oxygen production and capturing carbon, are evident and make a strong argument for improved whale conservation, it is overwhelming how little we know about many aspects of their lives, their biology, and particularly their physiology.

Figure 3: Whales are the most fascinating animals in the world, but they are not only amazing animals. They are also extremely important in sustaining the entire marine ecosystem. Photo: Alejandro Fernández Ajó -Instituto de Conservación de ballenas.

This lack of knowledge is because whales are really hard to study. For many years research was limited to the observation of the brief surfacing of the whales, yet most of their lives occurs beneath the surface and were completely unknown. Fortunately, new technologies and the creativity of whale researchers are helping us to better understand many aspects of their lives that were cryptic to us even a decade ago. I am committed to filling some of these knowledge gaps. My research examines how different environmental and anthropogenic impacts affect whale health, and particularly how these impacts may relate to cases of large whale mortalities and declines in whale populations. I am applying novel methods in conservation physiology for measuring hormone levels that promise to improve our understanding of the relationship between different (extrinsic and intrinsic) stressors and the physiological response of whales. Ultimately, this research will help address important conservation questions, such as the causes of unusual whale mortality events and declines in whale populations.

References:

Ballance LT, Pitman RL, Hewitt R, et al. 2006. The removal of large whales from the Southern Ocean: evidence for long-term ecosystem effects. In: Estes JA, DeMaster DP, Doak DF, et al. (Eds). Whales, whaling and ocean ecosystems. Berkeley, CA: University of California Press.

Branch TA and Williams TM. 2006. Legacy of industrial whaling. In: Estes JA, DeMaster DP, Doak DF, et al. (Eds). Whales, whaling and ocean ecosystems. Berkeley, CA: University of California Press.

Chami, R. Cosimano, T. Fullenkamp, C. & Oztosun, S. (2019). Nature’s solution to climate change. Finance & Development, 56(4).

Christensen LB. 2006. Marine mammal populations: reconstructing historical abundances at the global scale. Vancouver, Canada: University of British Columbia.

Croll DA, Kudela R, Tershy BR (2006) Ecosystem impact of the decline of large whales in the North Pacific. In: Estes JA, DeMaster DP, Doak DF, Williams TM, BrownellJr RL, editors. Whales, Whaling, and Ocean Ecosystems. Berkeley: University of California Press. pp. 202–214.

Hoyt, E. 2001. Whale Watching 2001: Worldwide Tourism Numbers, Expenditures and Expanding Socioeconomic Benefits

Hunt, K.E., Fernández Ajó, A. Lowe, C. Burgess, E.A. Buck, C.L. In press. A tale of two whales: putting physiological tools to work for North Atlantic and southern right whales. In: “Conservation Physiology: Integrating Physiology Into Animal Conservation And Management”, ch. 12. Eds. Madliger CL, Franklin CE, Love OP, Cooke SJ. Oxford University press: Oxford, UK.

Lavigne, D.M. 2003. Marine mammals and fisheries: the role of science in the culling debate. In: Gales N, Hindell M, and Kirkwood R (Eds). Marine mammals: fisheries, tourism, and management issues. Melbourne, Australia: CSIRO.

Morissette L, Christensen V, and Pauly D. 2012. Marine mammal impacts in exploited ecosystems: would large scale culling benefit fisheries? PLoS ONE 7: e43966.

Morissette L, Kaschner K, and Gerber LR. 2010. “Whales eat fish”? Demystifying the myth in the Caribbean marine ecosystem. Fish Fish 11: 388–404.

Pershing AJ, Christensen LB, Record NR, Sherwood GD, Stetson PB (2010) The impact of whaling on the ocean carbon cycle: Why bigger was better. PLoS ONE 5(8): e12444.

Reeves, R. and Smith, T. (2006). A taxonomy of world whaling. In DeMaster, D. P., Doak, D. F., Williams, T. M., and Brownell Jr., R. L., eds. Whales, Whaling, and Ocean Ecosystems. University of California Press, Berkeley, CA.

Roman, J. Altman I, Dunphy-Daly MM, et al. 2013. The Marine Mammal Protection Act at 40: status, recovery, and future of US marine mammals. Ann NY Acad Sci; doi:10.1111/nyas.12040.

Roman, J. and McCarthy, J.J. 2010. The whale pump: marine mammals enhance primary productivity in a coastal basin. PLoS ONE. 5(10): e13255.

Roman, J. Estes, J.A. Morissette, L. Smith, C. Costa, D. McCarthy, J. Nation, J.B. Nicol, S. Pershing, A.and Smetacek, V. 2014. Whales as marine ecosystem engineers. Frontiers in Ecology and the Environment. 12(7). 377-385.

Roman, J. Nevins, J. Altabet, M. Koopman, H. and McCarthy, J. 2016. Endangered right whales enhance primary productivity in the Bay of Fundy. PLoS ONE. 11(6): e0156553.

Schneider, V. Pearce, D. What saved the whales? An economic analysis of 20th century whaling. Biodiversity and Conservation 13, 543–562 (2004). https://doi org.libproxy.nau.edu/10.1023/B:BIOC.0000009489.08502.1

Smith LV, McMinn A, Martin A, et al. 2013. Preliminary investigation into the stimulation of phyto- plankton photophysiology and growth by whale faeces. J Exp Mar Biol Ecol 446: 1–9.

Smith, C.R. Glover, A.G. Treude, T. Higgs, N.D. and Amon, D.J. 2015. Whale-fall ecosystems: Recent insights into ecology, paleoecology, and evolution. Annu. Rev. Marine. Sci. 7:571-596.

Willis, J. 2007. Could whales have maintained a high abundance of krill? Evol Ecol Res 9: 651–662.

Vaquita: a porpoise caught between people and money

By: Alexa Kownacki, Ph.D. Student, OSU Department of Fisheries and Wildlife, Geospatial Ecology of Marine Megafauna Lab

When I first learned of the critically endangered vaquita in early 2015, there were an estimated 97 individuals remaining as reported by CIRVA* (Morell 2014). I was a recent graduate with a bachelor’s degree in Wildlife, Fish, and Conservation Biology, and I, of all people, had never heard of the vaquita. Today, there are an estimated 19 vaquita left (Roth 2019).

Digital painting of a vaquita mother with her calf (Image Source: Aquarium of the Pacific).

The vaquita (Phocoena sinus) is a small porpoise endemic to the Sea of Cortez in the northern region of the Gulf of California, Mexico. It is the most endangered marine mammal and has been for many years, and yet, I had not heard of the vaquita. It wasn’t until I listened to a lunchtime seminar hosted by NOAA Fisheries, that I heard about the porpoise. As a young scientist, “in the field”, I was shocked to realize that I was just learning about an animal, let alone a cetacean, actively going extinct in my lifetime. I believe it’s our job to inform those around us of news in our expertise, and I had failed. I wasn’t informed. As much as I tried in the past four years to describe the decline of the smallest cetacean to anyone who’d listen, I was only reaching a few people at a time. But, today, the vaquita is finally capturing the public’s eye thanks to celebrity support and a feature-length film.

A rare photo of a vaquita (Image Source: Tom Jefferson via the Marine Mammal Center)

From executive producer, Leonardo DiCaprio, comes the Sundance Film Festival Audience Award winner, “Sea of Shadows”. The story of the vaquita truly is an “eco-thriller” and one worth watching. This is not your typical plot line of an endangered species tragically going extinct without action. The vaquita’s story boasts big-name players, such as the Mexican Navy, internationally recognized scientists, Mexican cartels, Chinese mafia, celebrities, the National Marine Mammal Foundation, and Sea Shepherd. At the center of this documentary is the elusive vaquita. The vaquita is not hunted, in fact, this species is not desirable for fisherman. The animal is not aggressive and, in contrast, is notoriously shy, only surfacing to breathe. Furthermore, its name roughly translates into “little cow” because of the rings around its eyes and its docile nature. So, why is this cute creature on the road to extinction? The answer: the wrong place at the wrong time.

“Sea of Shadows” official trailer by National Geographic

The vaquita occupy a small part of the Sea of Cortez where totoaba (Totoaba macdonaldi), a large fish in the drum family, is also endemic. If you’re wondering what a small porpoise and a large fish have in common, then you’d be close to recognizing that is the key to understanding this tragedy. Both species are roughly the same size, one to two meters in length with similar girths. The totoaba, although said to have tender meat, is caught for only one organ: the swim bladder. Now referred to as the “cocaine of the sea”, the dried swim bladders of the totoaba are sold to Mexican cartels who then export the product to China. Once in China, illegal markets sell the swim bladders for up to $100,000USD. Unfortunately, the nets used to illegally catch totoaba, also catch the vaquita. The porpoise has no economic value to the fishermen and therefore are tossed as bycatch. The vaquita is the innocent bystander in a war for money and power.

A man displays the catch from an illegal gillnet, including the totoaba in his arms, and a vaquita, below, that was bycatch (Image Source: Omar Vidal via Aquarium of the Pacific/NOAA Fisheries).

Watching a charismatic species severely decline because of human greed is horrific. The film, however, focuses on the effort of a few incredible organizations that band together in the fight to save the vaquita. Moreover, the multimillion-dollar project, Vaquita CPR, is still ongoing. On a more positive note, in October of 2019, scientists spotted six vaquita during continued conservation and monitoring efforts (Blust & Desk 2019). The path to saving a critically endangered species, especially one that is thought not to do well in captivity, is challenging. The vaquita’s recovery path has many complicated connections which for what appears to be an uphill battle. But, we, the people, are responsible for this. We must support research and conservation by using our voice to share what is happening, for a porpoise and for the world.

*Comité Internacional para la Recuperación de la Vaquita (International Committee for the Recovery of the Vaquita)

Citations:

Blust, Kendal, and Fronteras Desk. “Photo Sparks Increased Concern over Fishing in Vaquita Refuge.” Arizona Public Media, 25 Oct. 2019, https://news.azpm.org/p/news-topical-nature/2019/10/25/160806-photo-sparks-increased-concern-over-fishing-in-vaquita-refuge/.

Morell, Virginia. “Vaquita Porpoise Faces Imminent Extinction-Can It Be Saved?” National Geographic, 15 Aug. 2014, https://www.nationalgeographic.com/news/2014/8/140813-vaquita-gulf-california-mexico-totoaba-gillnetting-china-baiji/.

Roth, Annie. “The ‘Little Cow’ of the Sea Nears Extinction.” National Geographic, 17 Sept. 2019, https://www.nationalgeographic.com/animals/2019/09/vaquita-the-porpoise-familys-smallest-member-nears-extinction/#close.

The significance of blubber hormone sampling in conservation and monitoring of marine mammals

By: Alexa Kownacki, Ph.D. Student, OSU Department of Fisheries and Wildlife, Geospatial Ecology of Marine Megafauna Lab

Marine mammals are challenging to study for many reasons, and specifically because they inhabit the areas of the Earth that are uninhabited by people: the oceans. Monitoring marine mammal populations to gather baselines on their health condition and reproductive status is not as simple as trap and release, which is a method often conducted for terrestrial animals. Marine mammals are constantly moving in vast areas below the surface. Moreover, cetaceans, which do not spend time on land, are arguably the most challenging to sample.

One component of my project, based in California, USA, is a health assessment analyzing hormones of the bottlenose dolphins that frequent both the coastal and the offshore waters. Therefore, I am all too familiar with the hurdles of collecting health data from living marine mammals, especially cetaceans. However, the past few decades have seen major advancements in technology both in the laboratory and with equipment, including one tool that continues to be critical in understanding cetacean health: blubber biopsies.

Biopsy dart hitting a bottlenose dolphin below the dorsal fin. Image Source: NMFS

Blubber biopsies are typically obtained via low-powered crossbow with a bumper affixed to the arrow to de-power it once it hits the skin. The arrow tip has a small, pronged metal attachment to collect an eraser-tipped size amount of tissue with surface blubber and skin. I compare this to a skin punch biopsies in humans; it’s small, minimally-invasive, and requires no follow-up care. With a small team of scientists, we use small, rigid-inflatable vessels to survey the known locations of where the bottlenose dolphins tend to gather. Then, we assess the conditions of the seas and of the animals, first making sure we are collecting from animals without potentially lowered immune systems (no large, visible wounds) or calves (less than one years old). Once we have photographed the individual’s dorsal fin to identify the individual, one person assembles the biopsy dart and crossbow apparatus following sterile procedures when attaching the biopsy tips to avoid infection. Another person prepares to photograph the animal to match the biopsy information to the individual dolphin. One scientist aims the crossbow for the body of the dolphin, directly below the dorsal fin, while the another photographs the biopsy dart hitting the animal and watches where it bounces off. Then, the boat maneuvers to the floating biopsy dart to recover the dart and the sample. Finally, the tip with blubber and skin tissue is collected, again using sterile procedures, and the sample is archived for further processing. A similar process, using an air gun instead of a crossbow can be viewed below:

GEMM Lab members using an air gun loaded with a biopsy dart to procure marine mammal blubber from a blue whale in New Zealand. Video Source: GEMM Laboratory.

Part of the biopsy process is holding ourselves to the highest standards in our minimally-invasive technique, which requires constant practice, even on land.

Alexa practicing proper crossbow technique on land under supervision. Image Source: Alexa Kownacki

Blubber is the lipid-rich, vascularized tissue under the epidermis that is used in thermoregulation and fat storage for marine mammals. Blubber is an ideal matrix for storing lipophilic (fat-loving) steroid hormones because of its high fat content. Steroid hormones, such as cortisol, progesterone, and testosterone, are naturally circulating in the blood stream and are released in high concentrations during specific events. Unlike blood, blubber is less dynamic and therefore tells a much longer history of the animal’s nutritional state, environmental exposure, stress level, and life history status. Blubber is the cribs-notes version of a marine mammal’s biography over its previous few months of life. Blood, on the other hand, is the news story from the last 24 hours. Both matrices serve a specific purpose in telling the story, but blubber is much more feasible to obtain from a cetacean and provides a longer time frame in terms of information on the past.

A simplified depiction of marine mammal blubber starting from the top (most exterior surface) being the skin surface down to the muscle (most interior). Image Source: schoolnet.org.za

I use blubber biopsies for assessing cortisol, testosterone, and progesterone in the bottlenose dolphins. Cortisol is a glucocorticoid that is frequently associated with stress, including in humans. Marine mammals utilize the same hypothalamic-pituitary-adrenal (HPA) axis that is responsible for the fight-or-flight response, as well as other metabolic regulations. During prolonged stressful events, cortisol levels will remain elevated, which has long-term repercussions for an animal’s health, such as lowered immune systems and decreased ability to respond to predators. Testosterone and progesterone are sex hormones, which can be used to indicate sex of the individual and determine reproductive status. This reproductive information allows us to assess the population’s composition and structure of males and females, as well as potential growth or decline in population (West et al. 2014).

Alexa using a crossbow from a small boat off of San Diego, CA. Image Source: Alexa Kownacki

The coastal and offshore bottlenose dolphin ecotypes of interest in my research occupy different locations and are therefore exposed to different health threats. This is a primary reason for conducting health assessments, specifically analyzing blubber hormone levels. The offshore ecotype is found many kilometers offshore and is most often encountered around the southern Channel Islands. In contrast, the coastal ecotype is found within 2 kilometers of shore (Lowther-Thieleking et al. 2015) where they are subjected to more human exposure, both directly and indirectly, because of their close proximity to the mainland of the United States. Coastal dolphins have a higher likelihood of fishery-related mortality, the negative effects of urbanization including coastal runoff and habitat degradation, and recreational activities (Hwang et al. 2014). The blubber hormone data from my project will inform which demographics are most at-risk. From this information, I can provide data supporting why specific resources should be allocated differently and therefore help vulnerable populations. Further proving that the small amount of tissue from a blubber biopsy can help secure a better future for population by adjusting and informing conservation strategies.

Literature Cited:

Hwang, Alice, Richard H Defran, Maddalena Bearzi, Daniela. Maldini, Charles A Saylan, Aime ́e R Lang, Kimberly J Dudzik, Oscar R Guzo n-Zatarain, Dennis L Kelly, and David W Weller. 2014. “Coastal Range and Movements of Common Bottlenose Dolphins (Tursiops Truncatus) off California and Baja California, Mexico.” Bulletin of the Southern California Academy of Sciences 113 (1): 1–13. https://doi.org/10.3390/toxins6010211.

Lowther-Thieleking, Janet L., Frederick I. Archer, Aimee R. Lang, and David W. Weller. 2015. “Genetic Differentiation among Coastal and Offshore Common Bottlenose Dolphins, Tursiops Truncatus, in the Eastern North Pacific Ocean.” Marine Mammal Science 31 (1): 1–20. https://doi.org/10.1111/mms.12135.

West, Kristi L., Jan Ramer, Janine L. Brown, Jay Sweeney, Erin M. Hanahoe, Tom Reidarson, Jeffry Proudfoot, and Don R. Bergfelt. 2014. “Thyroid Hormone Concentrations in Relation to Age, Sex, Pregnancy, and Perinatal Loss in Bottlenose Dolphins (Tursiops Truncatus).” General and Comparative Endocrinology 197: 73–81. https://doi.org/10.1016/j.ygcen.2013.11.021.

Applying novel methods in conservation physiology to understand cases of large whale mortalities

By Alejandro Fernánez Ajó, PhD student at NAU and GEMM Lab research technician

Although commercial whaling is currently banned and several whale populations show evidence of recovery, today´s whales are exposed to a variety of other human stressors (e.g., entanglement in fishing gear, vessel strikes, shipping noise, climate change, etc.; reviewed in Hunt et al., 2017a). The recovery and conservation of large whale populations is particularly important to the oceanic environment due to their key ecological role and unique biological traits, including their large body size, long lifespan and sizable home ranges (Magera et al., 2013; Atkinson et al., 2015; Thomas and Reeves, 2015). Thus, scientists must develop novel tools to overcome the challenges of studying whale physiology in order to distinguish the relative importance of the different impacts and guide conservation actions accordingly (Ayres et al., 2012; Hunt et al., 2013).

To this end, baleen hormone analysis represents a powerful tool for retrospective assessment of patterns in whale physiology (Hunt et al., 2014, 2016, 2017a, 2017b, 2018; Lysiak et. al., 2018; Fernández Ajó et al., 2018; Rolland et al., 2019). Moreover, hormonal panels, which include multiple hormones, are helping to better clarify and distinguish between the physiological effects of different sources of anthropogenic and environmental stressors (Ayres et al., 2012; Wasser et al., 2017; Lysiak et al., 2018; Romero et al., 2015).

What is Baleen? Baleen is a stratified epithelial tissue consisting of long, fringed plates that grow downward from the upper jaw, which collectively form the whale´s filter-feeding apparatus (Figure 1). This tissue accumulates hormones as it grows. Hormones are deposited in a linear fashion with time so that a single plate of baleen allows retrospective assessment and evaluation of a whales’ physiological condition, and in calves baleen provides a record of the entire lifespan including part of their gestation. Baleen samples are also readily accessible and routinely collected during necropsy along with other samples and relevant information.

Figure 1: Top: A baleen plate from a southern right whale calf (Source: Fernández Ajó et al. 2018). Bottom: A southern right whale with mouth open exposing its baleen (photo credit: Stephen Johnson).

Why are the Southern Right Whales calves (SRW) dying in Patagonia?

I am a Fulbright Ph.D. student in the Buck Laboratory  at Northern Arizona University since Fall 2017, a researcher with the Whale Conservation Institute of Argentina (Instituto de Conservación de Ballenas) and Field Technician for the GEMM Lab over the summer. I focus my research on the application and development of novel methods in conservation physiology to improve our understanding of how physiological parameters are affected by human pressures that impact large whales and marine mammals. I am especially interested in understanding the underlaying causes of large whale mortalities with the aim of preventing their occurrence when possible. In particular, for my Ph.D. dissertation, I am studying a die-off case of Southern Right Whale (SRW) calves, Eubalaena australis, off Peninsula Valdés (PV) in Patagonia-Argentina (Figure 2).

Prior to 2000, annual calf mortality at PV was considered normal and tracked the population growth rate (Rowntree et al., 2013). However, between 2007 and 2013, 558 whales died, including 513 newborn calves (Sironi et al., 2018). Average total whale deaths per year increased tenfold, from 8.2 in 1993-2002 to 80 in 2007-2013. These mortality levels have never before been observed for the species or any other population of whales (Thomas et al., 2013, Sironi et al., 2018).


Figure 2: Study area, the red dots along the shoreline indicate the location where the whales were found stranded at Península Valdés in 2018 (Source: The Right Whale Program Research Report 2018, Sironi and Rowntree, 2018)

Among several hypotheses proposed to explain these elevated calf mortalities, harassment by Kelp Gulls, Larus dominicanus, on young calves stands out as a plausible cause and is a unique problem only seen at the PV calving ground. Kelp gull parasitism on SRWs near PV was first observed in the 1970’s (Thomas, 1988). Gulls primarily harass mother-calf pairs, and this parasitic behavior includes pecking on the backs of the whales and creating open wounds to feed on their skin and blubber. The current intensity of gull harassment has been identified as a significant environmental stressor to whales and potential contributor to calf deaths (Marón et al., 2015b; Fernández Ajó et al., 2018).

Figure 3: The significant preference for calves as a target of gull attacks highlights the impact of this parasitic behavior on this age class. The situation continues to be worrisome and serious for the health and well-being of newborn calves at Península Valdés. Left: A Kelp Gull landing on whale´s back to feed on her skin and blubber (Photo credit: Lisandro Crespo). Right: A calf with multiple lesions on its back produced by repeated gull attacks (Photo credit: ICB).

Quantifying gull inflicted wounds

Photographs of gull wounds on whales taken during necropsies and were quantified and assigned to one of seven objectively defined size categories (Fig. 4): extra-small (XS), small (S), medium (M), large (L), extra-large (XL), double XL (XXL) and triple XL (XXXL). The size and number of lesions on each whale were compared to baleen hormones to determine the effect of the of the attacks on the whales health.

Figure 4. Kelp gull lesion scoring. Source: Maron et al. 2015).

How baleen hormones are applied

Impact factors such as injuries, predation avoidance, storms, and starvation promote an increase in the secretion of the glucocorticoids (GCs) cortisol and corticosterone (stress hormones), which then induce a variety of physiological and behavioral responses that help animals cope with the stressor. Prolonged exposure to chronic stress, however, may exceed the animal’s ability to cope with such stimuli and, therefore, adversely affects its body condition, its health, and even its survival. Triiodothyronine (T3), is the most biologically active form of the thyroid hormones and helps regulate metabolism. Sustained food deprivation causes a decrease in T3 concentrations, slowing metabolism to conserve energy stores. Combining GCs and T3 hormone measures allowed us to investigate and distinguish the relative impacts of nutritional and other sources of stressors.

Combining these novel methods produced unique results about whale physiology. With my research, we are finding that the GCs concentrations measured in calves´ baleen positively correlate with the intensity of gull wounding (Figure 4, 1 and 2), while calf’s baleen thyroid hormone concentrations are relative stable across time and do not correlate with intensity of gull wounding (Figure 4 – 3). Taken together these findings indicate that SRW calves exposed to Kelp gull parasitism and harassment experience high levels of physiological stress that compromise their health and survival. Ultimately these results will inform government officials and managers to direct conservation actions aimed to reduce the negative interaction between Kelp gulls and Southern Right Whales in Patagonia.

Figure 4: Physiological stress correlates with number of gull lesions (1 and 2). According to the best-fit linear model, immunoreactive baleen corticosterone (B) and cortisol (F) concentrations increased with wound severity (i.e. number of gull lesions). However, nutritional status indexed by baleen immunoreactive triiodothyronine (T3) concentrations does not correlate with the number of gull lesions (3). (Fernández Ajó et al. 2019, manuscript under revision)

Baleen hormones as a conservation tool

Baleen hormones represent a powerful tool for retrospective assessments of longitudinal trends in whale physiology by helping discriminate the underlying mechanisms by which different stressors may affect a whale’s health and physiology. Moreover, while most sample types used for studying whale physiology provide single time-point measures of current circulating hormone levels (e.g., skin or respiratory vapor), or information from previous few hours or days (e.g., urine and feces), baleen tissue provides a unique opportunity for longitudinal analyses of hormone patterns. These retrospective analyses can be conducted for both stranded or archived specimens, and can be conducted jointly with other biological markers (e.g., stable isotopes and biotoxins) to describe migration patterns and exposure to pollutants. Further research efforts on baleen hormones should focus on completing biological validations to better understand the hormone measurements in baleen and its correlation with measurements from alternative sample matrices (i.e., feces, skin, blubber, and respiratory vapors).

References:

Atkinson, S., Crocker, D., Houser, D., Mashburn, K., 2015. Stress physiology in marine mammals: how well do they fit the terrestrial model? J. Comp. Physiol. B. 185, 463–486. https://doi.org/10.1007/s00360-015-0901-0.

Ayres, K.L., Booth, R.K., Hempelmann, J.A., Koski, K.L., Emmons, C.K., Baird, R.W., Balcomb-Bartok, K., Hanson, M.B., Ford, M.J., Wasser, S.K., 2012. Distinguishing the impacts of inadequate prey and vessel traffic on an endangered killer whale (Orcinus orca) population. PLoS ONE. 7, e36842. https://doi.org/10.1371/journal.pone.0036842.

Fernández Ajó, A.A., Hunt, K., Uhart, M., Rowntree, V., Sironi, M., Marón, C.F., Di Martino, M., Buck, L., 2018. Lifetime glucocorticoid profiles in baleen of right whale calves: potential relationships to chronic stress of repeated wounding by Kelp Gull. Conserv. Physiol. 6, coy045. https://doi.org/10.1093/conphys/coy045.

Hunt, K., Lysiak, N., Moore, M., Rolland, R.M., 2017a. Multi-year longitudinal profiles of cortisol and corticosterone recovered from baleen of North Atlantic right whales (Eubalaena glacialis). Gen. Comp. Endocrinol. 254: 50–59. https://doi.org/10.1016/j.ygcen.2017.09.009.

Hunt, K.E., Hunt, K.E., Lysiak, N.S., Matthews, C.J.D., Lowe, C., Fernández-Ajo, A., Dillon, D., Willing, C., Heide-Jørgensen, M.P., Ferguson, S.H., Moore, M.J., Buck, C.L., 2018. Multi-year patterns in testosterone, cortisol and corticosterone in baleen from adult males of three whale species. Conserv. Physiol. 6, coy049. https://doi.org/10.1093/conphys/coy049.

Hunt, K.E., Hunt, K.E., Lysiak, N.S., Moore, M.J., Rolland R.M., 2016. Longitudinal progesterone profiles in baleen from female North Atlantic right whales (Eubalaena glacialis) match known calving history. Conserv. Physiol. 4, cow014. https://doi.org/10.1093/conphys/cow014.

Hunt, K.E., Lysiak, N.S., Moore, M.J., Seton, R.E., Torres, L., Buck, C.L., 2017b. Multiple steroid and thyroid hormones detected in baleen from eight whale species. Conserv. Physiol. 5, cox061. https://doi.org/10.1093/conphys/cox061.

Hunt, K.E., Moore, M.J., Rolland, R.M., Kellar, N.M., Hall, A.J., Kershaw, J., Raverty, S.A., Davis, C.E., Yeates, L.C., Fauquier, D.A., Rowles, T.K., Kraus, S.D., 2013. Overcoming the challenges of studying conservation physiology in large whales: a review of available methods. Conserv. Physiol. 1: cot006. https://doi.org/10.1093/conphys/cot006.

Hunt, K.E., Stimmelmayr, R., George, C., Hanns, C., Suydam, R., Brower, H., Rolland, R.M., 2014. Baleen hormones: a novel tool for retrospective assessment of stress and reproduction in bowhead whales (Balaena mysticetus). Conserv. Physiol. 2, cou030. doi: https://doi.org/10.1093/conphys/cou030.

Lysiak, N., Trumble, S., Knowlton, A., Moore, M., 2018. Characterizing the duration and severity of fishing gear entanglement on a North Atlantic right whale (Eubalaena glacialis) using stable isotopes, steroid and thyroid hormones in baleen. Front. Mar. Sci. 5: 168. https://doi.org/10.3389/fmars.2018.00168.

Magera, A.M., Flemming, J.E.M., Kaschner, K., Christensen, L.B., Lotze, H.K., 2013. Recovery trends in marine mammal populations. PLoS ONE. 8, e77908. https://doi.org/10.1371/journal.pone.0077908.

Marón, C.F., Beltramino, L., Di Martino, M., Chirife, A., Seger, J., Uhart, M., Sironi, M., Rowntree, V.J., 2015b Increased wounding of southern right whale (Eubalaena australis) calves by Kelp Gulls (Larus dominicanus) at Península Valdés, Argentina., PLoS ONE. 10, p. e0139291. https://doi.org/10.1371/journal.pone.0139291.

Marón, C.F., Rowntree, V.J., Sironi, M., Uhart, M., Payne, R.S., Adler, F.R., Seger, J., 2015a. Estimating population consequences of increased calf mortality in the southern right whales off Argentina. SC/66a/BRG/1 presented to the IWC Scientific Committee, San Diego, USA. Available at: https://iwc.int/home

Rolland, R.M., Graham, K.M., Stimmelmayr, R., Suydam, R. S., George, J.C., 2019. Chronic stress from fishing gear entanglement is recorded in baleen from a bowhead whale (Balaena mysticetus). Mar. Mam. Sci. https://doi.org/10.1111/mms.12596.

Romero, L.M., Platts, S.H., Schoech, S.J., Wada, H., Crespi, E., Martin, L.B., Buck, C.L., 2015. Understanding Stress in the Healthy Animal – Potential Paths for Progress. Stress. 18(5), 491-497.

Rowntree, V.J., Uhart, M.M., Sironi, M., Chirife, A., Di Martino, M., La Sala, L., Musmeci, L., Mohamed, N., Andrejuk, J., McAloose, D., Sala, J., Carribero, A., Rally, H., Franco, M., Adler, F., Brownell, R. Jr, Seger, J., Rowles, T., 2013. Unexplained recurring high mortality of southern right whale Eubalaena australis calves at Península Valdés, Argentina. Mar. Ecol. Prog. Ser. 493:275–289. https://doi.org/10.3354/meps10506.

Sironi, M. Rowntree, V., Di Martino, M., Alzugaray, L.,Rago, V., Marón, C.F., Uhart M., 2018. Southern right whale mortalities at Península Valdes, Argentina: updated information for 2016-2017. SC/67B/CMP/06 presented to the IWC Scientific Committee, Slovenia. Available at: https://iwc.int/home.

Sironi, M. Rowntree, V., Snowdon, C., Valenzuela, L., Marón C., 2009. Kelp Gulls (Larus dominicanus) feeding on southern right whales (Eubalaena australis) at Península Valdes, Argentina: updated estimates and conservation implications. SC/61/BRG19. presented to the IWC Scientific Committee, Portugal. Available at: https://iwc.int/home.

Thomas, P., Reeves, R., 2015. Status of the world’s baleen whales. Mar. Mam. Sci. 32:682–734. https://doi.org/10.1111/mms.12281.

Thomas, P., Uhart, M., McAloose, D., Sironi, M., Rowntree, V.J., Brownell, Jr. R., Gulland, F.M.D., Moore, M., Marón, C., Wilson, C., 2013. Workshop on the southern right whale die-off at Península Valdés, Argentina. SC/60/BRG15 presented to the IWC Scientific Committee, South Korea. Available at: https://iwc.int/home

Thomas, P.O. 1988. Kelp Gulls, Larus dominicanus, are parasites on flesh of the right whale, Eubalaena australis. Ethology. 79:89-103. https://doi.org/10.1111/j.1439-0310.1988.tb00703.x.

Wasser, S.K., Lundin, J.I., Ayres, K., Seely, E., Giles, D., Balcomb, K., Hempelmann, J., Parsons, K., Booth, R., 2017. Population growth is limited by nutritional impacts on pregnancy success in endangered Southern Resident killer whales (Orcinus orca). PLoS ONE. 12, e0179824. https://doi.org/10.1371/journal.pone.0179824.

Lingering questions on the potential to bring sea otters back to Oregon

By Dominique Kone, Masters Student in Marine Resource Management

By now, I’m sure you’re aware of recent interests to reintroduce sea otters to Oregon. To inform this effort, my research focuses on predicting suitable sea otter habitat and investigating the potential ecological effects if sea otters are reintroduced in the future. This information will help managers gain a better understanding of the potential for sea otters to reestablish in Oregon, as well as how Oregon’s ecosystems may change via top-down processes. These analyses will address some sources of uncertainties of this effort, but there are still many more questions researchers could address to further guide this process. Here, I note some lingering questions I’ve come across in the course of conducting my research. This is not a complete list of all questions that could or should be investigated, but they represent some of the most interesting questions I have and others have in Oregon.

Credit: Todd Mcleish

The questions, and our associated knowledge on each of these topics:

Is there enough available prey to support a robust sea otter population in Oregon?

Sea otters require approximately 30% of their own body weight in food every day (Costa 1978, Reidman & Estes 1990). With a large appetite, they not only need to spend most of their time foraging, but require a steady supply of prey to survive. For predators, we assume the presence of suitable habitat is a reliable proxy for prey availability (Redfern et al. 2006). Whereby, quality habitat should supply enough prey to sustain predators at higher trophic levels.

In making these habitat predictions for sea otters, we must also recognize the potential limitations of this “habitat equals prey” paradigm, in that there may be parcels of habitat where prey is unavailable or inaccessible. In Oregon, there could be unknown processes unique to our nearshore ecosystems that would support less prey for sea otters. This possibility highlights the importance of not only understanding how much suitable habitat is available for foraging sea otters, but also how much prey is available in these habitats to sustain a viable otter population in the future. Supplementing these habitat predictions with fishery-independent prey surveys is one way to address this question.

Credit: Suzi Eszterhas via Smithsonian Magazine

How will Oregon’s oceanographic seasonality alter or impact habitat suitability?

Sea otters along the California coast exist in an environment with persistent Giant kelp beds, moderate to low wave intensity, and year-round upwelling regimes. These environmental variables and habitat factors create productive ecosystems that provide quality sea otter habitat and a steady supply of prey; thus, supporting high densities of sea otters. This environment contrasts with the Oregon coast, which is characterized by seasonal changes in bull kelp and wave intensity. Summer months have dense kelp beds, calm surf, and strong upwellings. While winter months have little to no kelp, weak upwellings, and intense wave climates. These seasonal variations raise the question as to how these temporal fluctuations in available habitat could impact the number of sea otters able to survive in Oregon.

In Washington – an environment like Oregon – sea otters exhibit seasonal distribution patterns in response to intensifying wave climates. During calm summer months, sea otters primarily forage along the outer coast, but move into more protected areas, such as the Strait of Juan de Fuca, during winter months (Laidre et al. 2009). If sea otters were reintroduced to Oregon, we may very well observe similar seasonal movement patterns (e.g. dispersal into estuaries), but the degree to which this seasonal redistribution and reduction in foraging habitat could impact sea otter reestablishment and recovery is currently unknown.

Credit: Oregon Coast Aquarium

In the event of a reintroduction, do northern or southern sea otters have a greater capacity to adapt to Oregon environments?

In the early 1970’s, Oregon’s first sea otter translocation effort failed (Jameson et al. 1982). Since then, hypotheses on the potential ecological differences between northern and southern sea otters have been proposed as potential factors of the failed effort, potentially due to different abilities to exploit specific prey species. Studies have demonstrated that northern and southern sea otters have slight morphological differences – northern otters having larger skulls and teeth than southern otters (Wilson et al. 1991). This finding has created the hypothesis that the northern otter’s larger skull and teeth allow it to consume prey with denser exoskeletons, and thereby can exploit a greater diversity of prey species. However, there appears to be a lack of evidence to suggest larger skulls and teeth translate to greater bite force. Based on morphology alone, either sub-species could be just as successful in exploiting different prey species.

A different direction to address questions around adaptability is to look at similarities in habitat and oceanographic characteristics. Sea otters exist along a gradient of habitat types (e.g. kelp forests, estuaries, soft-sediment environments) and oceanographic conditions (e.g. warm-temperature to cooler sub-Arctic waters) (Laidre et al. 2009, Lafferty et al. 2014). Yet, we currently don’t know how well or quickly otters can adapt when they expand into new habitats that differ from ones they are familiar with. Sea otters must be efficient foragers and need to acquire skills that allow them to effectively hunt specific prey species (Estes et al. 2003). Hypothetically, if we take sea otters from rocky environments where they’ve developed foraging skills to hunt sea urchins and abalones, and place them in a soft-sediment environment, how quickly would they develop new foraging skills to exploit soft-sediment prey species? Would they adapt quickly enough to meet their daily prey requirements?

Credit: Eric Risberg/Associated Press via The Columbian

In Oregon, specifically, how might climate change impact sea otters, and how might sea otters mediate climate impacts?

Climate change has been shown to directly impact many species via changes in temperature (Chen et al. 2011). Some species have specific thermal tolerances, in which they can only survive within a specified temperature range (i.e. maximum and minimum). Once the temperature moves out of that range, the species can either move with those shifting water masses, behaviorally adapt or perish (Sunday et al. 2012). It’s unclear if and how changing temperatures will impact sea otters, directly. However, sea otters could still be indirectly affected via impacts to their prey. If prey species in sea otter habitat decline due to changing temperatures, this would reduce available food for otters. Ocean acidification (OA) is another climate-induced process that could indirectly impact sea otters. By creating chemical conditions that make it difficult for species to form shells, OA could decrease the availability of some prey species, as well (Gaylord et al. 2011).

Interestingly, these pathways between sea otters and climate change become more complex when we consider the potentially mediating effects from sea otters. Aquatic plants – such as kelp and seagrass – can reduce the impacts of climate change by absorbing and taking carbon out of the water column (Krause-Jensen & Duarte 2016). This carbon sequestration can then decrease acidic conditions from OA and mediate the negative impacts to shell-forming species. When sea otters catalyze a tropic cascade, in which herbivores are reduced and aquatic plants are restored, they could increase rates of carbon sequestration. While sea otters could be an effective tool against climate impacts, it’s not clear how this predator and catalyst will balance each other out. We first need to investigate the potential magnitude – both temporal and spatial – of these two processes to make any predictions about how sea otters and climate change might interact here in Oregon.

Credit: National Wildlife Federation

In Summary

There are several questions I’ve noted here that warrant further investigation and could be a focus for future research as this potential sea otter reintroduction effort progresses. These are by no means every question that should be addressed, but they do represent topics or themes I have come across several times in my own research or in conversations with other researchers and managers. I think it’s also important to recognize that these questions predominantly relate to the natural sciences and reflect my interest as an ecologist. The number of relevant questions that would inform this effort could grow infinitely large if we expand our disciplines to the social sciences, economics, genetics, so on and so forth. Lastly, these questions highlight the important point that there is still a lot we currently don’t know about (1) the ecology and natural behavior of sea otters, and (2) what a future with sea otters in Oregon might look like. As with any new idea, there will always be more questions than concrete answers, but we – here in the GEMM Lab – are working hard to address the most crucial ones first and provide reliable answers and information wherever we can.

References:

Chen, I., Hill, J. K., Ohlemuller, R., Roy, D. B., and C. D. Thomas. 2011. Rapid range shifts of species associated with high levels of climate warming. Science. 333: 1024-1026.

Costa, D. P. 1978. The ecological energetics, water, and electrolyte balance of the California sea otter (Enhydra lutris). Ph.D. dissertation, University of California, Santa Cruz.

Estes, J. A., Riedman, M. L., Staedler, M. M., Tinker, M. T., and B. E. Lyon. 2003. Individual variation in prey selection by sea otters: patterns, causes and implications. Journal of Animal Ecology. 72: 144-155.

Gaylord et al. 2011. Functional impacts of ocean acidification in an ecologically critical foundation species. Journal of Experimental Biology. 214: 2586-2594.

Jameson, R. J., Kenyon, K. W., Johnson, A. M., and H. M. Wight. 1982. History and status of translocated sea otter populations in North America. Wildlife Society Bulletin. 10(2): 100-107.

Krause-Jensen, D., and C. M. Duarte. 2016. Substantial role of macroalgae in marine carbon sequestration. Nature Geoscience. 9: 737-742.

Lafferty, K. D., and M. T. Tinker. 2014. Sea otters are recolonizing southern California in fits and starts. Ecosphere.5(5).

Laidre, K. L., Jameson, R. J., Gurarie, E., Jeffries, S. J., and H. Allen. 2009. Spatial habitat use patterns of sea otters in coastal Washington. Journal of Marine Mammalogy. 90(4): 906-917.

Redfern et al. 2006. Techniques for cetacean-habitat modeling. Marine Ecology Progress Series. 310: 271-295.

Reidman, M. L. and J. A. Estes. 1990. The sea otter (Enhydra lutris): behavior, ecology, and natural history. United States Department of the Interior, Fish and Wildlife Service, Biological Report. 90: 1-126.

Sunday, J. M., Bates, A. E., and N. K. Dulvy. 2012. Thermal tolerance and the global redistribution of animals. Nature: Climate Change. 2: 686-690.

Wilson, D. E., Bogan, M. A., Brownell, R. L., Burdin, A. M., and M. K. Maminov. 1991. Geographic variation in sea otters, Ehydra lutris. Journal of Mammalogy. 72(1): 22-36.

Eyes from Space: Using Remote Sensing as a Tool to Study the Ecology of Blue Whales

By Christina Garvey, University of Maryland, GEMM Lab REU Intern

It is July 8th and it is my 4th week here in Hatfield as an REU intern for Dr. Leigh Torres. My name is Christina Garvey and this summer I am studying the spatial ecology of blue whales in the South Taranaki Bight, New Zealand. Coming from the east coast, Oregon has given me an experience of a lifetime – the rugged shorelines continue to take my breath away and watching sea lions in Yaquina Bay never gets old. However, working on my first research project has by far been the greatest opportunity and I have learned so much in so little time. When Dr. Torres asked me to contribute to this blog I was unsure of how I would write about my work thus far but I am excited to have the opportunity to share the knowledge I have gained with whoever reads this blog post.

The research project that I will be conducting this summer will use remotely sensed environmental data (information collected from satellites) to predict blue whale distribution in the South Taranaki Bight (STB), New Zealand. Those that have read previous blogs about this research may remember that the STB study area is created by a large indentation or “bight” on the southern end of the Northern Island. Based on multiple lines of evidence, Dr. Leigh Torres hypothesized the presence of an unrecognized blue whale foraging ground in the STB (Torres 2013). Dr. Torres and her team have since proved that blue whales frequent this region year-round; however, the STB is also very industrial making this space-use overlap a conservation concern (Barlow et al. 2018). The increasing presence of marine industrial activity in the STB is expected to put more pressure on blue whales in this region, whom are already vulnerable from the effects of past commercial whaling (Barlow et al. 2018) If you want to read more about blue whales in the STB check out previous blog posts that talk all about it!

Figure 1. A blue whale surfaces in front of a floating production storage and offloading vessel servicing the oil rigs in the South Taranaki Bight. Photo by D. Barlow.

Figure 2. South Taranaki Bight, New Zealand, our study site outlined by the red box. Kahurangi Point (black star) is the site of wind-driven upwelling system.

The possibility of the STB as an important foraging ground for a resident population of blue whales poses management concerns as New Zealand will have to balance industrial growth with the protection and conservation of a critically endangered species. As a result of strong public support, there are political plans to implement a marine protected area (MPA) in the STB for the blue whales. The purpose of our research is to provide scientific knowledge and recommendations that will assist the New Zealand government in the creation of an effective MPA.

In order to create an MPA that would help conserve the blue whale population in the STB, we need to gather a deeper understanding of the relationship between blue whales and this marine environment. One way to gain knowledge of the oceanographic and ecological processes of the ocean is through remote sensing by satellites, which provides accessible and easy to use environmental data. In our study we propose remote sensing as a tool that can be used by managers for the design of MPAs (through spatial and temporal boundaries). Satellite imagery can provide information on sea surface temperature (SST), SST anomaly, as well as net primary productivity (NPP) – which are all measurements that can help describe oceanographic upwelling, a phenomena that is believed to be correlated to the presence of blue whales in the STB region.

Figure 3. The stars of the show: blue whales. A photograph captured from the small boat of one animal fluking up to dive down as another whale surfaces close by. (Photo credit: L. Torres)

Past studies in the STB showed evidence of a large upwelling event that occurs off the coast of Kahurangi Point (Fig. 2), on the northwest tip of the South Island (Shirtcliffe et al. 1990). In order to study the relationship of this upwelling to the distribution of blue whales, I plan to extract remotely sensed data (SST, SST anomaly, & NPP) off the coast of Kahurangi and compare it to data gathered from a centrally located site within the STB, which is close to oil rigs and so is of management interest. I will first study how decreases in sea surface temperature at the site of upwelling (Kahurangi) are related to changes in sea surface temperature at this central site in the STB, while accounting for any time differences between each occurrence. I expect that this relationship will be influenced by the wind patterns, and that there will be changes based on the season. I also predict that drops in temperature will be strongly related to increases in primary productivity, since upwelling brings nutrients important for photosynthesis up to the surface. These dips in SST are also expected to be correlated to blue whale occurrence within the bight, since blue whale prey (krill) eat the phytoplankton produced by the productivity.

Figure 4. A blue whale lunges on an aggregation of krill. UAS piloted by Todd Chandler.

To test the relationships I determine between remotely sensed data at different locations in the STB, I plan to use blue whale observations from marine mammal observers during a seismic survey conducted in 2013, as well as sightings recorded from the 2014, 2016, and 2017 field studies led by Dr. Leigh Torres. By studying the statistical relationships between all of these variables I hope to prove that remote sensing can be used as a tool to study and understand blue whale distribution.

I am very excited about this research, especially because the end goal of creating an MPA really gives me purpose. I feel very lucky to be part of a project that could make a positive impact on the world, if only in just a little corner of New Zealand. In the mean time I’ll be here in Hatfield doing the best I can to help make that happen.

References: 

Barlow DR, Torres LG, Hodge KB, Steel D, Baker CS, Chandler TE, Bott N, Constantine R, Double MC, Gill P, Glasgow D, Hamner RM, Lilley C, Ogle M, Olson PA, Peters C, Stockin KA, Tessaglia-hymes CT, Klinck H (2018) Documentation of a New Zealand blue whale population based on multiple lines of evidence. Endanger Species Res 36:27–40.

Shirtcliffe TGL, Moore MI, Cole AG, Viner AB, Baldwin R, Chapman B (1990) Dynamics of the Cape Farewell upwelling plume, New Zealand. New Zeal J Mar Freshw Res 24:555–568.

Torres LG (2013) Evidence for an unrecognised blue whale foraging ground in New Zealand. New Zeal J Mar Freshw Res 47:235–248.

Zooming in: A closer look at bottlenose dolphin distribution patterns off of San Diego, CA

By: Alexa Kownacki, Ph.D. Student, OSU Department of Fisheries and Wildlife, Geospatial Ecology of Marine Megafauna Lab

Data analysis is often about parsing down data into manageable subsets. My project, which spans 34 years and six study sites along the California coast, requires significant data wrangling before full analysis. As part of a data analysis trial, I first refined my dataset to only the San Diego survey location. I chose this dataset for its standardization and large sample size; the bulk of my sightings, over 4,000 of the 6,136, are from the San Diego survey site where the transect methods were highly standardized. In the next step, I selected explanatory variable datasets that covered the sighting data at similar spatial and temporal resolutions. This small endeavor in analyzing my data was the first big leap into understanding what questions are feasible in terms of variable selection and analysis methods. I developed four major hypotheses for this San Diego site.

The study species: common bottlenose dolphin (Tursiops truncatus) seen along the California coastline in 2015. Image source: Alexa Kownacki.

Hypotheses:

H1: I predict that bottlenose dolphin sightings along the San Diego transect throughout the years 1981-2015 exhibit clustered distribution patterns as a result of the patchy distributions of both the species’ preferred habitats, as well as the social nature of bottlenose dolphins.

H2: I predict there would be higher densities of bottlenose dolphin at higher latitudes spanning 1981-2015 due to prey distributions shifting northward and less human activities in the northerly sections of the transect.

H3: I predict that during warm (positive) El Niño Southern Oscillation (ENSO) months, the dolphin sightings in San Diego would be distributed more northerly, predominantly with prey aggregations historically shifting northward into cooler waters, due to (secondarily) increasing sea surface temperatures.

H4: I predict that along the San Diego coastline, bottlenose dolphin sightings are clustered within two kilometers of the six major lagoons, with no specific preference for any lagoon, because the murky, nutrient-rich waters in the estuarine environments are ideal for prey protection and known for their higher densities of schooling fishes.

Data Description:

The common bottlenose dolphin (Tursiops truncatus) sighting data spans 1981-2015 with a few gap years. Sightings cover all months, but not in all years sampled. The same transect in San Diego was surveyed in a small, rigid-hulled inflatable boat with approximately a two-kilometer observation area (one kilometer surveyed 90 degrees to starboard and port of the bow).

I wanted to see if there were changes in dolphin distribution by latitude and, if so, whether those changes had a relationship to ENSO cycles and/or distances to lagoons. For ENSO data, I used the NOAA database that provides positive, neutral, and negative indices (1, 0, and -1, respectively) by each month of each year. I matched these ENSO data to my month-date information of dolphin sighting data. Distance from each lagoon was calculated for each sighting.

Figure 1. Map representing the San Diego transect, represented with a light blue line inside of a one-kilometer buffered “sighting zone” in pale yellow. The dark pink shapes are dolphin sightings from 1981-2015, although some are stacked on each other and cannot be differentiated. The lagoons, ranging in size, are color-coded. The transect line runs from the breakwaters of Mission Bay, CA to Oceanside Harbor, CA.

Results: 

H1: True, dolphins are clustered and do not have a uniform distribution across this area. Spatial analysis indicated a less than a 1% likelihood that this clustered pattern could be the result of random chance (Fig. 1, z-score = -127.16, p-value < 0.0001). It is well-known that schooling fishes have a patchy distribution, which could influence the clustered distribution of their dolphin predators. In addition, bottlenose dolphins are highly social and although pods change in composition of individuals, the dolphins do usually transit, feed, and socialize in small groups.

Figure 2. Summary from the Average Nearest Neighbor calculation in ArcMap 10.6 displaying that bottlenose dolphin sightings in San Diego are highly clustered. When the z-score, which corresponds to different colors on the graphic above, is strongly negative (< -2.58), in this case dark blue, it indicates clustering. Because the p-value is very small, in this case, much less than 0.01, these results of clustering are strongly significant.

H2: False, dolphins do not occur at higher densities in the higher latitudes of the San Diego study site. The sightings are more clumped towards the lower latitudes overall (p < 2e-16), possibly due to habitat preference. The sightings are closer to beaches with higher human densities and human-related activities near Mission Bay, CA. It should be noted, that just north of the San Diego transect is the Camp Pendleton Marine Base, which conducts frequent military exercises and could deter animals.

Figure 3. Histogram comparing the latitudes with the frequency of dolphin sightings in San Diego, CA. The x-axis represents the latitudinal difference from the most northern part of the transect to each dolphin sighting. Therefore, a small difference would translate to a sighting being in the northern transect areas whereas large differences would translate to sightings being more southerly. This could be read from left to right as most northern to most southern. The y-axis represents the frequency of which those differences are seen, that is, the number of sightings with that amount of latitudinal difference, or essentially location on the transect line. Therefore, you can see there is a peak in the number of sightings towards the southern part of the transect line.

H3: False, during warm (positive) El Niño Southern Oscillation (ENSO) months, the dolphin sightings in San Diego were more southerly. In colder (negative) ENSO months, the dolphins were more northerly. The differences between sighting latitude and ENSO index was significant (p<0.005). Post-hoc analysis indicates that the north-south distribution of dolphin sightings was different during each ENSO state.

Figure 4. Boxplot visualizing distributions of dolphin sightings latitudinal differences and ENSO index, with -1,0, and 1 representing cold, neutral, and warm years, respectively.

H4: True, dolphins are clustered around particular lagoons. Figure 5 illustrates how dolphin sightings nearest to Lagoon 6 (the San Dieguito Lagoon) are always within 0.03 decimal degrees. Because of how these data are formatted, decimal degrees is the easiest way to measure change in distance (in this case, the difference in latitude). In comparison, dolphins at Lagoon 5 (Los Penasquitos Lagoon) are distributed across distances, with the most sightings further from the lagoon.

Figure 5. Bar plot displaying the different distances from dolphin sighting location to the nearest lagoon in San Diego in decimal degrees. Note: Lagoon 4 is south of the study site and therefore was never the nearest lagoon.

I found a significant difference between distance to nearest lagoon in different ENSO index categories (p < 2.55e-9): there is a significant difference in distance to nearest lagoon between neutral and negative values and positive and neutral years. Therefore, I hypothesize that in neutral ENSO months compared to positive and negative ENSO months, prey distributions are changing. This is one possible hypothesis for the significant difference in lagoon preference based on the monthly ENSO index. Using a violin plot (Fig. 6), it appears that Lagoon 5, Los Penasquitos Lagoon, has the widest variation of sighting distances in all ENSO index conditions. In neutral years, Lagoon 0, the Buena Vista Lagoon has multiple sightings, when in positive and negative years it had either no sightings or a single sighting. The Buena Vista Lagoon is the most northerly lagoon, which may indicate that in neutral ENSO months, dolphin pods are more northerly in their distribution.

Figure 6. Violin plot illustrating the distance from lagoons of dolphin sightings under different ENSO conditions. There are three major groups based on ENSO index: “-1” representing cold years, “0” representing neutral years, and “1” representing warm years. On the x-axis are lagoon IDs and on the y-axis is the distance to the nearest lagoon in decimal degrees. The wider the shapes, the more sightings, therefore Lagoon 6 has many sightings within a very small distance compared to Lagoon 5 where sightings are widely dispersed at greater distances.


Bottlenose dolphins foraging in a small group along the California coast in 2015. Image source: Alexa Kownacki.

Takeaways to science and management: 

Bottlenose dolphins have a clustered distribution which seems to be related to ENSO monthly indices, and likely, their social structures. From these data, neutral ENSO months appear to have something different happening compared to positive and negative months, that is impacting the sighting distributions of bottlenose dolphins off the San Diego coastline. More research needs to be conducted to determine what is different about neutral months and how this may impact this dolphin population. On a finer scale, the six lagoons in San Diego appear to have a spatial relationship with dolphin sightings. These lagoons may provide critical habitat for bottlenose dolphins and/or for their preferred prey either by protecting the animals or by providing nutrients. Different lagoons may have different spans of impact, that is, some lagoons may have wider outflows that create larger nutrient plumes.

Other than the Marine Mammal Protection Act and small protected zones, there are no safeguards in place for these dolphins, whose population hovers around 500 individuals. Therefore, specific coastal areas surrounding lagoons that are more vulnerable to habitat loss, habitat degradation, and/or are more frequented by dolphins, may want greater protection added at a local, state, or federal level. For example, the Batiquitos and San Dieguito Lagoons already contain some Marine Conservation Areas with No-Take Zones within their reach. The city of San Diego and the state of California need better ways to assess the coastlines in their jurisdictions and how protecting the marine, estuarine, and terrestrial environments near and encompassing the coastlines impacts the greater ecosystem.

This dive into my data was an excellent lesson in spatial scaling with regards to parsing down my data to a single study site and in matching my existing data sets to other data that could help answer my hypotheses. Originally, I underestimated the robustness of my data. At first, I hesitated when considering reducing the dolphin sighting data to only include San Diego because I was concerned that I would not be able to do the statistical analyses. However, these concerns were unfounded. My results are strongly significant and provide great insight into my questions about my data. Now, I can further apply these preliminary results and explore both finer and broader scale resolutions, such as using the more precise ENSO index values and finding ways to compare offshore bottlenose dolphin sighting distributions.

Our GEM(M), Ruby, is back in action!

By Lisa Hildebrand, MSc student, OSU Department of Fisheries and Wildlife, Geospatial Ecology of Marine Megafauna Lab

Every season, or significant period of time, usually has a distinct event that marks its beginning. For example, even though winter officially begins when the winter solstice occurs sometime between December 20 and December 23, many people often associate the first snowfall as the real start of winter. To mark the beginning of schooling, when children start 1stgrade in Germany (which is where I’m from), they receive something called a “Zuckertüte”, which translated means “sugar bag”. It is a large (sometimes as large as the child) cone-shaped container made of cardboard filled with toys, chocolates, sweets, school supplies and various other treats topped with a large bow.

Receiving my Zuckertüte in August of 2001 before starting 1st grade. Source: Ines Hildebrand.

I still remember (and even have) mine – it was almost as tall as I was, had a large Barbie printed on it (and a real one sitting on top of it) and was bright pink. And of course, while at a movie theatre, once the lights dim completely and the curtain surrounding the screen opens just a little further, members of the audience stop chit-chatting or sending text messages, everyone quietens down and puts their devices away – the film is about to start. There are hundreds upon thousands of examples like these – moments, events, days that mark the start of something.

In the past, the beginning of summer has always been tied to two things for me: the end of school and the chance to be outside in the sun for many hours and days. This reality has changed slightly since moving to Oregon. While I don’t technically have any classes during the summer, the work definitely won’t stop. There are still dozens of papers to read, samples to run in the lab, and data points to plot. For anyone from Oregon or the Pacific Northwest (PNW), it’s pretty well known that the weather can be a little unpredictable and variable, meaning that summer might not always be filled with sunny days. Despite somewhat losing these two “summer markers”, I have found a new event to mark the beginning of summer – the arrival of the gray whales.

Their propensity for coastal waters and near-shore feeding is part of what makes gray whales so unique and arguably “easier” to study than some other baleen whale species. Image captured under NOAA/NMFS permit #21678. Source: Leigh Torres.


It’s official – the gray whale field season is upon us! As many of you may already know, the GEMM Lab has two active gray whale research projects: investigating the impacts of ocean noise on gray whale physiology and exploring potential individual foraging specialization among the Pacific Coast Feeding Group (PCFG) gray whales. Both projects involve field work, with the former operating out of Newport and the latter taking place in Port Orford, both collecting photographs and a variety of samples and tracklines to study the PCFG, which is a sub-group of the larger Eastern North Pacific (ENP) population. June 1st is the widely accepted “cut-off date” for the PCFG whales, whereby gray whales seen after June 1st along the PNW coastline (specifically northern California, Oregon, Washington and British Columbia) are considered members of the PCFG. While this date is not the only qualifying factor for an individual to be considered a PCFG member, it is a good general rule of thumb. Since last week happened to be the first week of June, PI Leigh Torres, field technician Todd Chandler and myself launched out onto the Pacific Ocean in our trusty RHIB Ruby twice looking for gray whales, and it sure was a successful start to the season!

Even though I have done small boat-based field work before, every project and field team operates a little differently, which is why I was a little nervous at first. There are a lot of components to the Newport-based project as Leigh & co. assess gray whale physiology by collecting fecal samples, drone imagery and taking photographs, observing behavior patterns, as well as assessing local prey through GoPro footage and light traps. I wasn’t worried about the prey components of the research, since there is plenty of prey sampling involved in my Port Orford research, however I was worried about the whale side of things. I wasn’t sure whether I would be able to catch the drone as it returned back home to Ruby, fearing I might fumble and let it slip through my fingers. I also experienced slight déjà vu when handling the net we use to collect the fecal samples as I was forced to think back to some previous field work that involved collecting a biopsy dart with a net as well. During that project, I had somehow managed to get the end of the net stuck in the back of the boat and as I tried to scoop up the biopsy dart with the net-end, the pole became more and more stuck while the water kept dragging the net-end down and eventually the pole ended up snapping in my hands. On top of all this anxiety and work, trying to find your footing in a small RHIB like Ruby packed with lots of gear and a good amount of swell doesn’t make any of those tasks any easier.

However, as it turned out, none of my fears came to fruition. As soon as Todd fired up Ruby’s engine and we whizzed out and under the Newport bridge, I felt exhilarated. I love field work and was so excited to be out on the water again. During the two days I was able to observe multiple individuals of a species of whale that I find unique and fascinating.

Markings and pigmentation on the flukes are also unique to individuals and allow us to perform photo identification to track individuals over months and years. Image captured under NOAA/NMFS permit #21678. Source: Leigh Torres.

I felt back in my natural element and working with Leigh and Todd was rewarding and fun, as I have so much to learn from their years of experience and natural talent in the field dealing with stressful situations and juggling multiple components and gear. Even though I wasn’t out there collecting data for my own project, some of my observations did get me thinking about what I hope to focus on in my thesis – individualization. It is always interesting to see how differently whales will behave, whether due to the substrate we find them over, the water depths we find them in, or what their surfacing patterns are like. Although I still have six weeks to go until my field season starts and feel lucky to have the opportunity to help Leigh and Todd with the Newport field work, I am already looking forward to getting down to Port Orford in mid-July and starting the fifth consecutive gray whale field season down there.

But back to Newport – over the course of two days, we were able to deploy and retrieve one light trap to collect zooplankton, collect two fecal samples, perform two GoPro drops, fly the drone three times, and take hundreds of photos of whales. Leigh and Todd were both glad to be reunited with an old friend while I felt lucky to be able to meet such a famous lady – Scarback. A whale with a long sighting history not just for the GEMM Lab but for various researchers along the coast that study this population. Scarback is well-known (and easily identified) by the large concave injury on her back that is covered in whale lice, or cyamids. While there are stories about how Scarback’s wound came to be, it is not known for sure how she was injured. However, what researchers do know is that the wound has not stopped this female from reproducing and successfully raising several calves over her lifetime. After hearing her story from Leigh, I wasn’t surprised that both she and Todd were so thrilled to get both a fecal sample and a drone flight from her early in the season. The two days weren’t all rosy; most of day 1 was shrouded in a cloud of mist resulting in a thin but continuous layer of moisture forming on our clothes, while on day 2 we battled with some pretty big swells (up to 6 feet tall) and in typical Oregon coast style we were victims of a sudden downpour for about 10 minutes. We had some excellent sightings and some not-so-excellent sightings. Sightings where we had four whales surrounding our boat at the same time and sightings where we couldn’t re-locate a whale that had popped up right next to us. It happens.


A local celebrity – Scarback. Image captured under NOAA/NMFS permit #21678. Source: Lisa Hildebrand.


An ecstatic Lisa with wild hair standing in the bow pulpit of Ruby camera at the ready. Source: Leigh Torres.

Field work is certainly one of my favorite things in the world. The smell of the salt, the rustling of cereal bar wrappers, the whipping of hair, the perpetual rosy noses and cheeks no matter how many times you apply and re-apply sunscreen, the awkward hilarity of clambering onto the back of the boat where the engine is housed to take a potty break, the whooshing sound of a blow, the sometimes gentle and sometimes aggressive rocking of the boat, the realization that you haven’t had water in four hours only to chug half of your water in a few seconds, the waft of peanut butter and jelly sandwiches, the circular footprint where a whale has just gracefully dipped beneath the surface slipping away from view. I don’t think I will ever tire of any of those things.


Should scientists engage in advocacy?

By Dominique Kone, Masters Student in Marine Resource Management

Should scientists engage in advocacy? This question is one of the most debated topics in conservation and natural resource management. Some experts firmly oppose researchers advocating for policy decisions because such actions potentially threaten the credibility of their science. While others argue that with environmental issues becoming more complex, society would benefit from hearing scientists’ opinions and preferences on proposed actions. While both arguments are valid, we must recognize the answer to this question may never be a universal yes or no. As an early-career scientist, I’d like to share some of my observations and thoughts on this topic, and help continue this dialogue on the appropriateness of scientists exercising advocacy.

Policymakers are tasked with making decisions that determine how species and natural resources are managed, and subsequently affect and impact society. Scientists commonly play an integral role in these policy decisions, by providing policymakers with reliable and accurate information so they can make better-informed decisions. Examples include using stock assessments to set fishing limits, incorporating the regeneration capacity of forests into the timing of timber harvest, or considering the distribution of blue whales in permitting seafloor mining projects. Importantly, informing policy with science is very different from scientists advocating on policy issues. To understand these nuances, we must first define these terms.

A scientist considering engaging in policy advocacy. Source: Karen Brey.

According to Merriam-Webster, informing means “to communicate knowledge to” or “to give information to an authority”. In contrast, advocating means “to support or argue for (a cause, policy, etc.)” (Merriam-Webster 2019). People can inform others by providing information without necessarily advocating for a cause or policy. For many researchers, providing credible science to inform policy decisions is the gold standard. We, as a society, do not take issue with researchers supplying policymakers with reliable information. Rather, pushback arises when researchers step out of their role as informants and attempt to influence or sway policymakers to decide in a particular manner by speaking to values. This is advocacy.

Dr. Robert Lackey is a fisheries & political scientist, and one of the prominent voices on this issue. In his popular 2007 article, he explains that when scientists inform policy while also advocating, a conflict of interest is created (Lackey 2007). To an outsider, it can be difficult to distinguish values from scientific evidence when researchers engage in policy discussions. Are they engaging in these discussions to provide reliable information as an honest scientist, or are they advocating for decisions or policies based on their personal preferences? As a scientist, I like to believe most scientists – in natural resource management and conservation – do not engage in policy decisions for their own benefit, and they truly want to see our resources managed in a responsible and sustainable manner. Yet, I also recognize this belief doesn’t negate the fact that when researchers engage in policy discussions, they could advocate for their personal preferences – whether they do so consciously or subconsciously – which makes identifying these conflicts of interest particularly challenging.

Examples of actions scientists take in conducting and reporting research. Actions on the left represent actions of policy advocacy, those on the right do not, and the center is maybe. This graphic was adapted from a policy advocacy graphic from Scott et al. 2007. Source: Jamie Keyes.

It seems much of the unease with researchers exercising advocacy has to do with a lack in transparency about which role the researcher chooses to play during those policy debates. A simple remedy to this dilemma – as Lackey suggested in his paper – could be to encourage scientists to be completely transparent when they are about to inform versus advocate (Lackey 2007). Yet, for this suggestion to work, it would require complete trust in scientists to (1) verbalize and make known whether they’re informing or advocating, and (2) when they are informing, to provide credible and unbiased information. I’ve only witnessed a few scientists do this without ensuing some skepticism, which unfortunately highlights issues around an emerging mistrust of researchers to provide policy-neutral science. This mistrust threatens the important role scientists have played in policy decisions and the relationships between scientists and policymakers.

While much of this discussion has been focused on how researchers and their science are received by policymakers, researchers engaging in advocacy are also concerned with how they are perceived by their peers within the scientific community. When I ask more-senior researchers about their concerns with engaging in advocacy, losing scientific credibility is typically at or near the top of their lists. Many of them fear that once you start advocating for a position or policy decision (e.g. protected areas, carbon emission reduction, etc.), you become known for that one cause, which opens you up to questions and suspicions on your ability to provide unbiased and objective science. Once your credibility as a scientist comes into question, it could hinder your career.

How it sometimes feels when researchers conduct policy-relevant science. Source: Justin DeFreitas.

Conservation scientists are faced with a unique dilemma. They value both biodiversity conservation and scientific credibility. Yet, in some cases, risk or potential harm to a species or ecosystem may outweigh concerns over damage to their credibility, and therefore, may choose to engage in advocacy to protect that species or ecosystem (Horton 2015). Horton’s explanation raises an important point that researchers taking a hands-off approach to advocacy may not always be warranted, and that a researcher’s decision to engage in advocacy will heavily depend on the issue at hand and the repercussions if the researcher does not advocate their policy preferences. Climate change is a great example, where climate scientists are advocating for the use of their science, recognizing the alternative could mean continued inaction on carbon emission reduction and mitigation. [Note: this is called science advocacy, which is slightly different than advocating personal preferences, but this example helps demonstrate my point.]

To revisit the question – should scientists engage in advocacy? Honestly, I don’t have a clear answer, because there is no clear answer. This topic is one that has so many dimensions beyond the few I mentioned in this blog post. In my opinion, I don’t think researchers should have an always yes or always no stance on advocacy. Nor do I think every researcher needs to agree on this topic. A researcher’s decision to engage in advocacy will all depend on context. When faced with this decision, it might be useful to ask yourself the following questions: (1) How much do policymakers trust me? (2) How will my peers perceive me if I choose to engage? (3) Could I lose scientific credibility if I do engage? And (4) What’s at stake if I don’t make my preferences known? Hopefully, the answers to these sub-questions will help you decide whether you should advocate.

References:

Horton, C. C., Peterson, T. R., Banerjee, P., and M. J. Peterson. 2015. Credibility and advocacy in conservation science. Conservation Biology. 30(1): 23-32.

Lackey, R. T. 2007. Science, Scientists, and Policy Advocacy. Conservation Biology. 21(1): 12-17.

Scott et al. (2007). Policy advocacy in science: prevalence, perspectives, and implications for conservation biologists. Conservation Biology. 21(1): 29-35.

Merriam-Webster. 2019. Retrieved from < https://www.merriam-webster.com/ >