1PhD student, Oregon State University College of Earth, Ocean, and Atmospheric Sciences and Department of Fisheries and Wildlife, Geospatial Ecology of Marine Megafauna Lab
“Hurry up and wait.” A familiar phrase to anyone who has conducted field research. A flurry of preparations, followed by a waiting game—waiting for the weather, waiting for the right conditions, waiting for unforeseen hiccups to be resolved. We do our best to minimize unknowns and unexpected challenges, but there is always uncertainty associated with any endeavor to collect data at sea. We cannot control the whims of the ocean; only respond as best we can.
On 15 February 2021, we were scheduled to board the NOAA Ship Bell M. Shimada as marine mammal observers for the Northern California Current (NCC) ecosystem survey, a recurring research cruise that takes place several times each year. The GEMM Lab has participated in this multidisciplinary data collection effort since 2018, and we are amassing a rich dataset of marine mammal distribution in the region that is incorporated into the OPAL project. February is the middle of wintertime in the North Pacific, making survey conditions challenging. For an illustration of this, look no further than at the distribution of sightings made during the February 2018 cruise (Fig. 1), when rough sea conditions meant only a few whales were spotted.
Figure 1. (A) Map of marine mammal survey effort (gray tracklines) and baleen whale sightings recorded onboard the NOAA ship R/V Shimada during each of the NCC research cruises to-date and (B) number of individuals sighted per cruise since 2018. Note the amount of survey effort conducted in February 2018 (top left panel) compared to the very low number of whales sighted. Data summary and figures courtesy of Solene Derville.
Now, this is February 2021and the world is still in the midst of navigating the global coronavirus pandemic that has affected every aspect of our lives. The September 2020 NCC cruise was the first NOAA fisheries cruise to set sail since the pandemic began, and all scientists and crew followed a strict shelter-in-place protocol among other COVID risk mitigation measures. Similarly, we sheltered in place in preparation for the February 2021 cruise. But here’s where the weather comes in yet again. Not only did we have to worry about winter weather at sea, but the inclement conditions across the country meant our COVID tests were delayed in transit—and we could not board the ship until everyone tested negative. By the time our results were in, the marine forecast was foreboding, and the Captain determined that the weather window for our planned return to port had closed.
So, we are still on shore. The ship never left the dock, and NCC February 2021 will go on the record as “NAs” rather than sightings of marine mammal presence or absence. So it goes. We can dedicate all our energy to studying the ocean and these spectacularly dynamic systems, but we cannot control them. It is an important and humbling reminder. But as we have continued to learn over the past year, there are always silver linings to be found.
Even though we never made it to the ship, it turns out there’s a lot you can get done onshore. Dawn has sailed on several NCC cruises before, and one of the goals this time was to train Rachel for her first stint at marine mammal survey work. This began at Dawn’s house in Newport, where we sheltered in place together for the week prior to our departure date.
We walked through the iPad program we use to enter data, looked through field guides, and talked over how to respond in different scenarios we might encounter while surveying for marine mammals at sea. We also joined Solene, a postdoc working on the OPAL project, for a Zoom meeting to edit the distance sampling protocol document. It was great training to discuss the finer points of data collection together, with respect to how that data will ultimately be worked into our species distribution models.
The February NCC cruise is famously rough, and a tough time to sight whales (Fig. 1). This low sighting rate arises from a combination of factors: baleen whales typically spend the winter months on their breeding grounds in lower latitudes so their density in Oregon waters is lower, and the notorious winter sea state makes sighting conditions difficult. Solene signed off our Zoom call with, “Go collect that high-quality absence data, girls!” It was a good reminder that not seeing whales is just as important scientifically as seeing them—though sometimes, of course, it’s not possible to even get out where you can’t see them. Furthermore, all absence data is not created equal. The quality of the absence data we can collect deteriorates along with the weather conditions. When we ultimately use these survey data to fuel species distribution models, it’s important to account for our confidence in the periods with no whale sightings.
In addition to the training we were able to conduct on land, the biggest silver lining came just from sheltering in place together. We had only met over Zoom previously, and spending this time together gave us the opportunity to get to know each other in real life and become friends. The week involved a lot of fabulous cooking, rainy walks, and an ungodly number of peanut butter cups. Even though the cruise couldn’t happen, it was such a rich week. The NCC cruises take place several times each year, and the next one is scheduled for May 2021. We’ll keep our fingers crossed for fair winds and negative COVID tests in May!
Figure 2. Dawn’s dog Quin was a great shelter in place buddy. She was not sad that the cruise was canceled.
As a GEMM lab post-doc working on the OPAL project, my main goal for 2021 will be to produce accurate predictive models of baleen whale distribution off the Oregon coast to reduce entanglement risk. For the past months, I have been compiling, cleaning, and processing about two years of data collected by Leigh Torres and Craig Hayslip during monthly repeat surveys conducted onboard United States Coast Guard (USCG) helicopters. These standardized surveys record where and when whales are observed off the Oregon coast. These presence and absence data may now be modeled in relation to habitat, while accounting for effort and detection (as several parameters, such as weather and sea state, can affect the capacity of observers to detect whales at the surface). Considering that several baleen whale species (namely, humpback, fin, blue and gray whales) are known to feed in the area, prey availability is expected to be a major driver of their distribution.
As prey distribution data are frequently the lacking component in the habitat model equation, whale ecologists often resort to using environmental proxies. Variables such as topography (e.g., the depth or slope of the seafloor), water physical and chemical characteristics (e.g., temperature, salinity, oxygen concentration) or ocean circulation (e.g., currents, turbulence) have proved to be good predictors for fish or krill distribution, and in turn potential predictors for whale suitable habitats. In my search for such environmental variables to be tested in our future OPAL models, I have been focusing my research on a fascinating ocean feature: sea height.
Sea height varies both temporally and spatially under the influence of multiple factors, from internal mass of the solid Earth to the orbital revolution of the moon. After reading this blog you will realize that the flatness of the horizon at sea is a deceiving perspective (Figure 1) …
Figure 1: Flat? Really? (source: Pixabay)
Gravity and the geoid
We all know of Newton’s s discovery of gravity: the attraction force exerted by any object with a given mass on its surroundings. Yet, it is puzzling to think that the rate of acceleration of the apple falling on Newton’s head would have been different if Newton had been anywhere else on Earth.
Why is that and what does it have to do with sea height? On Earth, the standard gravity g is set at 9.80665 m/s2. This constant is called a “standard” because in fact, gravity varies at the surface of our planet, even if estimated at a fixed altitude. Indeed, as gravity is caused by mass, any change in relief or rock composition results in a change in gravity. For instance, magmatic activity in the upper mantle of the Earth and the crust causes a change in rock density and results in a change in gravity measured at the surface.
Gravity therefore is the first reason why the ocean surface is not flat. Gravity shapes an irregular surface called the “geoid”. This hypothetical ocean surface has equal gravitational potential anywhere on Earth and differs from the ellipsoid of reference by as much as 100 m! So to the question whether Earth is round or flat, I would say it is potato shaped (Figure 2)!
Figure 2: Exaggerated view of the gravitational potential of Earth. View a video animation here. (credit: European Space Agency)
The geoid is an essential reference for understanding ocean currents and monitoring changes in sea-level. Hypothetically, if ocean water had equal density everywhere and at any depth, the sea surface should match with the geoid… but that’s not the case. Let’s see why.
Ocean dynamic topography
Not unlike the hills and valleys covering landscapes, the ocean surface also has its highs and lows. Except that in the ocean, the surface topography is ever changing. Sea surface height (SSH) measures the average height difference between the observed sea level and the ellipsoid of reference (Figure 3). SSH is mostly affected by ocean circulation and may vary by as much as ±1 m. Indeed, just like the rocks inside the Earth, the water in the ocean varies in density. The vertical and horizontal physical structuring of the ocean was extensively discussed by Dawn last November while she was preparing for her PhD Qualifying Exams. Temperature clearly is at the core of the processes. As thermal expansion increases the space between warming water particles, the volume of a given amount of liquid water increases with increasing temperature. Warmer waters therefore take up “more space” than cooler waters, resulting in an elevated SSH.
Figure 3: Overview of the different fields used in altimetry (credit: CLS, https://duacs.cls.fr/)
SSH may therefore be used as an indicator of oceanographic phenomena such as upwellings, where warm surface waters are replaced by deep, cooler, and nutrient-rich waters moving upwards. The California Current that moves southwards along the North American coast is known as one of the world’s major currents affiliated with strong upwelling zones, which often triggers increased biological productivity. Several studies conducted in the California Current system have found a link between the variations in SSH and whale abundance or foraging activity (Abrahms et al. 2019; Pardo et al. 2015; Becker et al. 2016; Hazen et al. 2016).
SSH is measured by altimeter satellites and is made freely available by the European Space Agency and the US National Aeronautics and Space Administration. Lucky me! Numerous variables are derived from SSH, as shown in Figure 3. Among other things, I was able to download the daily maps of Sea Surface Height Anomaly (SSHa, also referred to as Sea Level Anomaly: SLA) over the Oregon coast from February 2019 to December 2020. SSHa is the difference between observed SSH at a specific time and place from the mean SSH field of reference calculated over a long period of time. Negative values of SSHa potentially suggest upwellings of cooler waters that could be associated with higher prey availability. Figure 4 shows an example of environmental data mining as I try to match SSHa with whale observations made during OPAL surveys. Figure 4B suggests increased whale occurrence where/when SSHa is lower.
Figure 4: Preliminary exploration of the relationship between sea surface height anomaly (SSHa) and baleen whales (blue, fin, humpback, unidentified) observed during OPAL surveys off Oregon, USA, between February 2019 and December 2020. A) Example covering 3 months of survey during summer 2019. Sightings were grouped over 5-km segments of surveyed trackline and segments with at least one sighting were mapped with colored circles. Dotted grey lines are the repeated survey tracklines for each of the labeled study areas (NB = North Bend). Sightings are symbolized by area (color) and group size (circle size). Monthly averages of SSHa are represented with a colored gradient. B) Monthly averages of SSHa measured over 5-km segments where whales were detected (presence) or not (absence).
Although encouraging, these preliminary insights are just the tip of the modeling iceberg. Many more testing and modeling steps will be required to determine confounding factors and relevant spatio-temporal scales at which these oceanographic variables may be influencing whale distribution off the Oregon coast. I am only at the start of a long road…
References
Abrahms, Briana, Heather Welch, Stephanie Brodie, Michael G. Jacox, Elizabeth A. Becker, Steven J. Bograd, Ladd M. Irvine, Daniel M. Palacios, Bruce R. Mate, and Elliott L. Hazen. 2019. “Dynamic Ensemble Models to Predict Distributions and Anthropogenic Risk Exposure for Highly Mobile Species.” Diversity and Distributions, no. December 2018: 1–12. https://doi.org/10.1111/ddi.12940.
Becker, Elizabeth, Karin Forney, Paul Fiedler, Jay Barlow, Susan Chivers, Christopher Edwards, Andrew Moore, and Jessica Redfern. 2016. “Moving Towards Dynamic Ocean Management: How Well Do Modeled Ocean Products Predict Species Distributions?” Remote Sensing 8 (2): 149. https://doi.org/10.3390/rs8020149.
Hazen, Elliott L, Daniel M Palacios, Karin A Forney, Evan A Howell, Elizabeth Becker, Aimee L Hoover, Ladd Irvine, et al. 2016. “WhaleWatch : A Dynamic Management Tool for Predicting Blue Whale Density in the California Current.” Journal of Applied Ecology 54 (5): 1415–28. https://doi.org/10.1111/1365-2664.12820.
Pardo, Mario A., Tim Gerrodette, Emilio Beier, Diane Gendron, Karin A. Forney, Susan J. Chivers, Jay Barlow, and Daniel M. Palacios. 2015. “Inferring Cetacean Population Densities from the Absolute Dynamic Topography of the Ocean in a Hierarchical Bayesian Framework.” PLOS One 10 (3): 1–23. https://doi.org/10.1371/journal.pone.0120727.
By Grace Hancock, Undergraduate Student at Kalamazoo College MI, GEMM Lab Intern (June 2020 to present)
It feels safe to say that everyone’s plans for the summer of 2020 went through a roller coaster of changes due to the pandemic. Instead of the summer research or travel plans that many undergraduate students, including myself, expected, many of us found ourselves at home, quarantining, and unsure of what to do with our time. Although it was unexpected, all that extra time brought me serendipitously to the virtual doorstep of the GEMM Lab. A few zoom calls and many, many emails later I am now lucky to be a part of the New Zealand Blue Whale photo-ID team. Under Leigh’s and Dawn’s guidance, I picked up the photo identification project where they had left it and am helping to advance this project to its next stage.
The skin of a blue whale is covered by distinct markings similar to a unique fingerprint. Thus, these whales can have a variety of markings that we use to identify them, including mottled pigmentation, pock marks (often caused by cookie cutter sharks), blisters, and even holes in the dorsal fins and flukes.
Figure 1. Examples of skin conditions that help in matching demonstrated on a photo of NZBW052 on the 10/9/2015
True blue blog fans may remember that in 2016 Dawn began the very difficult work of creating a photo ID catalog of all the blue whales that the GEMM Lab had encountered during field work in the South Taranaki Bight in New Zealand. Since that post, the catalog has grown and become an incredibly useful tool. When I came to the lab, I received a hard drive containing all the work Dawn had done to-date with the catalog, as well as two years of photos from various whale watching trips in the Hauraki Gulf of New Zealand. The goal of my internship was to integrate these photos into the GEMM catalog Dawn had created and, hopefully, identify some matches of whales between the two datasets. If there were any matches – and if I found no matches – we would gain information about whale movement patterns and abundance in New Zealand waters.
Before we could dive into this exciting matching work, there was lots of data organization to be done. Most of the photos I analyzed were provided by the Auckland Whale and Dolphin Safari (AWADS), an eco-tourism company that does regular whale watching trips in the Hauraki Gulf, off the North Island of New Zealand. The photos I worked with were taken by people with no connection to the lab and, because of this, were often filled with pictures of seals, birds, and whatever else caught the whale watcher’s eye. This dataset led to hours of sorting, renaming, and removing photos. Next, I evaluated each photo of a whale to determine photo-quality (focus, angle to the camera, lighting) and then I used the high-quality photos where markings are visible to begin the actual matching of the whales.
Figure 2. The fluke of NZBW013 taken on 2/2/2016 with examples of unique nicks and markings that could be used to match
Blue whales are inarguably massive organisms. For this reason, it can be hard to know what part of the whale you’re looking at. To match the photos to the catalog, I found the clearest pictures that included the whale’s dorsal fin. For each whale I tried to find a photo from the left side, the right side, and (if possible) an image of its fluke. I could then compare these photos to the ones organized in the catalog developed by Dawn.
The results from my matching work are not complete yet, but there are a few interesting tidbits that I can share with our readers today. From the photos submitted by AWADS, I was able to identify twenty-two unique individual whales. We are in the process of matching these whales to the catalog and, once this is done, we will know how many of these twenty-two are whales we have seen before and how many are new individuals. One of the most exciting matches I made so far is of a whale known in our catalog as individual NZBW072. Part of what made this whale so exciting was the fact that it is the calf of NZBW031 who was spotted eight times from 2010-2017, in the Hauraki Gulf, off Kaikoura, and in the South Taranaki Bight. As it turns out, NZBW072 took after her mother and has been spotted a shocking nine times from 2010 to 2019, all in the Hauraki Gulf region. Many of the whales in our catalog have only been spotted once, so encountering two whales with this kind of sighting track record that also happen to be related is like hitting the jackpot.
Figure 3. NZBW072 photographed on 11/8/2010 (top photo taken by Rochelle Constantine in the Hauraki Gulf) and on 10/3/2019 (bottom photo taken by the Auckland Whale and Dolphin Safari) with marks circled in red or yellow to highlight the matched features.
Once I finish comparing and matching the rest of these photos, the catalog will be substantially more up-to-date. But that is not where the work stops. More photos of blue whales in New Zealand are frequently being captured, either by whale watchers in the Hauraki Gulf, fellow researchers on the water, keen workers on oil and gas rigs, or the GEMM Lab. Furthermore, the GEMM Lab contributes these catalog photos to the International Whaling Commission (IWC) Southern Hemisphere Blue Whale Catalog, which compiles all photos of blue whales in the Southern Ocean and enables interesting and critical conservation questions to be addressed, like “How many blue whales are there in the Southern Ocean?” Once I complete the matching of these 22 individuals, I will upload and submit them to this IWC collaborative database on behalf of the GEMM Lab. This contribution will expand the global knowledge of these whales and motivates me to continue this important photo ID work. I am so excited to be a part of this effort, through which I have learned important skills like the basics of science communication (through writing this blog post) and attention to detail (from working very closely with the photos I was matching). I know both of these skills, and everything else I have learned from this process, will help me greatly as I begin my career in the next few years. I can tell big things will come from this catalog and I will forever be grateful for the chance I have had to contribute to it.
At this year’s virtual State of the Coast conference, I enjoyed tuning into a range of great talks, including one by Zach Penney from the Columbia River Inter-Tribal Fish Commission. In his presentation, “More Than a Tradition: Treaty rights and the Columbia River Inter-Tribal Fish Commission,” Penney described a tribal “covenant with resources,” and noted the success of this approach — “You don’t live in a place for 15,000 years by messing it up.”
Indigenous management of resources in the Pacific Northwest dates back thousands of years. From oak savannahs to fisheries to fires, local tribes managed diverse natural systems long before colonial settlement of the area that is now Oregon. We know comparatively little, however, about how Indigenous groups in Oregon interacted with whale populations before the changes brought by colonialism and commercial whaling.
I’m curious about how this missing knowledge could inform our understanding of the coastal Oregon ecosystems in which many GEMM Lab projects take place. My graduate research will be part of the effort to identify co-occurrence between whales and fishing in Oregon, with the goal of helping to reduce whale entanglement risk. Penney’s talk, ongoing conversations about decolonizing science, and my own concerns about becoming the scientist that I want to be, have all led me to ask a new set of questions: What did humans know in the past about whale distributions along the Oregon coast? What lost knowledge can be reclaimed from history?
As I started reading about historical Indigenous whale use in Oregon, I was struck by how little we know today, and how this learning process became a multidisciplinary treasure hunt. Clues as to how Indigenous groups interacted with whales along the Oregon coast lie in oral histories, myths, journals, and archaeological artifacts.
Much of what I read hinged on the question: did Indigenous tribes in Oregon historically hunt whales? Many signs point to yes, but it’s a surprisingly tricky question to answer conclusively. Marine systems and animals, including seals and whales, remain an important part of cultures in the Pacific Northwest today – but historically, documentation of hunting whales in Oregon has been limited. Whale bones have been found in coastal middens, and written accounts describe opportunistic harvests of beached whales. However, people have long believed that only a few North American tribes outside of the Arctic regularly hunted whales.
But in 2007, archaeologists Robert Losey and Dongya Yang found an artifact that started to shift this narrative. While studying a collection of tools housed at the Smithsonian Institution, they discovered the tip of a harpoon lodged in a whale flipper bone. This artifact came from the Partee site, which was inhabited around AD 300-1150 and is located near present-day Seaside, Oregon.
A gray whale ulna with cut marks found at the Partee site (Wellman, et al. 2017).
Through DNA testing, Losey and Yang determined that the harpoon was made of elk bone, and that the elk was not only harvested locally, but also used locally. This new piece of evidence suggested that whaling did in fact take place at the Partee site, likely by the Tillamook or Clatsop tribes that utilized this area.
Several years later, this discovery inspired Smithsonian Museum of Natural History archaeologist Torben Rick and University of Oregon PhD student Hannah Wellman to comb through the rest of the animal remains in the Smithsonian’s collection from northwest Oregon. Rick and Wellman scrutinized 187 whale bones for signs of hunting or processing, and found that about a quarter of the marks they inspected could have come from either hunting or the opportunistic harvest of stranded whales. They examined tools from the midden as well, and found that they were more suited to hunting animals, like seals and sea lions, or fishing.
However, Wellman and Rick also used DNA testing to identify which whale species were represented in the midden – and the DNA analyses suggested a different story. Genetic results revealed that the majority of whale bones in the midden came from gray whales, a third from humpback whales, and a few from orca and minke. Modern gray whale stranding events are not uncommon, and so it follows logically that these bones could have simply come from people harvesting beached whales. However, humpback strandings are rare – suggesting that such a large proportion of humpback bones in the midden is likely evidence of people actively hunting humpback whales.
Percentage of whale species identified at the Partee site and percentage of species in the modern stranding record for the Oregon Coast (Wellman, et al. 2017).
These results shed new light on whale harvesting practices at the Partee Site, and, like so much research, they suggest a new set of questions. What does the fact that there were orca, minke, gray, and humpback whales off the Oregon coast 900 years ago tell us about the history of this ecosystem? Could artifacts that have not yet been found provide more conclusive evidence of hunting? What would it mean if these artifacts are found one day, or if they are never found?
As this fascinating research continues, I hope that new discoveries will continue to deepen our understanding of historic Indigenous whaling practices in Oregon – and that this information can find a place in contemporary conversations. Indigenous whaling rights are both a contemporary and contentious issue in the Pacific Northwest, and the way that humans learn about the past has much to do with how we shape the present.
What we learn about the past can also change how we understand this ecosystem today, and provide new context as we try to understand the impacts of climate change on whale populations in Oregon. I’m interested in how learning more about historical Indigenous whaling practices could provide more information about whale population baselines, ideas for management strategies, and a new lens on the importance of whales in the Pacific Northwest. Even if we can’t fully reclaim lost knowledge from history, maybe we can still read enough clues to help us see both the past and present more fully.
Sources:
Braun, Ashley. “New Research Offers a Wider View on Indigenous North American Whaling.” Hakai Magazine, November 2016, www.hakaimagazine.com/news/new-research-offers-wider-view-indigenous-north-american-whaling/.
Eligon, John. “A Native Tribe Wants to Resume Whaling. Whale Defenders Are Divided.” New York Times, November 2019.
Hannah P. Wellman, Torben C. Rick, Antonia T. Rodrigues & Dongya Y. Yang (2017) Evaluating Ancient Whale Exploitation on the Northern Oregon Coast Through Ancient DNA and Zooarchaeological Analysis, The Journal of Island and Coastal Archaeology, 12:2, 255-275, DOI: 10.1080/15564894.2016.1172382
Losey, R., & Yang, D. (2007). Opportunistic Whale Hunting on the Southern Northwest Coast: Ancient DNA, Artifact, and Ethnographic Evidence. American Antiquity, 72(4), 657-676. doi:10.2307/25470439
Sanchez, Gabriel (2014). Conference paper: Cetacean Hunting at the Par-Tee site (35CLT20)?: Ethnographic, Artifact and Blood Residue Analysis Investigation.
Clara Bird, PhD Student, OSU Department of Fisheries and Wildlife, Geospatial Ecology of Marine Megafauna Lab
Based on my undergrad experience I assumed that most teaching in grad school would be as a teaching assistant, and this would consist of teaching labs, grading, leading office hours, etc. However, now that I’m in graduate school, I realize that there are many different forms of teaching as a graduate student. This summer I worked as an instructor for an e-campus course, which mainly involved grading and mentoring students as they developed their own projects. Yet, this past week I was a guest teacher for Physiology and Behavior of Marine Megafauna, which was a bit more involved.
I taught a whale photogrammetry lab that I originally developed as a workshop with a friend and former lab mate, KC Bierlich, at the Duke University Marine Robotics and Remote Sensing (MaRRS) lab when I worked there. Similar to Leila’s work, we were using photogrammetry to measure whales and assess their body condition. Measuring a whale is a deceivingly simple task that gets complicated when taking into account all the sources of error that might affect measurement accuracy. It is important to understand the different sources of error so that we are sure that our results are due to actual differences between whales instead of differences in errors.
Error can come from distortion due to the camera lens, inaccurate altitude measurements from the altimeter, the whale being arched, or from the measurement process. When we draw a line on the image to make a measurement (Image 1), measurement process errors come from the line being drawn incorrectly. This potential human error can effect results, especially if the measurer is inexperienced or rushing. The quality of the image also has an effect here. If there is glare, wake, blow or refraction covering or distorting the measurer’s view of the full body of the whale then the measurer has to estimate where to begin and end the line. This estimation is subjective and, therefore, a source of error. We used the workshop as an opportunity to study these measurement process errors because we could provide a dataset including images of varying qualities and collect data from different measurers.
This workshop started as a one-day lecture and lab that we designed for the summer drone course at the Duke Marine Lab. The idea was to simultaneously teach the students about photogrammetry and the methods we use, while also using all the students’ measurements to study the effect of human error and image quality on measurement accuracy. Given this one-day format, we ambitiously decided to teach and measure in the morning, compile and analyze the students’ measurements over lunch, and then present the results of our error analysis in the afternoon. To accomplish this, we prepared as much as we could and set up all the code for the analysis ahead of time. This preparation meant several days of non-stop working, discussing, and testing, all to anticipate any issues that might come up on the day of the class. We used the measuring software MorphoMetriX (Torres & Bierlich, 2020) that was developed by KC and a fellow Duke Marine Lab grad student Walter Torres. MorphoMetriX was brand new at the time, and this newness of the software meant that we didn’t yet know all the issues that might come up and we did not have time to troubleshoot. We knew this meant that helping the students install the software might be a bit tricky and sure enough, all I remember from the beginning of that first lab is running around the room helping multiple people troubleshoot at the same time, using use all the programming knowledge I had to discover new solutions on the fly.
While troubleshooting on the fly can be stressful and overwhelming, I’ve come to appreciate it as good practice. Not only did we learn how to develop and teach a workshop, we also used what we had learned from all the troubleshooting to improve the software. I also used the code we developed for the analysis as the starting blocks for a software package I then wrote, CollatriX (Bird & Bierlich, 2020), as a follow up software to MorphoMetriX. Aside from the initial troubleshooting stress, the workshop was a success, and we were excited to have a dataset to study measurement process errors. Given that we already had all the materials for the workshop prepared, we decided to run a few more workshops to collect more data.
That brings me to my time at here at OSU. I left the Duke MaRRS lab to start graduate school shortly after we taught the workshop. Interested in running the workshop here, I reached out to a few different people. I first ran the workshop here as an event organized by the undergraduate club Ocean11 (Image 2). It was fun running the workshop a second time, as I used what I learned from the first round; I felt more confident, and I knew what the common issues would likely be and how to solve them. Sure enough, while there were still some troubleshooting issues, the process was smoother and I enjoyed teaching, getting to know OSU undergraduate students, and collecting more data for the project.
Image 2. Ocean11 students measuring during the workshop (Feb 7, 2020). Image credit: Clara Bird
The next opportunity to run the lab came through Renee Albertson’s physiology and behavior of marine megafauna class, but during the COVID era this class had other challenges. While it’s easier to teach in person, this workshop was well suited to be converted to a remote activity because it only requires a computer, the data can be easily sent to the students, and screen sharing is an effective way to demonstrate how to measure. So, this photogrammetry module was a good fit for the marine megafauna class this term that has been fully remote due to COVID-19. My first challenge was converting the workshop into a lab assignment with learning outcomes and analysis questions. The process also involved writing R code for the students to use and writing step-by-step instructions in a way that was clear and easy to understand. While stressful, I appreciated the process of developing the lab and these accompanying materials because, as you’ve probably heard from a teacher, a good test of your understanding of a concept is being able to teach it. I was also challenged to think of the best way to communicate and explain these concepts. I tried to think of a few different explanations, so that if a student did not understand it one way, I could offer an alternative that might work better. Similar to the preparation for the first workshop, I also prepared for troubleshooting the students’ issues with the software. However, unlike my previous experiences, this time I had to troubleshoot remotely.
After teaching this photogrammetry lab last week my respect for teachers who are teaching remotely has only increased. Helping students without being able to sit next to them and walk them through things on their computer is not easy. Not only that, in addition to the few virtual office hours I hosted, I was primarily troubleshooting over email, using screen shots from the students to try and figure out what was going on. It felt like the ultimate test of my programming knowledge and experience, having to draw from memories of past errors and solutions, and thinking of alternative solutions if the first one didn’t work. It was also an exercise in communication because programming can be daunting to many students; so, I worked to be encouraging and clearly communicate the instructions. All in all, I ended this week feeling exhausted but accomplished, proud of the students, and grateful for the reminder of how much you learn when you teach.
References
Bird, C. N., & Bierlich, K. (2020). CollatriX: A GUI to collate MorphoMetriX outputs. Journal of Open Source Software, 5(51), 2328. https://doi.org/10.21105/joss.02328
Torres, W., & Bierlich, K. (2020). MorphoMetriX: a photogrammetric measurement GUI for morphometric analysis of megafauna. Journal of Open Source Software, 5(45), 1825. https://doi.org/10.21105/joss.01825
Clara and I have just returned from ten fruitful days at sea aboard NOAA Ship Bell M. Shimada as part of the Northern California Current (NCC) ecosystem survey. We surveyed between Crescent City, California and La Push, Washington, collecting data on oceanography, phytoplankton, zooplankton, and marine mammals (Fig. 1). This year represents the third year I have participated in these NCC cruises, which I have come to cherish. I have become increasingly confident in my marine mammal observation and species identification skills, and I have become more accepting of the things out of my control – the weather, the sea state, the many sightings of “unidentified whale species”. Careful planning and preparation are critical, and yet out at sea we are ultimately at the whim of the powerful Pacific Ocean. Another aspect of the NCC cruises that I treasure is the time spent with members of the science team from other disciplines. The chatter about water column features, musings about plankton species composition, and discussions about what drives marine mammal distribution present lively learning opportunities throughout the cruise. Our concurrent data collection efforts and ongoing conversations allow us to piece together a comprehensive picture of this dynamic NCC ecosystem, and foster a collaborative research environment.
Figure 1. Data collection effort for the NCC September 2020 cruise, between Crescent City, CA, and La Push, WA. Red points represent oceanographic sampling stations, and black lines show the track of the research vessel during marine mammal survey effort.
Every time I head to sea, I am reminded of the patchy distribution of resources in the vast and dynamic marine environment. On this recent cruise we documented a stark contrast between expansive stretches of warm, blue, stratified, and seemingly empty ocean and areas that were plankton-rich and supported multi-species feeding frenzies that had marine mammal observers like me scrambling to keep track of everything. This year, we were greeted by dozens of blue and humpback whales in the productive waters off Newport, Oregon. Off Crescent City, California, the water was very warm, the plankton community was dominated by gelatinous species like pyrosomes, salps, and other jellies, and the marine mammals were virtually absent except for a few groups of common dolphins. To the north, the plume of water flowing from the Columbia River created a front between water masses, where we found ourselves in the midst of pacific white-sided dolphins, northern right whale dolphins, and humpback whales. These observations highlight the strength of ecosystem-scale and multi-disciplinary data collection efforts such as the NCC surveys. By drawing together information on physical oceanography, primary productivity, zooplankton community composition and abundance, and marine predator distribution, we can gain a nearly comprehensive picture of the dynamics within the NCC over a broad spatial scale.
Northern fur seal
Humpback whales
Common dolphins
Humpback whale breaching
Blue whale
Risso’s dolphins
Pacific white-sided dolphins
A few images of marine mammals of the NCC. Click a photo to explore gallery. All photos by Dawn Barlow.
This year, the marine mammals delivered and kept us observers busy. We lucked out with good survey conditions and observed many different species throughout the NCC (Table 1, Fig. 2).
Table 1. Summary of all marine mammal sightings from the NCC September 2020 cruise.
Figure 2. Maps showing kernel densities of four frequently observed and widely distributed species seen during the cruise. Black lines show the track of the research vessel during marine mammal survey effort, white points represent sighting locations, and colors show kernel density estimates weighted by group size at each sighting.
This year’s NCC cruise was unique. We went to sea as a global pandemic, wildfires, and political tensions continue to strain this country and our communities. This cruise was the first NOAA Fisheries cruise to set sail since the start of the pandemic. Our team of scientists and the ship’s crew went to great lengths to make it possible, including a seven-day shelter-in-place period and COVID-19 tests prior to cruise departure. As a result of these extra challenges and preparations, I think we were all especially grateful to be on the water, collecting data. At-sea fieldwork is always challenging, but morale was up, spirits were high, and laughs were frequent despite smiles being concealed by our masks. I am grateful for the opportunity to participate in this ongoing valuable data collection effort, and to be part of this team. Thanks to all who made it such a memorable cruise.
Figure 3. The NCC September 2020 science team at the end of a successful research cruise! Fieldwork in the time of COVID-19 presents many logistical challenges, but this team rose to the occasion and completed a safe and fruitful survey despite the circumstances.
By Alejandro Fernandez Ajo, PhD student at the Department of Biology, Northern Arizona University, Visiting scientist in the GEMM Lab working on the gray whale physiology and ecology project
Whales are among the most amazing and enigmatic animals in the world. Whales are not only fascinating, they are also biologically special. Due to their key ecological role and unique biological traits (i.e., their large body size, long lifespans, and sizable home ranges), whales are extremely important in helping sustain the entire marine ecosystem.
Working towards the conservation of marine megafauna, and large charismatic animals in general, is often seen as a mere benevolent effort that conservationist groups, individuals, and governments do on behalf of the individual species. However, mounting evidence demonstrates that restoring populations of marine megafauna, including large whales, can help buffer marine ecosystems from destabilizing stresses like human driven CO2 emissions and global change due to their ability to sequester carbon in their bodies (Pershing et al. 2010). Furthermore, whales can enhance primary production in the ocean through their high consumption and defecation rates, which ultimately provides nutrients to the ecosystem and improves fishery yields (Roman-McCarthy, 2010; Morissette et al. 2012).
Relationships between humans and whales have a long history, however, these relationships have changed. For centuries, whales were valued in terms of the number of oil barrels they could yield, and the quality of their baleen and meat. In the North Atlantic, whaling started as early as 1000 AD with “shore whaling” of North Atlantic right whales by Basque whalers. This whaling was initially limited to the mother and calve pairs that were easy to target due to their coastal habits and the fact that calves are more vulnerable and slower (Reeves-Smith, 2006). Once the calving populations of near-shore waters off Europe were depleted, offshore whaling began developing. Whalers of multiple nations (including USA, British, French, Norwegian, Portuguese, and Dutch, among others), targeted whales around the world, mainly impacting the gray whale populations, and all three right whale species along with the related bowhead whale. Later, throughout the phase of modern whaling using industrialized methods, the main target species consisted of the blue, fin, humpback, minke, sei and sperm whale (Schneider- Pearce, 2004).
By the early twentieth century, many of the world´s whale populations where reduced to a small fraction of their historical numbers, and although pre-whaling abundance of whale stocks is a subject of debate, recent studies estimate that at least the 66%, and perhaps as high as 90% for some whale species and populations (Branch-Williams 2006; Christensen, 2006), where taken during this period. This systematic and serial depletion of whale papulations reduced the biomass and abundance of great whales around the world, which has likely altered the structure and function of the oceans (Balance et al. 2006; Roman et al. 2014; Croll, et al. 2006).
After centuries of unregulated whale hunting, commercial whaling was banned in the mid-twentieth century. This ban was the result of multiple factors including reduced whale stocks below the point where commercial whaling would be profitable, and a fortunate shift in public perception of whales and the emergence of conservation initiatives (Schneider- Pearce, 2004). Since this moratorium on whaling, several whale populations have recovered around the world, and some populations that were listed as endangered have been delisted (i.e., the Eastern North Pacific gray whale) and some populations are estimated to have re-bounced to their pre-whaling abundance.
Although, the recovery of some populations has motivate some communities or nations to obtain or extend their whaling quotas (see Blog Post by Lisa Hildebrand), it is important to acknowledge that the management of whale populations is arguably one of the most complicated tasks, and is distinguished from management of normal fisheries due to various biological aspects. Whales are long living mammals with slow reproduction rates, and on average a whale can only produce a calf every two or three years. Hence, the gross addition to the stock rarely would exceed 25% of the number of adults (Schneider- Pearce, 2004), which is a much lower recovery rate that any fish stock. Also, whales usually reach their age of sexual maturity at 6-10 years old, and for many species there are several uncertainties about their biology and natural history that make estimations of population abundance and growth rate even harder to estimate.
Fig 1: Human relationship with whales has changed through history. Once valued for their meat and oil, now they are a natural attraction that amaze and attract crowds to whale watching destinations all over the globe. Photo: Stephen Johnson, Península Valdés-Argentina.
Moreover, while today´s whales are generally not killed directly by hunting, they are exposed to a variety of other increasing human stressors (e.g., entanglement in fishing gear, vessel strikes, shipping noise, and climate change). Thus, scientists must develop novel tools to overcome the challenges of studying whales and distinguish the relative importance of the different impacts to help guide conservation actions that improve the recovery and restoration of whale stocks (Hunt et al. in press). With the restoration of great whale populations, we can expect positive changes in the structure and function of the world’s oceans (Chami et al. 2019; Roman et al. 2010).
So, why it is worth keeping whales healthy?
Whales facilitate the transfer of nutrients by (1) releasing nutrient-rich fecal plumes near the surface after they have feed at depth and (2) by moving nutrients from highly productive, polar and subpolar latitude feeding areas to the low latitude calving areas (Roman et al. 2010). In this way, whales help increase the productivity of phytoplankton that in turn support zooplankton production, and thus have a bottom up effect on the productivity of many species including fish, birds, and marine mammals, including whales. These fertilization events can also facilitate mitigation of the negative impacts of climate change. The amount of iron contained in the whales’ feces can be 10 million times greater than the level of iron in the marine environment, triggering important phytoplankton blooms, which in turn sequester thousands of tons of carbon from, and release oxygen to, the atmosphere annually (Roman et al. 2016; Smith et al. 2013; Willis, 2007). Furthermore, when whales die, their massive bodies fall to the seafloor, making them the largest and most nutritious source of food waste, which is capable of sustaining a succession of macro-fauna assemblages for several decades, including some invertebrate species that are endemic to whale carcasses (Smith et al. 2015).
Figure 2. The figure shows a conceptual model of the “whale pump”. From Roman-McCarthy, 2010.
Despite the several environmental services that whales provide, and the positive impact on local economies that depend on whale watching tourism, which has been valued in millions of dollars per year (Hoyt E., 2001), the return of whales and other marine mammals has often been implicated in declines in fish populations, resulting in conflicts with human fisheries (Lavigne, D.M. 2003). Yet there is insufficient direct evidence for such competition (Morissette et al. 2010). Indeed, there is evidence of the contrary: In ecosystem models where whale abundances are reduced, fish stocks show significant decreases, and in some cases the presence of whales in these models result in improved fishery yields. Consistent with these findings, several models have shown that alterations in marine ecosystems resulting from the removal of whales and other marine mammals do not lead to increases in human fishery yields (Morissette et al. 2010; 2012). Although the environmental services and benefits provided by great whales, which potentially includes the enhancement of fisheries yields, and enhancement on ocean oxygen production and capturing carbon, are evident and make a strong argument for improved whale conservation, it is overwhelming how little we know about many aspects of their lives, their biology, and particularly their physiology.
Figure 3: Whales are the most fascinating animals in the world, but they are not only amazing animals. They are also extremely important in sustaining the entire marine ecosystem. Photo: Alejandro Fernández Ajó -Instituto de Conservación de ballenas.
This lack of knowledge is because whales are really hard to study. For many years research was limited to the observation of the brief surfacing of the whales, yet most of their lives occurs beneath the surface and were completely unknown. Fortunately, new technologies and the creativity of whale researchers are helping us to better understand many aspects of their lives that were cryptic to us even a decade ago. I am committed to filling some of these knowledge gaps. My research examines how different environmental and anthropogenic impacts affect whale health, and particularly how these impacts may relate to cases of large whale mortalities and declines in whale populations. I am applying novel methods in conservation physiology for measuring hormone levels that promise to improve our understanding of the relationship between different (extrinsic and intrinsic) stressors and the physiological response of whales. Ultimately, this research will help address important conservation questions, such as the causes of unusual whale mortality events and declines in whale populations.
References:
Ballance LT, Pitman RL, Hewitt R, et al. 2006. The removal of large whales from the Southern Ocean: evidence for long-term ecosystem effects. In: Estes JA, DeMaster DP, Doak DF, et al. (Eds). Whales, whaling and ocean ecosystems. Berkeley, CA: University of California Press.
Branch TA and Williams TM. 2006. Legacy of industrial whaling. In: Estes JA, DeMaster DP, Doak DF, et al. (Eds). Whales, whaling and ocean ecosystems. Berkeley, CA: University of California Press.
Chami, R. Cosimano, T. Fullenkamp, C. & Oztosun, S. (2019). Nature’s solution to climate change. Finance & Development, 56(4).
Christensen LB. 2006. Marine mammal populations: reconstructing historical abundances at the global scale. Vancouver, Canada: University of British Columbia.
Croll DA, Kudela R, Tershy BR (2006) Ecosystem impact of the decline of large whales in the North Pacific. In: Estes JA, DeMaster DP, Doak DF, Williams TM, BrownellJr RL, editors. Whales, Whaling, and Ocean Ecosystems. Berkeley: University of California Press. pp. 202–214.
Hoyt, E. 2001. Whale Watching 2001: Worldwide Tourism Numbers, Expenditures and Expanding Socioeconomic Benefits
Hunt, K.E., Fernández Ajó, A. Lowe, C. Burgess, E.A. Buck, C.L. In press. A tale of two whales: putting physiological tools to work for North Atlantic and southern right whales. In: “Conservation Physiology: Integrating Physiology Into Animal Conservation And Management”, ch. 12. Eds. Madliger CL, Franklin CE, Love OP, Cooke SJ. Oxford University press: Oxford, UK.
Lavigne, D.M. 2003. Marine mammals and fisheries: the role of science in the culling debate. In: Gales N, Hindell M, and Kirkwood R (Eds). Marine mammals: fisheries, tourism, and management issues. Melbourne, Australia: CSIRO.
Morissette L, Christensen V, and Pauly D. 2012. Marine mammal impacts in exploited ecosystems: would large scale culling benefit fisheries? PLoS ONE 7: e43966.
Morissette L, Kaschner K, and Gerber LR. 2010. “Whales eat fish”? Demystifying the myth in the Caribbean marine ecosystem. Fish Fish 11: 388–404.
Pershing AJ, Christensen LB, Record NR, Sherwood GD, Stetson PB (2010) The impact of whaling on the ocean carbon cycle: Why bigger was better. PLoS ONE 5(8): e12444.
Reeves, R. and Smith, T. (2006). A taxonomy of world whaling. In DeMaster, D. P., Doak, D. F., Williams, T. M., and Brownell Jr., R. L., eds. Whales, Whaling, and Ocean Ecosystems. University of California Press, Berkeley, CA.
Roman, J. Altman I, Dunphy-Daly MM, et al. 2013. The Marine Mammal Protection Act at 40: status, recovery, and future of US marine mammals. Ann NY Acad Sci; doi:10.1111/nyas.12040.
Roman, J. and McCarthy, J.J. 2010. The whale pump: marine mammals enhance primary productivity in a coastal basin. PLoS ONE. 5(10): e13255.
Roman, J. Estes, J.A. Morissette, L. Smith, C. Costa, D. McCarthy, J. Nation, J.B. Nicol, S. Pershing, A.and Smetacek, V. 2014. Whales as marine ecosystem engineers. Frontiers in Ecology and the Environment. 12(7). 377-385.
Roman, J. Nevins, J. Altabet, M. Koopman, H. and McCarthy, J. 2016. Endangered right whales enhance primary productivity in the Bay of Fundy. PLoS ONE. 11(6): e0156553.
Schneider, V. Pearce, D. What saved the whales? An economic analysis of 20th century whaling. Biodiversity and Conservation 13, 543–562 (2004). https://doi org.libproxy.nau.edu/10.1023/B:BIOC.0000009489.08502.1
Smith LV, McMinn A, Martin A, et al. 2013. Preliminary investigation into the stimulation of phyto- plankton photophysiology and growth by whale faeces. J Exp Mar Biol Ecol 446: 1–9.
Smith, C.R. Glover, A.G. Treude, T. Higgs, N.D. and Amon, D.J. 2015. Whale-fall ecosystems: Recent insights into ecology, paleoecology, and evolution. Annu. Rev. Marine. Sci. 7:571-596.
Willis, J. 2007. Could whales have maintained a high abundance of krill? Evol Ecol Res 9: 651–662.
Dr. Leigh Torres PI, Geospatial Ecology of Marine Megafauna Lab, Marine Mammal Institute Assistant Professor, Oregon Sea Grant, Department of Fisheries and Wildlife, Oregon State University
I have played on sports teams all my life – since I was four until present day. Mostly soccer teams, but a fair bit of Ultimate too. Teams are an interesting beast. They can be frustrating when communication breaks down, irritating when everyone is not on the same timeline, and disastrous if individuals do not complete their designated job. Yet, without the whole team we would never win. So, on top of the fun of competition, skill development, and exercise, playing on teams has always been part of the challenging and fulfilling process for me: everyone working toward the same goal – to win – by making the team fluid, complimentary, integrated, and ultimately successful.
I have come to learn that it is the same with conservation science.
A few of my teams through the ages, as player and coach. Some of my favorite people are on these teams, from 1981 to 2018.
Conservation efforts are often so complex, that it is practically impossible to achieve success alone. Forces driving the need for conservation typically include monetary needs/desires, social values, ecological processes, animal physiology, multi-jurisdictional policies, and human behavior. Each one of these forces alone is challenging to understand and takes expertise to comprehend the situation. Hence, building a well-functioning team is essential. Here’s a recent example from the GEMM Lab:
Since 2014 entanglements of blue, humpback and gray whales in fishing gear along the west coast of the USA have dramatically increased, particularly in Dungeness crab fishing gear. Many forces likely led to this increase, including increased whale population abundance, potential shifts in whale distributions, and changes in fishing fleet dynamics. While we cannot point a finger at one cause, many people and groups recognize that we cannot continue to let whales become entangled and killed at such high rates: whale populations would decline, fisheries would look bad in the public eye and potentially lose profits, whales have an intrinsic right to live in the ocean without being bycaught, and whales are an important part of the ecosystem that would deteriorate without them. In 2017, the Oregon Whale Entanglement Working Group was formed to bring stakeholders together that were concerned about this problem to discuss possible solutions and paths forward. I was lucky to be a part of this group, which also included members of the Dungeness crab fishery and commission, the Oregon Department of Fish and Wildlife (ODFW), other marine mammal scientists, and representatives of the American Cetacean Society, The Nature Conservancy, and a local marine gear supplier.
We met regularly over 2.5 years, and despite some hesitation at first about walking into a room of potentially disgruntled fishermen (I would be lying if I did not admit to this), after the first meeting I looked forward to every gathering. I learned an immense amount about the Dungeness crab fishery and how it operates, how ODFW manages the fishery and why, and what people do, don’t and need to know about whales in Oregon. Everyone agreed that reducing whale entanglements is needed, and a frequent approach discussed was to reduce risk by not setting gear where and when we expect whales to be. Yet, this idea flagged a very critical knowledge gap: We do not have a good understanding of whale distribution patterns in Oregon. Thus leading to the development of a highly collaborative research effort to describe whale distribution patterns in Oregon and identify areas of co-occurrence between whales and fishing effort to reduce the risk of entanglements. Sounds great, but a tough task to accomplish in a few short years. So, let me introduce the great team I am working with to make it all happen.
While I may know a few things about whales and spatial ecology, I don’t know too much about fisheries in Oregon. My collaboration with folks at ODFW, particularly Kelly Corbett and Troy Buell, has enabled this project to develop and go forward, and ultimately will lead to success. These partners provide feedback about how and where the fishery operates so I know where and when to collect data, and importantly they will provide the information on fishing effort in Oregon waters to relate to our generated maps of whale distribution. This spatial comparison will produce what is needed by managers and fishermen to make informed and effective decisions about where to fish, and not to fish, so that we reduce whale entanglement risk while still harvesting successfully to ensure the health and sustainability of our coastal economies.
So, how can we collect standardized data on whale distribution in Oregon waters without breaking the bank? I tossed this question around for a long time, and then I looked up to the sky and wondered what that US Coast Guard (USCG) helicopter was flying around for all the time. I reached out to the USCG to enquire, and proposed that we have an observer fly in the helicopter with them along a set trackline during their training flights. Turns out the USCG Sector North BendandColumbia Riverwere eager to work with us and support our research. They have turned out to be truly excellent partners in this work. We had some kinks to work out at the beginning – lots of acronyms, protocols, and logistics for both sides to figure out – but everyone has been supportive and pleasant to work with. The pilots and crew are interested in our work and it is a joy to hear their questions and see them learn about the marine ecosystem. And our knowledge of helicopter navigation and USCG duties has grown astronomically.
On the left is a plot of the four tracklines we survey for whales each month for two years aboard a US Coast Guard helicopter. On the right are some photos of us in action with our Coast Guard partners.
Despite significant cost savings to the project through our partnership with the USCG, we still need funds to support time, gear and more. And full credit to the Oregon Dungeness Crab Commission for recognizing the value and need for this project to support their industry, and stepping up to fund the first year of this project. Without their trust and support the project may not have got off the ground. With this support in our back pocket and proof of our capability, ODFW and I teamed up to approach the National Oceanographic and Atmospheric and Administration (NOAA) for funds to support the remaining years of the project. We found success through the NOAA Fisheries Endangered Species Act Section 6 Program, and we are now working toward providing the information needed to protect endangered and threatened whales in Oregon waters.
Despite our cost-effective and solid approach to data collection on whale occurrence, we cannot be everywhere all the time looking for whales. So we have also teamed up with Amanda Gladics at Oregon Sea Grant to help us with an important outreach and citizen science component of the project. With Amanda we have developed brochures and videos to inform mariners of all kinds about the project, objectives, and need for them to play a part. We are encouraging everyone to use the Whale Alert app to record their opportunistic sightings of whales in Oregon waters. These data will help us build and test our predictive models of whale distribution. Through this partnership we continue important conversations with fishermen from many fisheries about their concerns, where they are seeing whales, and what needs to be done to solve this complex conservation challenge.
Of course I cannot collect, process, analyze, and interpret all this data on my own. I do not have the skills or capacity for that. My partner in the sky is Craig Hayslip, a Faculty Research Assistant in the Marine Mammal Institute. Craig has immense field experience collecting data on whales and is the primary observer on the survey flights. Together we have navigated the USCG world and developed methods to collect our data effectively and efficiently (all within a tiny space flying over the ocean). In a few months we will be ¾ of the way through our data collection phase, which means data analysis will take over. For this phase I am bringing back a GEMM Lab star, Solene Derville, who recently completed her PhD. As the post-doc on the project, Solene will take the lead on the species distribution modeling and fisheries overlap analysis. I am looking forward to partnering with Solene again to compile multiple data sources on whales and oceanography in Oregon to produce reliable and accurate predictions of whale occurrence and entanglement risk. Finally I want to acknowledge our great partners at the Cascadia Research Collective (Olympia, WA) and the Cetacean Conservation and Genomics Lab (OSU, Marine Mammal Institute) who help facilitate our data collection, and conduct the whale photo-identification or genetic analyses to determine population assignment.
As you can see, even this one, smallish, conservation research
project takes a diverse team of partners to proceed and ensure success. On this
team, my position is sometimes a player, coach, or manager, but I am always grateful
for these amazing collaborations and opportunities to learn. I am confident in
our success and will report back on our accomplishments as we wrap up this
important and exciting conservation science project.
A fin whale observed off the Oregon coast during one of our surveys aboard a US Coast Guard helicopter.
Clara Bird, Masters Student, OSU Department of Fisheries and Wildlife, Geospatial Ecology of Marine Megafauna Lab
Happy new year from the GEMM lab! Starting graduate school comes with a lot of learning. From skills, to learning about how much there is to learn, to learning about the system I will be studying in depth for the next few years. This last category has been the most exciting to me because digging into the literature on a system or a species always leads to the unearthing of some fascinating and surprising facts. So, for this blog I will write about one of the aspects of gray whale foraging that intrigues me most: benthic feeding and its impacts.
How do gray whales
feed?
Gray whales are a unique species. Unlike other baleen whales, such as humpback and blue whales, gray whales regularly feed off the bottom of the ocean (Nerini, 1984). They roll to one side and swim along the bottom, they then suction up (by depressing their tongue) the sediment and prey, then the sediment and water is filtered out of the baleen. In fact, we use sediment streams, shown in Figure 1, as an indicator of benthic feeding behavior when analyzing drone footage (Torres et al. 2018).
Figure 1. Screenshot of drone video showing sediment streaming from mouth of a whale after benthic feeding. Video taken under NOAA/NMFS permit #21678
Locations of benthic feeding can be identified without directly observing a gray whale actively feeding because of the excavated pits that result from benthic feeding (Nerini 1984). These pits can be detected using side-scan sonar that is commonly used to map the seafloor. Oliver and Slattery (1985) found that the pits typically are from 2-20 m2. In some of the imagery, consecutive neighboring pits are visible, likely created by one whale in series during a feeding event. Figure 2 shows different arrangements of pits.
Figure 2. Different arrangements of pits created by feeding whales (Nerini 1984).
Aside from how fascinating the behavior is, benthic feeding is also interesting because it has a large impact on the environment. Coming from a background of studying baleen whales that primarily feed on krill, I had not really considered the potential impacts of whale foraging other than removing prey from the environment. However, when gray whales feed, they excavate large areas of the benthic substrate that disturb and impact the habitat.
The impacts of benthic feeding
Weitkamp et al. (1992) conducted a study on gray whale benthic foraging on ghost shrimp in Puget Sound, WA, USA. This study, conducted over two years, focused on measuring the impact of benthic foraging by its effect on prey abundance. They found that the standing stock of ghost shrimp within a recently excavated pit was two to five times less than that outside the pit, and that 3100 to 5700 grams of shrimp can be removed per pit. From aerial surveys they estimated that within one season feeding gray whales created between 2700 and 3200 pits. Using these values, they calculated that 55 to 79% of the standing stock of ghost shrimp was removed each season by foraging gray whales. Interestingly, they found that the shrimp biomass within an excavated pit recovered within about two months.
Oliver and Slattery (1985) also
found a recovery period of about 2 months per pit in their study on the effect
of gray whale benthic feeding on the prey community in the Bering Sea. They
sampled prey within and outside feeding excavations, both actual whale pits and
man-made, to test the response of the benthic community to the disturbance of a
feeding event. They found that after the initial feeding disturbance, the
excavated area was rapidly colonized by scavenging lysianassid amphipods, which
are small (10 mm) crustaceans that typically eat dead organic material. These
amphipods rushed in and attacked the organisms that were injured or dislodged
by the whale feeding event, typically small crustaceans and polychaete worms.
Within hours of the whale feeding event, these amphipods had dispersed and a
different genre of scavenging lysianassid amphipods slowly invaded the
excavated pit further and stayed much longer. After a few days or weeks these
pits collected and trapped organic debris that attracted more colonists.
Indeed, they found that the number of colonists remained elevated within the
excavated areas for over two months.
Notably, these results on how the
disturbance of gray whale benthic feeding changes sediment composition support
the idea that this foraging behavior maintains the sand substrate and therefore
helps to maintain balanced levels of benthic dwelling amphipods, their primary
source of prey in this study area (Johnson and Nelson, 1984). Gray whales scour
the sea floor when they feed and this process leads to the resuspension of lots
of sediments and nutrients that would otherwise remain on the seafloor.
Therefore, while this feeding may seem like a violent disturbance, it may in
fact play a large role in benthic productivity (Johnson and Nelson, 1984;
Oliver and Slattery, 1985).
These ecosystem impacts of gray
whale benthic feeding I have described above demonstrate the various stages of
invaders after a feeding disturbance, and the process of succession. Succession
is the ecological process of how a community structure builds and grows.
Primary succession is when the structure grows from truly nothing and secondary
succession occurs after a disturbance, such as a fire. In secondary succession,
there are typically pioneer species that first appear and then give way to
other species and a more complex community eventually emerges. Succession is
well documented in many terrestrial studies after disturbance events, and the
processes of secondary succession is very important to community ecology and
resilience.
Since gray whale benthic foraging
does not impact an entire habitat all at once, the process is not perfectly
comparable to secondary succession in terrestrial systems. Yet, when thinking
about the smaller scale, another example of succession in the marine environment
takes place at a whale fall. When a whale dies and sinks to the ocean floor, a
small ecosystem emerges. Different organisms arrive at different stages to
scavenge different parts of the carcass and a food web is created around it.
To
me the impacts of gray whale benthic feeding are akin to both terrestrial disturbance
events and whale falls. The excavation serves as a disturbance, and through secondary
succession the habitat is refreshed via stages of different species colonization
until the system eventually returns to the pre-disturbance levels. However,
like a whale fall the feeding event leaves behind injured or displaced
organisms that scavengers consume; in fact seabirds are known to take advantage
of benthic invertebrates that are brought to the surface by a gray whale feeding
event (Harrison, 1979).
So much of our research is focused
on questions about how the changing environment impacts our study species and
not the other way around. This venture into the literature has provided me with
an important reminder to think about flipping the question. I have enjoyed
starting 2020 with a reminder of how cool gray whales are, and that while a
disturbance can initially be thought of as negative, it may actually bring
about important, and positive, change.
References
Nerini, Mary. 1984. “A Review of Gray Whale Feeding
Ecology.” In The Gray Whale: Eschrichtius Robustus, 423–50. Elsevier
Inc. https://doi.org/10.1016/B978-0-08-092372-7.50024-8.
Oliver, J. S., and P. N. Slattery. 1985. “Destruction and
Opportunity on the Sea Floor: Effects of Gray Whale Feeding.” Ecology 66
(6): 1965–75. https://doi.org/10.2307/2937392.
Torres, Leigh G., Sharon L. Nieukirk, Leila Lemos, and Todd
E. Chandler. 2018. “Drone up! Quantifying Whale Behavior from a New Perspective
Improves Observational Capacity.” Frontiers in Marine Science 5 (SEP).
https://doi.org/10.3389/fmars.2018.00319.
Weitkamp, Laurie A, Robert C Wissmar, Charles A Simenstad,
Kurt L Fresh, and Jay G Odell. 1992. “Gray Whale Foraging on Ghost Shrimp
(Callianassa Californiensis) in Littoral Sand Flats of Puget Sound, USA.” Canadian
Journal of Zoology 70 (11): 2275–80. https://doi.org/10.1139/z92-304.
Johnson, Kirk R., and C. Hans Nelson. 1984. “Side-Scan Sonar
Assessment of Gray Whale Feeding in the Bering Sea.” Science 225 (4667):
1150–52.
Harrison, Craig S. 1979. “The Association of Marine Birds
and Feeding Gray Whales.” The Condor 81 (1): 93.
https://doi.org/10.2307/1367866.
I am finally starting my 3rd and last year of my PhD. Just a year left and yet so many things to do. As per department requirements, I still need to take some class credits, but what classes could I take? In this short amount of time it is important to focus on my research project and on what could help me better understand the many branches of the project and what could improve my analyses. Thinking of that, both my advisor (Dr. Leigh G. Torres) and I agreed that it would be useful for me to take a class on remote sensing. So, I could learn more about this field, as well as try to include some remote sensing analyses in my project, such as sea surface temperature (SST) and chlorophyll (i.e., as a productivity indicator) conditions over the years we have collected data on gray whales off the Oregon coast.
Our photogrammetry data indicates that whales gradually increased their body condition over the feeding seasons of 2016 and 2018, while 2017 is different. Whales were still looking skinny in the middle of the season, and we were not collecting many fecal samples up to that point (indicating not much feeding). These findings made us wonder if this was related to delayed seasonal upwelling events and consequently low prey availability. These questions are what motivated me the most to join this class so that we might be able to link environmental correlates with our observations of gray whale body condition.
Figure 01: Skinny body condition state of the gray whale “Pancake” in August 2017. Source: Leila S. Lemos
If we stop to think about what remote sensing is, we have already been implementing this method in our project since the beginning, as my favorite definition for remote sensing is “the art of collecting information of objects or phenomenon without touching it”. So, yes, the drone is a type of sensor that remotely collects information of objects (in this case, whales).
Figure 02: Drone remotely collecting information of a whale in September 2018. Drone in detail. Collected under NOAA/NMFS permit #16111. Source: Leila Lemos
However, satellites, all the way up in the space, are also remotely sensing the Earth and its objects and phenomena. Even from thousands of km above Earth, these sensors are capable of generating a great amount of detailed data that is easily and freely accessible (i.e., NASA, NOAA), and can be used for multiple applications in different fields of study. Satellites are also able to collect data from remote areas like the Antarctica and the Arctic, as well as other areas that are not easily reached by humans. One important application of the use of satellite imagery is wildlife monitoring.
For example, satellite data was used to detect variation in the abundance of Weddell seals (Leptonychotes weddellii) in Erebus Bay, Antarctica (LaRue et al., 2011). Because this is a well-studied seal population, the object of this study was to test if satellite imagery could produce reliable abundance estimates. The authors used high-resolution (0.6 m) satellite imagery (from satellites Quick-Bird-2 and WorldView-1) to compare counts from the ground with counts from satellite images in the same locations at the same time. This study demonstrated a reliable methodology for further studies to replicate.
Figure 03: WorldView-1 image (0.6 m resolution) of Weddell seals hauled out east of Inaccessible Island, Erebus Bay, Antarctica. Source: LaRue et al. (2011).
Satellite imagery was also applied to estimate colony sizes of Adélie penguins in Antarctica (LaRue et al., 2014). High-resolution (0.6 m) satellite imagery combined with spectral analysiswas used to estimate the sizes of the penguin breeding colonies. Ground counts were also used in order to check the reliability of the applied method. The authors then created a model to predict the abundance of breeding pairs as a function of the habitat, which was identified terrain slope as an important component of nesting density.
The identification of whales using satellite imagery is also possible. Fretwell et al. (2014)pioneered this method by successfully identifing Southern Right Whales (Eubalaena australis) in the Golfo Nuevo, Península Valdés, in Argentina in satellite images. By using very high-resolution satellite imagery (50 cm resolution) and a water penetrating coastal band that was able to see deeper into the water column, the researchers were able to successfully identify and count the whales (Fig. 04). The importance of this study was very significant, since this species was extensively hunted from the 17ththrough to the 20thcentury. Since then, the species has shown a strong recovery, but population estimates are still at <15% of historical estimates. Thus, being able to use new tools to identify, count and monitor individuals in this recovering population is a great development, especially in remote and hard to reach areas.
Figure 04: Identification of Southern Right Whales by using imagery from the WorldView2 satellite in the Golfo Nuevo Bay, Península Valdés, Argentina. Source: Fretwell et al. (2014).
Polar bears (Ursus maritimus) have also been studied in the Foxe Basin, in Nunavut and Quebec, Canada (LaRue et al., 2015). Researchers used high-resolution satellite imagery in an attempt to identify and count the bears, but spectral signature differences between bears and other objects were insufficient to yield useful results. Therefore, researchers developed an automated image differencing, also known as change detection, that identifies differences between remotely sensed images collected at different times and “subtract of one image from another”. This method correctly identified nearly 90% of the bears. The technique also generated false positives, but this problem can be corrected by a manual review.
Figure 05 shows the difference in resolution of two types of satellite imagery, the panchromatic (0.6 m resolution) and the multispectral (2.4 m resolution). LaRue et al. (2015)decided not to use the multispectral imagery due to resolution constraints.
Figure 05: Polar Bears on panchromatic (0.6 m resolution) and multispectral (2.4 m resolution) imagery. Source: LaRue et al. (2015).
A more recent study is being conducted by my fellow OSU Fisheries and Wildlife graduate student, Jane Dolliveron breeding colonies of three species of North Pacific albatrosses (Phoebastria immutabilis, Phoebastria nigripes, and Phoebastria albatrus)(Dolliver et al., 2017). Jane is using high-resolution multispectral satellite imagery (DigitalGlobe WorldView-2 and -3) and image processing techniques to enumerate the albatrosses. They are also using albatross species at multiple reference colonies in Hawaii and Japan (Fig. 06) to determine species identification accuracy and required correction factor(s). This will allow scientists to accurately count unknown populations on the Senkakus, which are uninhabited islands controlled by Japan in the East China Sea.
Figure 06: Satellite image of a colony of short-tailed albatrosses (Phoebastria albatrus) in Torishima, Japan, 2016. Source: Satellite image provided by Jane Dolliver.
Using satellite imagery to count seals, penguins, whales, bears and albatrosses is just the start of this rapidly advancing technology. Techniques and resolutions are continuously improving. Methods can also be applied to many other endangered species, especially in remote areas, providing data on presence, abundance, annual productivity, population estimates and trends, changes in distribution, and breeding ground usage.
Other than directly monitoring wildlife, satellite images can also provide information on the environmental variables that can be related to wildlife presence, abundance, productivity and distribution.
Gentemann et al. (2017), for example, used satellite data from NASA to analyze SST variations along the west coast of the United States from 2002 to 2016. The NASA Jet Propulsion Laboratory produces global, daily, 1 km, multiscale ultra-high resolution, motion-compensated analysis of SST, and incorporates SSTs from eight different satellites. Researchers were able to identify warmer than usual SSTs (also called anomalies) along the Washington, Oregon, and California coasts from January 2014 to August 2016 (Fig.07) relative to previous years. This marine heat wave started in the Gulf of Alaska and ended in Southern California, where SST reached a maximum temperature anomaly of 6.2°C, causing major disturbances and substantial economic impacts.
Figure 07: Monthly SST anomalies in the West Coast of United States, from January 2014 to August 2016. Source: Gentemann et al. (2017).
Changes in SST and winds may alter events such as the coastal upwelling that supplies nutrients to sustain a whole food chain. A marine heat-wave event as described by Gentemann et al. (2017)could have significant impacts on the health of the marine ecosystem in the subsequent season (Gentemann et al., 2017).
These findings may even relate to our questions regarding the poor gray whale body condition we noticed in 2017: this marine heat wave that lasted until August 2016 along the US west coast could have impacted the ecosystem in the subsequent season. However, I must conduct a more detailed study to determine if this heat wave was related or if another oceanographic process was involved.
So, whether remotely sensed data is generated by satellites, drones, thermal imagery, robots (as I previously wrote about), or another type of technology, it can have important and informative applications to monitor wildlife or environmental variables associated with their ecology and biology. We can take advantage of remotely sensed technology to aid wildlife conservation efforts.
References
Dolliver, J., et al., Multispectral processing of high resolution satellite imagery to determine the abundance of nesting albatross. Ecological Society of America, Portland, OR, United States., 2017.
Fretwell, P. T., et al., 2014. Whales from Space: Counting Southern Right Whales by Satellite. Plos One. 9,e88655.
Gentemann, C. L., et al., 2017. Satellite sea surface temperatures along the West Coast of the United States during the 2014–2016 northeast Pacific marine heat wave. Geophysical Research Letters. 44,312-319.
LaRue, M. A., et al., 2014. A method for estimating colony sizes of Adélie penguins using remote sensing imagery. Polar Biology. 37,507-517.
LaRue, M. A., et al., 2011. Satellite imagery can be used to detect variation in abundance of Weddell seals (Leptonychotes weddellii) in Erebus Bay, Antarctica. Polar Biology. 34,1727–1737.
LaRue, M. A., et al., 2015. Testing Methods for Using High-Resolution Satellite Imagery to Monitor Polar Bear Abundance and Distribution. Wildlife Society Bulletin. 39,772-779.
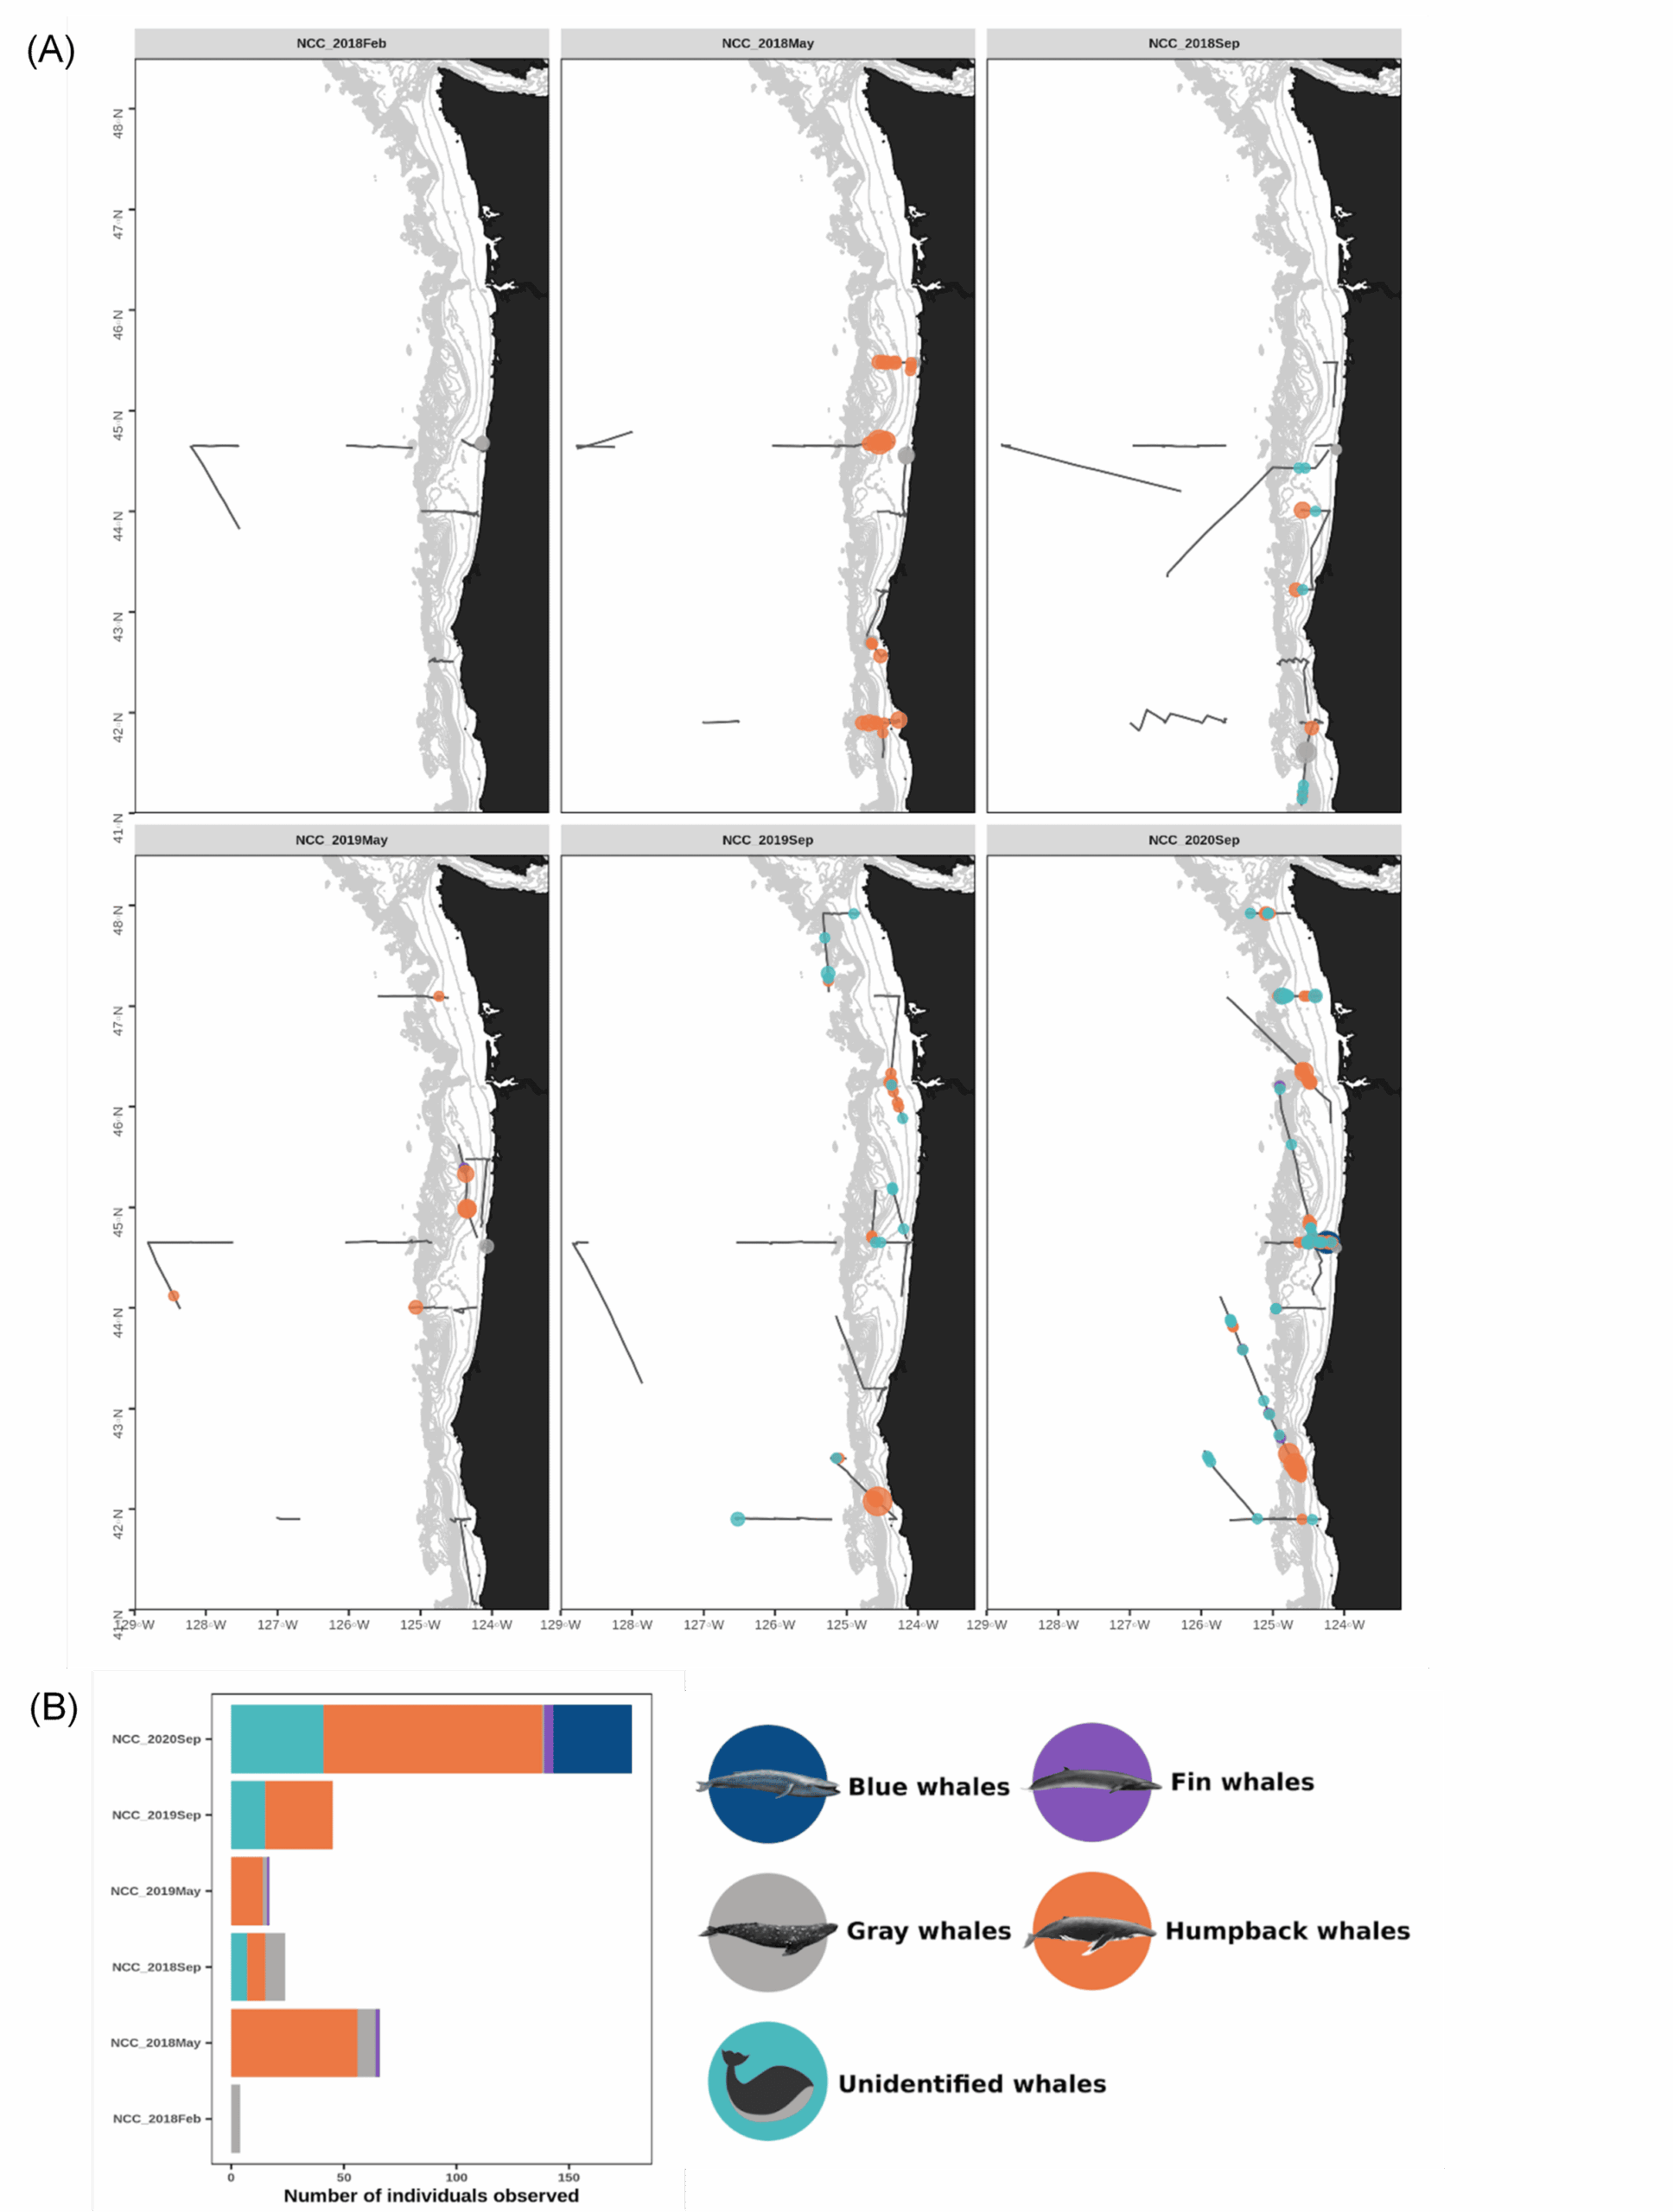


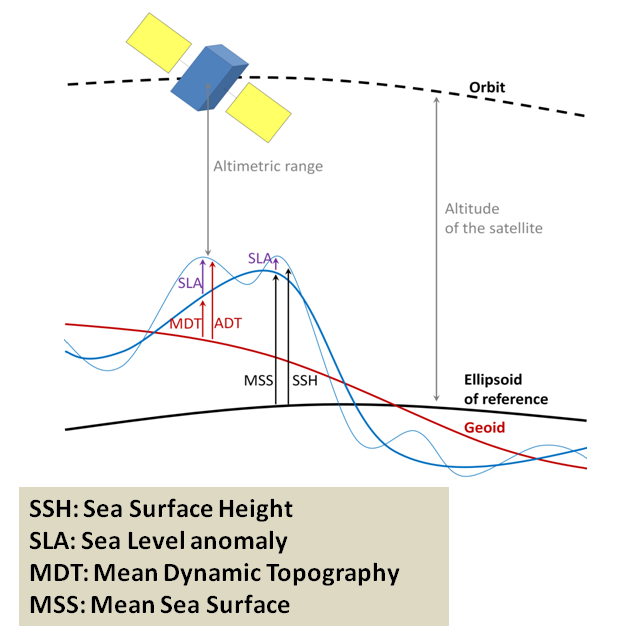

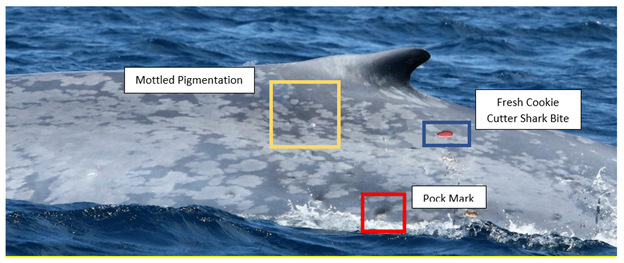


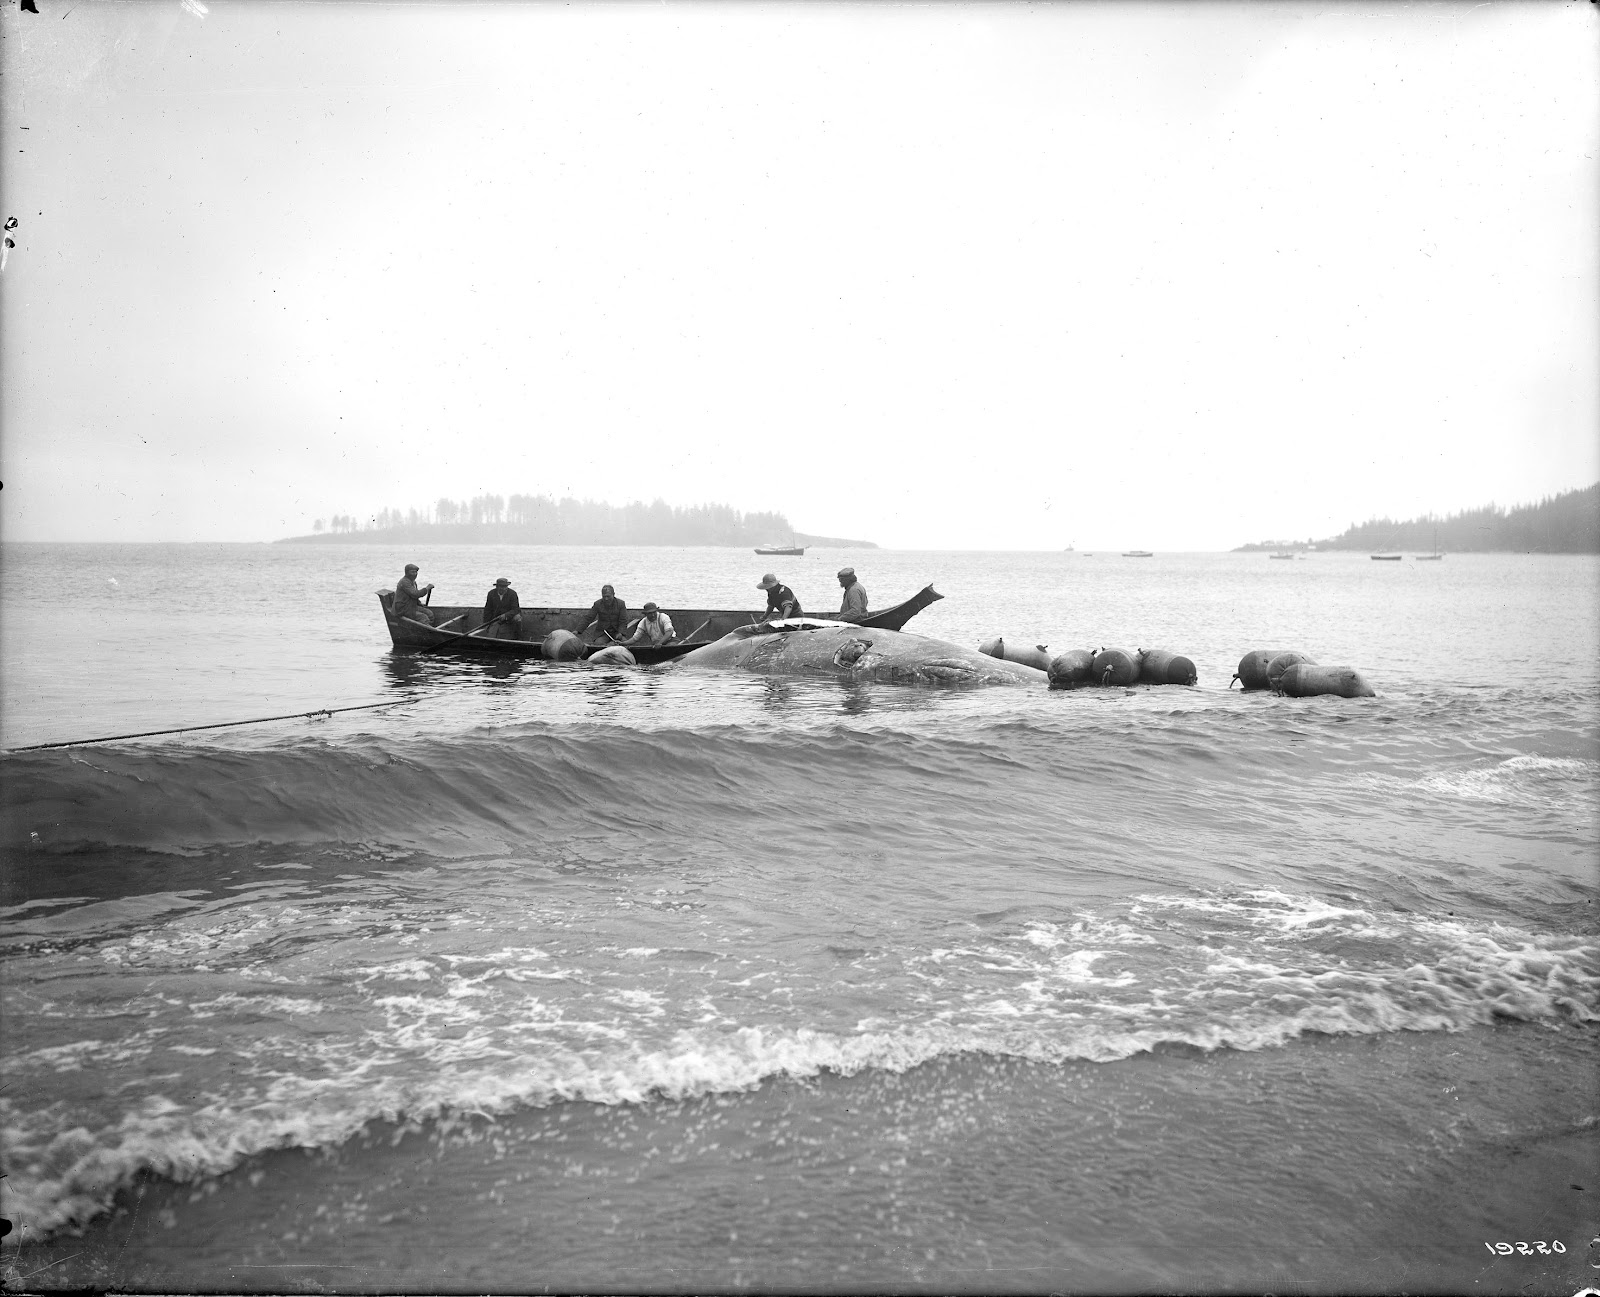

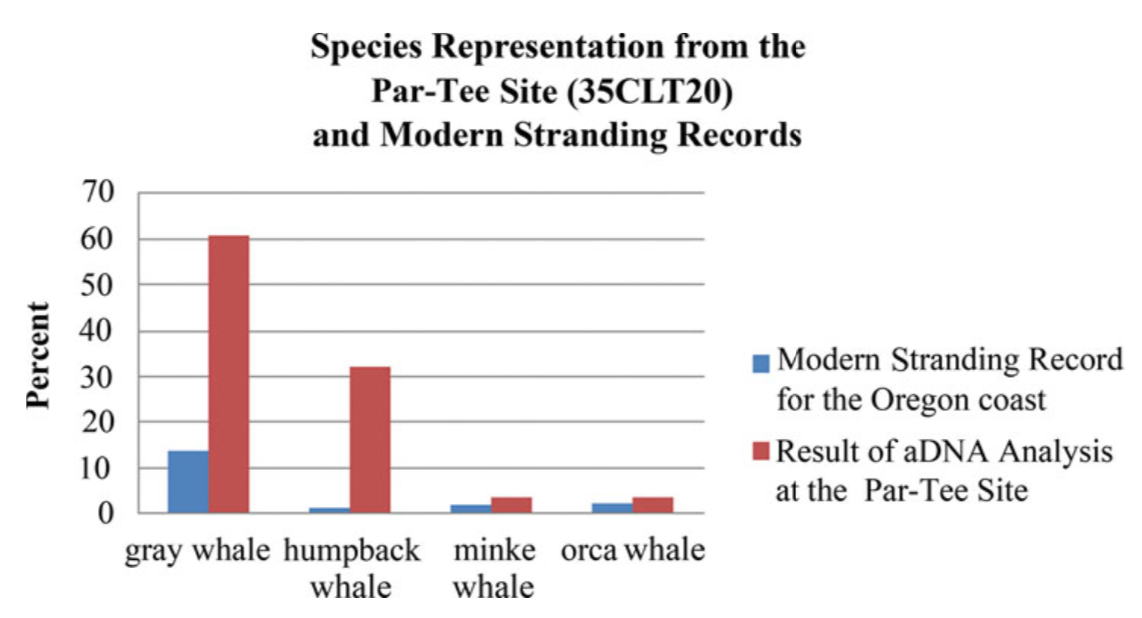


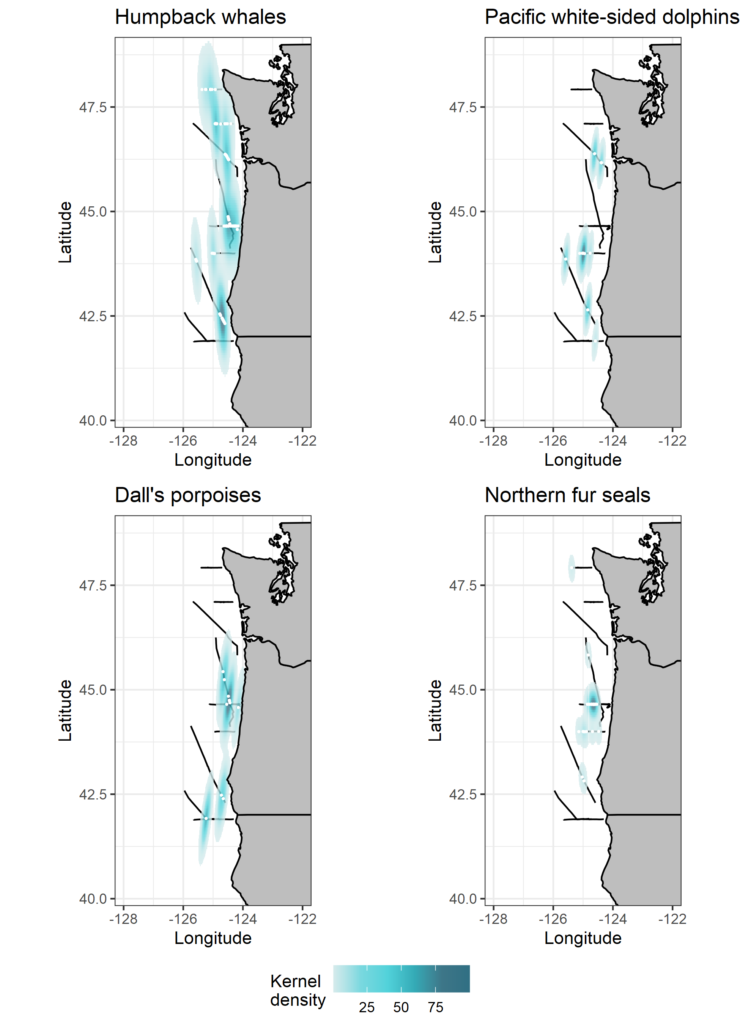


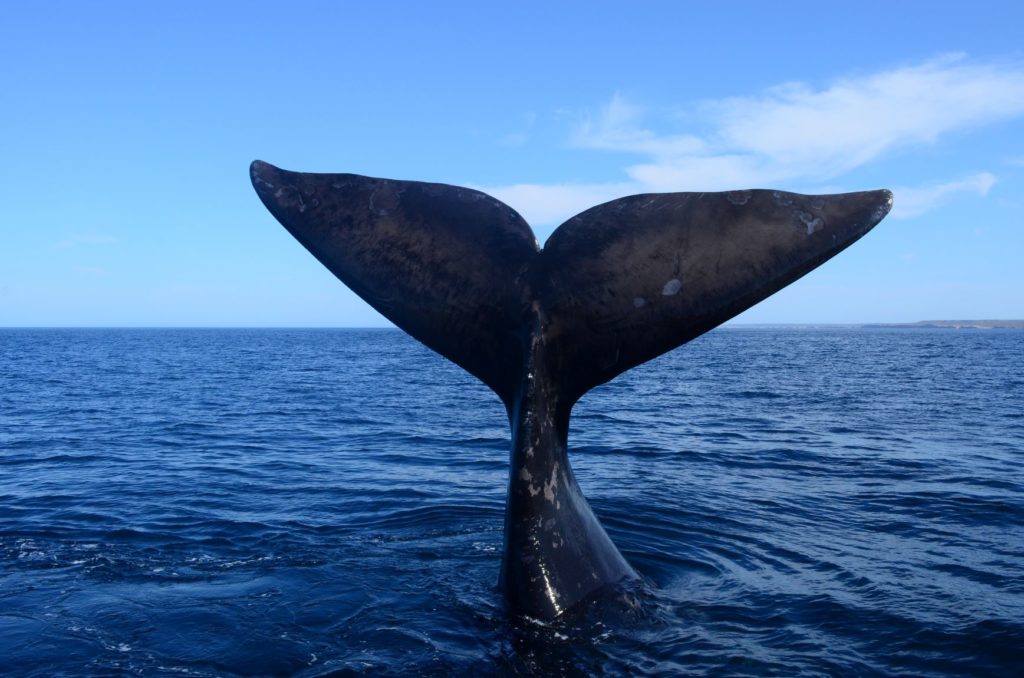


