New publication reveals gray whale habitat use patterns over three decades in the Northern California Current

By Dr. Dawn Barlow, Postdoctoral Scholar, OSU Department of Fisheries, Wildlife, and Conservation Sciences, Geospatial Ecology of Marine Megafauna Lab

The EMERALD project (Examining Marine mammal Ecology through Regional Assessment of Long-term Data) has reached a milestone with a recent publication detailing our findings on long-term gray whale distribution, abundance, and habitat use patterns (Barlow et al. 2024). The study is made possible by an incredible dataset. Every May-July since 1992, a team of observers surveyed the coastline between the Columbia River at the border between Oregon and Washington and San Francisco Bay, California for marbled murrelets, a seabird species of conservation concern. They drive a small vessel along pre-determined tracklines, and record observations of seabirds and marine mammals—not just marbled murrelets—and fortunately for us, that means there is a record of annual gray whale distribution and abundance patterns that spans over three decades.

The Crescent Coastal Research team collecting survey data. We are incredibly grateful to Craig Strong and the many folks who collected these valuable observations over the years!

We analyzed these valuable data using density surface modeling to better understand what drives gray whale distribution and abundance, what their habitat preferences are, and whether and how these occurrence patterns have changed over time. I am excited to share a few of our findings here!

Long-term, stable hotspots

The survey data revealed three main areas with consistently high gray whale density: the central Oregon Coast off Newport, Cape Blanco off Oregon’s south coast, and the mouth of the Klamath River in northern California. Despite fluctuations in how many whales were observed over the years, these areas have remained predicable hotspots for gray whales during their summer feeding season.

(A) Mean gray whale encounter rate (whales/kilometers surveyed) summarized by year, across all latitudes. (B) Mean gray whale encounter rate summarized by 1° latitude bin, across all years. White indicates times and locations with no survey effort. (C) Mean gray whale encounter rate summarized by year and 1° latitude bin. (D) Map of the study area, with region boundaries shown by the dashed lines, and major placenames denoted. Figure and caption reproduced from Barlow et al. 2024.

Key regional differences

Major features like prominent capes divide the California Current into different regions with distinct oceanographic characteristics. We found that gray whales showed different habitat preferences in the different regions. In the northern part of our study area between the Columbia River and Cape Blanco, we found that rocky bottom substrate was strongly related to areas of higher gray whale abundance, despite being far less available than soft, sandy bottom habitat. In the region between Cape Blanco and Cape Mendocino, gray whales were more abundant in areas south of prominent capes and in closer proximity to river estuaries.

Coastal upwelling and relaxation are key

Coastal upwelling—the process by which winds in the spring and summer push surface water offshore that is then replaced by cold, nutrient-rich water that is brought into the sunlight and drives an abundance of marine life—is a critically important influence in the oceanography, ecology, and biodiversity of our study region. But relaxation of those upwelling winds is also important for coastal species, as relaxation events allow the upwelled nutrients to be retained in the nearshore waters and enhance and aggregate local productivity and prey. We found that gray whale abundance was highest when there was a combination of both upwelling and relaxation events—a critical balance of “enough but not too much”—that seems to be optimal for gray whale feeding opportunities in nearshore waters.

You are what, where, and how you eat

Gray whales are incredibly flexible predators and have a wide range of prey items they are known to feed on. We found that throughout our study range, gray whales have different habitat preferences. As they spend their summers here to feed, these habitat preferences are linked to their foraging preferences. Off the central Oregon Coast, gray whales are known to feed on zooplankton that aggregate around rocky reefs and kelp forests (Hildebrand et al. 2022, 2024).

A gray whale surfaces in a patch of kelp, foraging around a rocky reef. UAS image credit: GEMM Lab.

Further south, in the region between Cape Blanco and Cape Mendocino that encompassed the long-term hotspot of gray whale sightings off the Klamath River, our models revealed different habitat preferences. In the soft-bottom habitat off the Klamath River, gray whales are known to do more benthic feeding, whereby they scoop up the seafloor and filter out the invertebrates in the sediment such as amphipods and cumaceans (Mallonée 1991, Jenkinson 2001).

A gray whale surfaces with a mouth full of muddy sediment, filtering out the invertebrate prey. UAS image credit: GEMM Lab.

These differences in regional habitat preferences and preferred prey likely relate to larger-scale phenomena as well. Indeed, when we looked at how gray whale abundance in different regions related to widespread warm or cool phases in the North Pacific Ocean, the responses differed by region. This aspect of the study indicates that what gray whales eat and where they forage influences how they respond to shifting environmental conditions and prey availability.

Conservation of an iconic nearshore predator

The unique mosaic of habitat characteristics throughout the Northern California Current summer feeding range of gray whales provides them the opportunity to gain the energetic stores they need to survive, reproduce, and migrate. Thus, the reliability of these resources has led them to return to these stable foraging hotspots year after year. Under climate change, one potential impact on upwelling systems is shifts in the intensity and location of upwelling (Bograd et al. 2023); in the Northern California Current, this could mean reduced relaxation events that we found are crucial for gray whales feeding in this habitat. Furthermore, these whales overlap with human activities such as vessel disturbance, entanglement and vessel strike risk, and ocean noise throughout the foraging season, and have to bear the consequences of these anthropogenic stressors (Sullivan & Torres 2018, Lemos et al. 2022, Pirotta et al. 2023) as they also navigate changing environmental conditions. Our study highlights the value of long-term monitoring to better understand present ecological patterns in the context of the past, which can be used to inform conservation management decisions for the future.

For more details, we invite you to read the full, open access publication here: https://www.nature.com/articles/s41598-024-59552-z

Did you enjoy this blog? Want to learn more about marine life, research, and conservation? Subscribe to our blog and get a weekly alert when we make a new post! Just add your name into the subscribe box below!

Loading

References

Barlow DR, Strong CS, Torres LG (2024) Three decades of nearshore surveys reveal long-term patterns in gray whale habitat use, distribution, and abundance in the Northern California Current. Sci Rep 14:9352.

Bograd SJ, Jacox MG, Hazen EL, Lovecchio E, Montes I, Pozo Buil M, Shannon LJ, Sydeman WJ, Rykaczewski RR (2023) Climate Change Impacts on Eastern Boundary Upwelling Systems. Ann Rev Mar Sci 15:1–26.

Hildebrand L, Derville S, Hildebrand I, Torres LG (2024) Exploring indirect effects of a classic trophic cascade between urchins and kelp on zooplankton and whales. Sci Rep 14.

Hildebrand L, Sullivan FA, Orben RA, Derville S, Torres LG (2022) Trade-offs in prey quantity and quality in gray whale foraging. Mar Ecol Prog Ser 695:189–201.

Jenkinson RS (2001) Gray whale (Eschrichtius robustus) prey availability and feeding ecology in Northern California, 1999-2000. Humboldt State University

Lemos L, Haxel J, Olsen A, Burnett JD, Smith A, Chandler TE, Nieukirk SL, Larson SE, Hunt KE, Torres LG (2022) Effects of vessel traffic and ocean noise on gray whale stress hormones. Sci Rep 12:1–13.

Mallonée JS (1991) Behaviour of gray whales (Eschrichtius robustus) summering off the northern California coast, from Patrick’s Point to Crescent City. Can J Zool 69:681–690.

Pirotta E, Fernandez Ajó A, Bierlich KC, Bird CN, Buck CL, Haver SM, Haxel JH, Hildebrand L, Hunt KE, Lemos LS, New L, Torres LG (2023) Assessing variation in faecal glucocorticoid concentrations in gray whales exposed to anthropogenic stressors. Conserv Physiol 11:coad082.

Sullivan FA, Torres LG (2018) Assessment of vessel disturbance to gray whales to inform sustainable ecotourism. J Wildl Manage 82:896–905.

New GEMM Lab publication reveals how blue whale feeding and reproductive effort are related to environmental conditions

By Dr. Dawn Barlow, Postdoctoral Scholar, OSU Department of Fisheries, Wildlife, and Conservation Sciences, Geospatial Ecology of Marine Megafauna Lab

Learning by listening

Studying mobile marine animals that are only fleetingly visible from the water’s surface is challenging. However, many species including baleen whales rely on sound as a primary form of communication, producing different vocalizations related to their fundamental needs to feed and reproduce. Therefore, we can learn a lot about these elusive animals by monitoring the patterns of their calls. In the final chapter of my PhD, we set out to study blue whale ecology and life history by listening. I am excited to share our findings, recently published in Ecology and Evolution.

Blue whales produce two distinct types of vocalizations: song is produced by males and is hypothesized to play a role in breeding behavior, and D calls are a hypothesized social call produced by both sexes in association with feeding behavior. We analyzed how these different calls varied seasonally, and how they related to environmental conditions.

This paper is a collaborative study co-authored by Dr. Holger Klinck and Dimitri Ponirakis of the K. Lisa Yang Center for Conservation Bioacoustics, Dr. Trevor Branch of the University of Washington, and GEMM Lab PI Dr. Leigh Torres, and brings together multiple methods and data sources. Our findings shed light on blue whale habitat use patterns, and how climate change may impact both feeding and reproduction for this species of conservation concern.

The South Taranaki Bight: an ideal study system

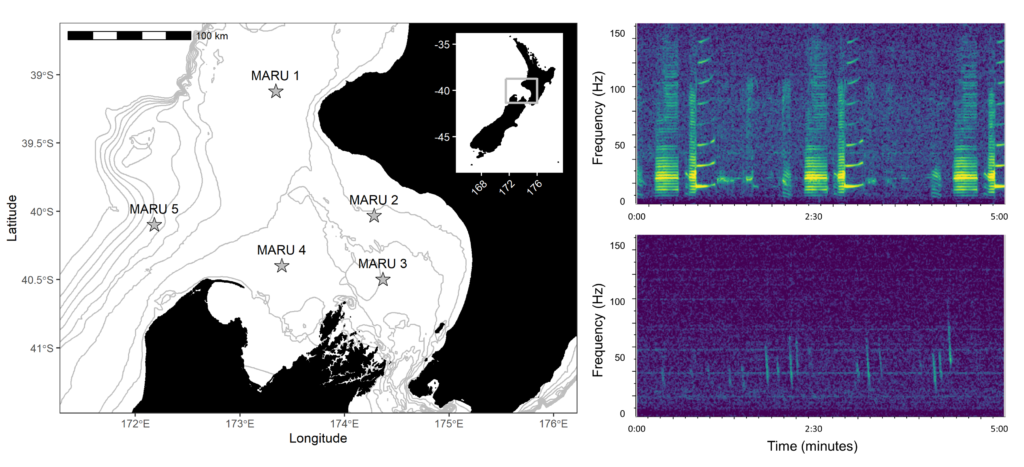
Baleen whales typically migrate between high-latitude, productive feeding grounds and low-latitude breeding grounds. However, the New Zealand blue whale population is present in the South Taranaki Bight (STB) region year-round, which uniquely enabled us to monitor their behavior, ecology, and life history across seasons and years from a single location. We recorded blue whale vocalizations from Marine Autonomous Recording Units (MARUs) deployed at five locations in the STB for two full years (Fig. 1).

Figure 1. Study area map and blue whale call spectrograms. Left panel: map of the study area in the South Taranaki Bight region, with hydrophone (marine autonomous recording unit; MARU) locations denoted by the stars. Gray lines show bathymetry contours at 50 m depth increments, from 0 to 500 m. Location of the study area within New Zealand is indicated by the inset map. Right panels: example spectrograms of the two blue whale call types examined: the New Zealand song recorded on 31 May 2016 (top) and D calls recorded 20 September 2016 (bottom). Figure reproduced from Barlow et al. (2023).

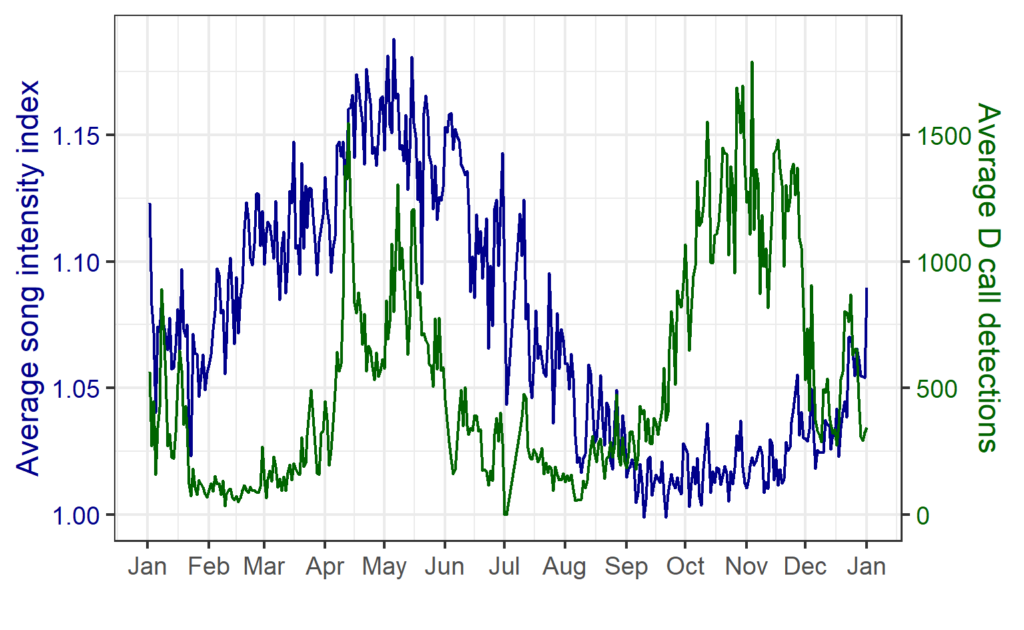
We found that the two vocalization types had different seasonal occurrence patterns (Fig. 2). D calls were associated with upwelling conditions that indicate feeding opportunities, lending evidence for their function as a foraging-related call.

Figure 2. Average annual cycle in the song intensity index (dark blue) and D calls (green) per day of the year, computed across all hydrophone locations and the entire two-year recording period. Figure reproduced from Barlow et al. (2023).

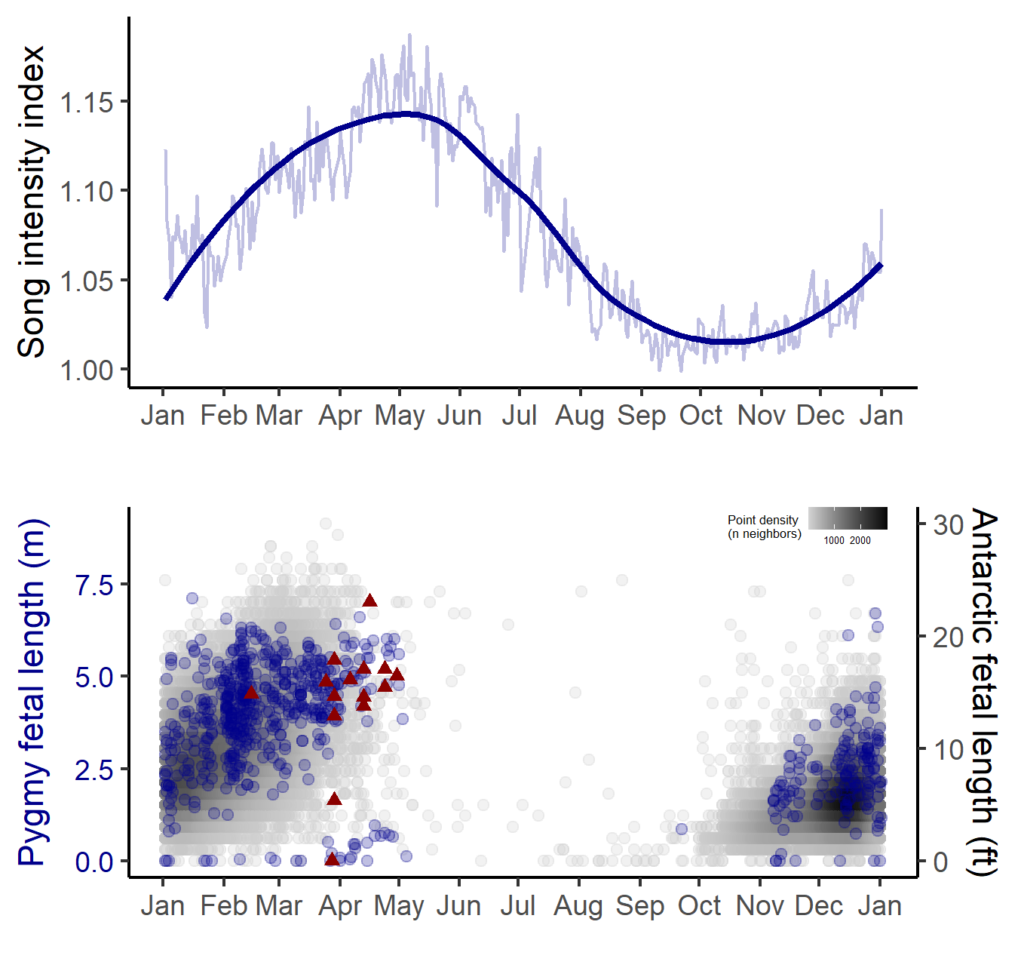
In contrast, blue whale song showed a very clear seasonal peak in the fall and was less obviously correlated with environmental conditions. To investigate the hypothesized function of song as a breeding call, we turned to a perhaps unintuitive source of information: historical whaling records. Whenever a pregnant whale was killed during commercial whaling operations, the length of the fetus was measured. By looking at the seasonal pattern in these fetal lengths, we can presume that births occur around the time of year when fetal lengths are at their longest. The records indicated April-May. By back-calculating the 11-month gestation time for a blue whale, we can presume that mating occurs generally in May-June, which is the exact time of the peak in song intensity from our recordings (Fig. 3).

Figure 3. Annual song intensity and the breeding cycle. Top panel: average yearly cycle in song intensity index, computed across the five hydrophone locations and the entire recording period; dark blue line represents a loess smoothed fit. Bottom panel: fetal length measurements from whaling catch records for Antarctic blue whales (gray, measurements rounded to the nearest foot), pygmy blue whales in the southern hemisphere (blue, measurements rounded to the nearest centimeter). Measurements from blue whales caught within the established range of the New Zealand population are denoted by the dark red triangles. Calving presumably takes place around or shortly after fetal lengths are at their maximum (April–May), which implies that mating likely occurs around May–June, coincident with the peak song intensity. Figure reproduced from Barlow et al. (2023).

With this evidence for D calls as feeding-related calls and song as breeding-related calls, we had a host of new questions, we used this gained knowledge to explore how changing environmental conditions might impact multiple life history processes for New Zealand blue whales

Marine heatwaves impact multiple life history processes

Our study period between January 2016 and February 2018 spanned both typical upwelling conditions and dramatic marine heatwaves in the STB region. While we previously documented that the marine heatwave of 2016 affected blue whale distribution, the population-level impacts on feeding and reproductive effort remained unknown. In our recent study, we found that during marine heatwaves, D calls were dramatically reduced compared to during productive upwelling conditions. During the fall breeding peak, song intensity was likewise dramatically reduced following the marine heatwave. This relationship indicates that following poor feeding conditions, blue whales may invest less effort in reproduction. As marine heatwaves are projected to become more frequent and more intense under global climate change, our findings are perhaps a warning for what is to come as animal populations must contend with changing ocean conditions.

More than a decade of research on New Zealand blue whales

Ten years ago, Leigh first put forward a hypothesis that the STB region was an undocumented blue whale foraging ground based on multiple lines of evidence (Torres 2013). Despite pushback and numerous challenges, Leigh set out to prove her hypothesis through a comprehensive, multi-year data collection effort. I was lucky enough to join the team in 2016, first as a Masters’ student, and then as a PhD student. In the time since Leigh’s hypothesis, we not only documented the New Zealand blue whale population (Barlow et al. 2018), we learned a great deal about what drives blue whale feeding behavior (Torres et al. 2020) and habitat use patterns (Barlow et al. 2020, 2021), and developed forecast models to predict blue whale distribution for dynamic management of the STB (Barlow & Torres 2021). We also documented their unique, year-round presence in the STB, distinct from the migratory or vagrant presence of other blue whale populations (Barlow et al. 2022b). We now understand how marine heatwaves impact both feeding opportunities and reproductive effort (Barlow et al. 2023). We even analyzed blue whale skin condition (Barlow et al. 2019) and acoustic response to earthquakes (Barlow et al. 2022a) along the way. A decade later, it is humbling to reflect on how much we have learned about these whales. This paper is also the final chapter of my PhD, and as I reflect on how I have grown both personally and scientifically since I interviewed with Leigh as a wide-eyed undergraduate student in fall 2015, I am filled with gratitude for the opportunities for learning and growth that Leigh, these whales, and many mentors and collaborators have offered over the years. As is often the case in science, the more questions you ask, the more questions you end up with. We are already dreaming up future studies to further understand the ecology, health, and resilience of this blue whale population. I can only imagine what we might learn in another decade.

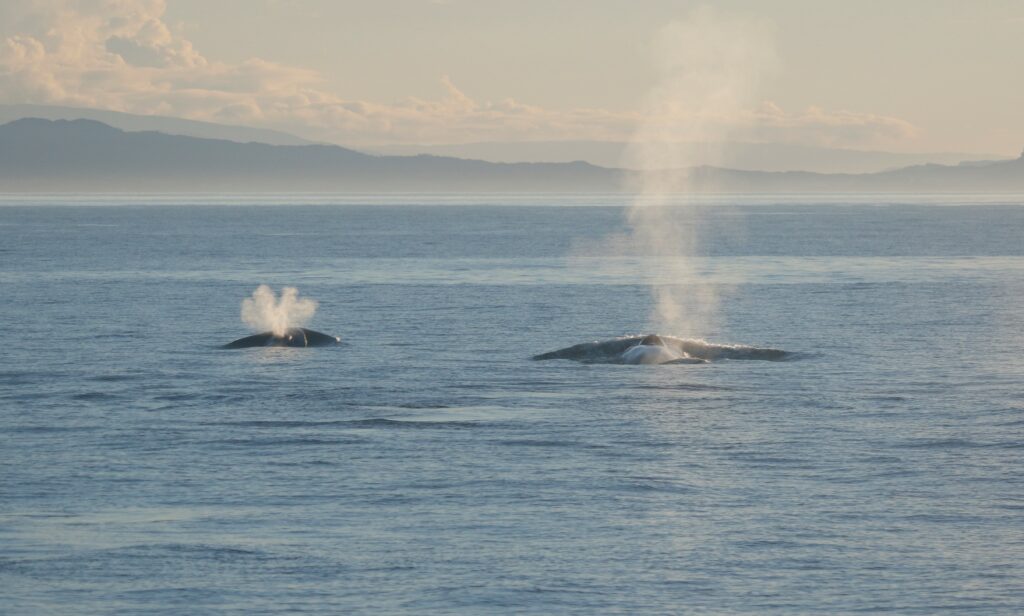
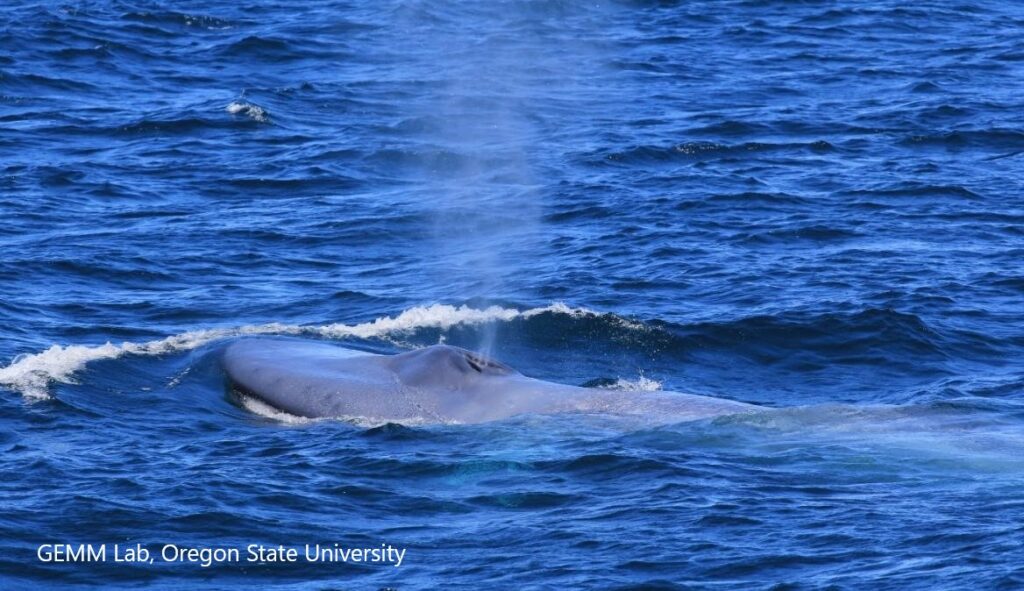
Figure 5. A blue whale mother and calf pair come up for air in the South Taranaki Bight. Photo by Dawn Barlow.

Did you enjoy this blog? Want to learn more about marine life, research, and conservation? Subscribe to our blog and get a weekly alert when we make a new post! Just add your name into the subscribe box below!

Loading

References:

Barlow DR, Bernard KS, Escobar-Flores P, Palacios DM, Torres LG (2020) Links in the trophic chain: Modeling functional relationships between in situ oceanography, krill, and blue whale distribution under different oceanographic regimes. Mar Ecol Prog Ser 642:207–225.

Barlow DR, Estrada Jorge M, Klinck H, Torres LG (2022a) Shaken, not stirred: blue whales show no acoustic response to earthquake events. R Soc Open Sci 9:220242.

Barlow DR, Klinck H, Ponirakis D, Branch TA, Torres LG (2023) Environmental conditions and marine heatwaves influence blue whale foraging and reproductive effort. Ecol Evol 13:e9770.

Barlow DR, Klinck H, Ponirakis D, Garvey C, Torres LG (2021) Temporal and spatial lags between wind, coastal upwelling, and blue whale occurrence. Sci Rep 11:1–10.

Barlow DR, Klinck H, Ponirakis D, Holt Colberg M, Torres LG (2022b) Temporal occurrence of three blue whale populations in New Zealand waters from passive acoustic monitoring. J Mammal.

Barlow DR, Pepper AL, Torres LG (2019) Skin deep: An assessment of New Zealand blue whale skin condition. Front Mar Sci 6:757.

Barlow DR, Torres LG (2021) Planning ahead: Dynamic models forecast blue whale distribution with applications for spatial management. J Appl Ecol 58:2493–2504.

Barlow DR, Torres LG, Hodge KB, Steel D, Baker CS, Chandler TE, Bott N, Constantine R, Double MC, Gill P, Glasgow D, Hamner RM, Lilley C, Ogle M, Olson PA, Peters C, Stockin KA, Tessaglia-hymes CT, Klinck H (2018) Documentation of a New Zealand blue whale population based on multiple lines of evidence. Endanger Species Res 36:27–40.

Torres LG (2013) Evidence for an unrecognised blue whale foraging ground in New Zealand. New Zeal J Mar Freshw Res 47:235–248.

Torres LG, Barlow DR, Chandler TE, Burnett JD (2020) Insight into the kinematics of blue whale surface foraging through drone observations and prey data. PeerJ 8:e8906.

Where will the whales be? Ecological forecast models present new tools for conservation

By Dawn Barlow, PhD Candidate, OSU Department of Fisheries, Wildlife and Conservation Sciences, Geospatial Ecology of Marine Megafauna Lab

Dynamic forecast models predict environmental conditions and blue whale distribution up to three weeks into the future, with applications for spatial management. Founded on a robust understanding of ecological links and lags, a recent study by Barlow & Torres presents new tools for proactive conservation.

The ocean is dynamic. Resources are patchy, and animals move in response to the shifting and fluid marine environment. Therefore, protected areas bounded by rigid lines may not always be the most effective way to conserve marine biodiversity. If the animals we wish to protect are not within protected area boundaries, then ocean users pay a price without the conservation benefit. Management that is adaptive to current conditions may more effectively match the dynamic nature of the species and places of concern, but this approach is only feasible if we have the relevant ecological knowledge to implement it.

The South Taranaki Bight region of New Zealand is home to a foraging ground for a unique population of blue whales that are genetically distinct and present year-round. The area also sustains New Zealand’s most industrial marine region, including active petroleum exploration and extraction, and vessel traffic between ports.

To minimize overlap between blue whale habitat and human use of the area, we develop and test forecasts of oceanographic conditions and blue whale habitat. These tools enable managers to make decisions with up to three weeks lead time in order to minimize potential overlap between blue whales and other ocean users.

Overlap between blue whale habitat and industry presence in the South Taranaki Bight region. A blue whale surfaces in front of a floating production storage and offloading (FPSO) vessel, servicing the oil rigs in the area. Photo by Dawn Barlow.

Predicting the future

Knowing where animals were yesterday may not create effective management boundaries for tomorrow. Like the weather, our expectation of when and where to find species may be based on long-term averages of previous patterns, real-time descriptions based on recent data, and forecasts that predict the future using current conditions. Forecasts allow us to plan ahead and make informed decisions needed to produce effective management strategies for dynamic systems.

Just as weather forecasts help us make decisions about whether to wear a raincoat or pack sunscreen before leaving the house, ecological forecasts can enable managers to anticipate environmental conditions and species distribution patterns in advance of industrial activity that may pose risk in certain scenarios.

In our recent study, we develop and test models that do just that: forecast where blue whales are most likely to be, allowing informed decision making with up to three weeks lead time.

Harnessing accessible data for an applicable tool

We use readily accessible data gathered by satellites and shore-based weather stations and made publicly available online. While our understanding of the ecosystem dynamics in the South Taranaki Bight is founded on years of collecting data at-sea and ecological analyses, using remotely gathered data for our forecasting tool is critical for making this approach operational, sustainable, and useful both now and into the future.

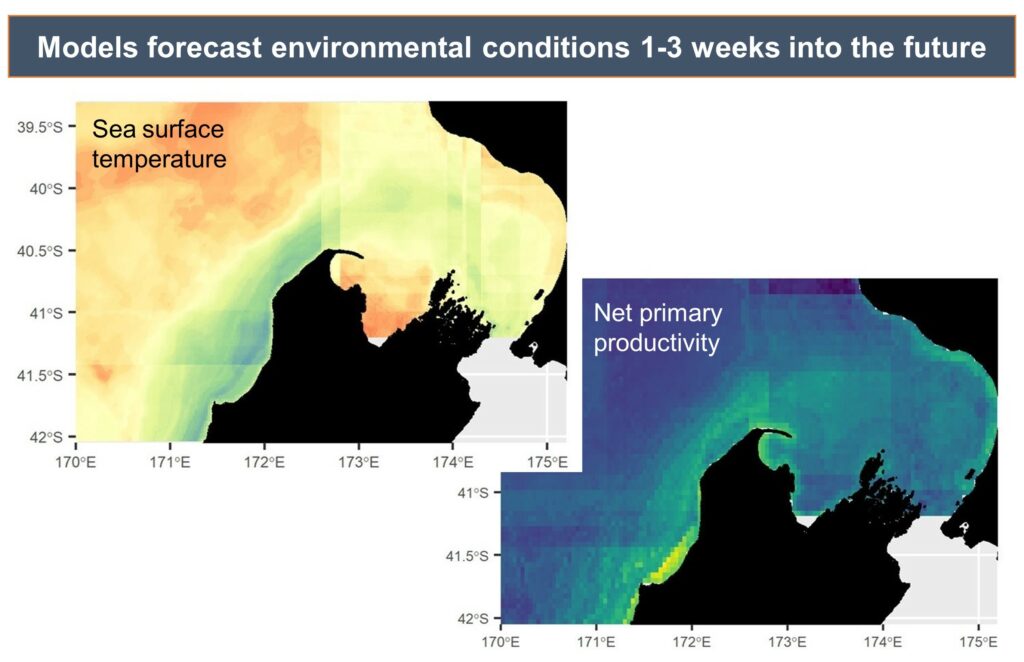
Measurements of conditions such as wind speed and ocean temperature anomaly are paired with known measurements of the lag times between wind input, upwelling, productivity, and blue whale foraging opportunities to produce forecasted environmental conditions.

Example environmental forecast maps, illustrating the predicted sea surface temperature and productivity in the South Taranaki Bight region, which can be forecasted by the models with up to three weeks lead time.

The forecasted environmental layers are then implemented in species distribution models to predict suitable blue whale habitat in the region, generating a blue whale forecast map. This map can be used to evaluate overlap between blue whale habitat and human uses, guiding management decisions regarding potential threats to the whales.

Example forecast of suitable blue whale habitat, with areas of higher probability of blue whale occurrence shown by the warmer colors and the area classified as “suitable habitat” denoted by the white boundaries. This habitat suitability map can be produced for any day in the past 10 years or for any day up to three weeks in the future.

Dynamic ecosystems, dynamic management

These forecasts of whale distribution can be effectively applied for dynamic spatial management because our models are founded on carefully measured links and lags between physical forcing (e.g., wind drives cold water upwelling) and biological responses (e.g., krill aggregations create feeding opportunities for blue whales). The models produce outputs that are dynamic and update as conditions change, matching the dynamic nature of the ecosystem.

A blue whale raises its majestic fluke on a deep foraging dive in the South Taranaki Bight. Photo by Leigh Torres.

Engagement with stakeholders—including managers, scientists, industry representatives, and environmental organizations—has been critical through the creation and implementation of this forecasting tool, which is currently in development as a user-friendly desktop application.

Our forecast tool provides managers with lead time for decision making and allows flexibility based on management objectives. Through trial, error, success, and feedback, these tools will continue to improve as new knowledge and feedback are received.

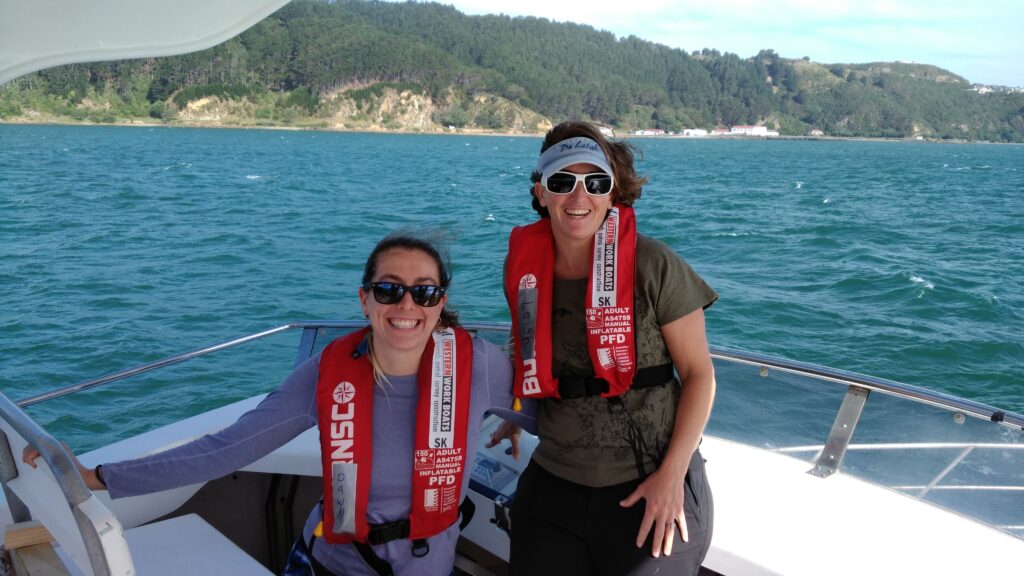
The people behind the science, from data collection to conservation application. Left: Dawn Barlow and Dr. Leigh Torres aboard a research vessel in New Zealand in 2017, collecting data on blue whale distribution patterns that contributed to the findings in this study. Right: Dr. Leigh Torres and Dawn Barlow at the Parliament buildings in Wellington, New Zealand, where they discussed research findings with politicians and managers, gathered feedback on barriers to implementation, and subsequently incorporated feedback into the development and implementation of the forecasting tools.

Reference: Barlow, D. R., & Torres, L. G. (2021). Planning ahead: Dynamic models forecast blue whale distribution with applications for spatial management. Journal of Applied Ecology, 00, 1–12. https://doi.org/10.1111/1365-2664.13992

This post was written for The Applied Ecologist Blog and the Geospatial Ecology of Marine Megafauna Lab Blog

Fashionably late: New GEMM Lab publication measures lags between wind, upwelling, and blue whale occurrence

By Dawn Barlow, PhD Candidate, OSU Department of Fisheries and Wildlife, Geospatial Ecology of Marine Megafauna Lab

To understand the complex dynamics of an ecosystem, we need to examine how physical forcing drives biological response, and how organisms interact with their environment and one another. The largest animal on the planet relies on the wind. Throughout the world, blue whales feed areas where winds bring cold water to the surface and spur productivity—a process known as upwelling. In New Zealand’s South Taranaki Bight region (STB), westerly winds instigate a plume of cold, nutrient-rich waters that support aggregations of krill, and ultimately lead to foraging opportunities for blue whales. This pathway, beginning with wind input and culminating in blue whale occurrence, does not take place instantaneously, however. Along each link in this chain of events, there is some lag time.

Figure 1. A blue whale comes up for air in New Zealand’s South Taranaki Bight. Photo: L. Torres.

Our recent paper published in Scientific Reports examines the lags between wind, upwelling, and blue whale occurrence patterns. While marine ecologists have long acknowledged that lag plays a role in what drives species distribution patterns, lags are rarely measured, tested, and incorporated into studies of marine predators such as whales. Understanding lags has the potential to greatly improve our ability to predict when and where animals will be under variable environmental conditions. In our study, we used timeseries analysis to quantify lag between different metrics (wind speed, sea surface temperature, blue whale vocalizations) at different locations. While our methods are developed and implemented for the STB ecosystem, they are transferable to other upwelling systems to inform, assess, and improve predictions of marine predator distributions by incorporating lag into our understanding of dynamic marine ecosystems.

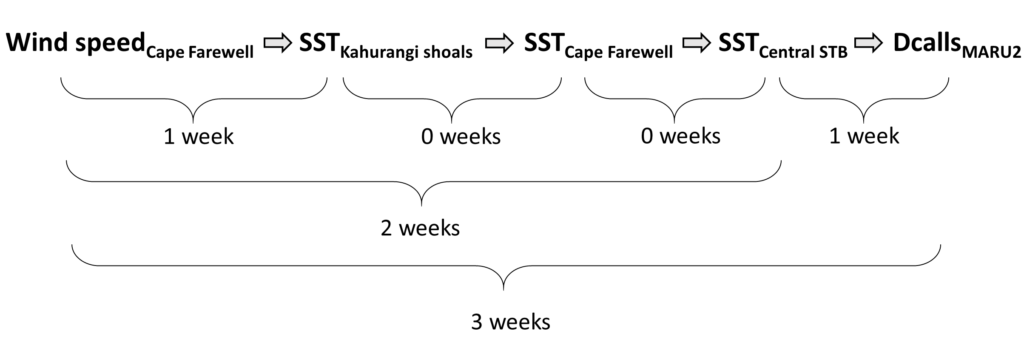
So, what did we find? It all starts with the wind. Wind instigates upwelling over an area off the northwest coast of the South Island of New Zealand called Kahurangi Shoals. This wind forcing spurs upwelling, leading to the formation of a cold water plume that propagates into the STB region, between the North and South Islands, with a lag of 1-2 weeks. Finally, we measured the density of blue whale vocalizations—sounds known as D calls, which are produced in a social context, and associated with foraging behavior—recorded at a hydrophone downstream along the upwelling plume’s path. D call density increased 3 weeks after increased wind speeds near the upwelling source. Furthermore, we looked at the lag time between wind events and aggregations in blue whale sightings. Blue whale aggregations followed wind events with a mean lag of 2.09 ± 0.43 weeks, which fits within our findings from the timeseries analysis. However, lag time between wind and whales is variable. Sometimes it takes many weeks following a wind event for an aggregation to form, other times mere days. The variability in lag can be explained by the amount of prior wind input in the system. If it has recently been windy, the water column is more likely to already be well-mixed and productive, and so whale aggregations will follow wind events with a shorter lag time than if there has been a long period without wind and the water column is stratified.

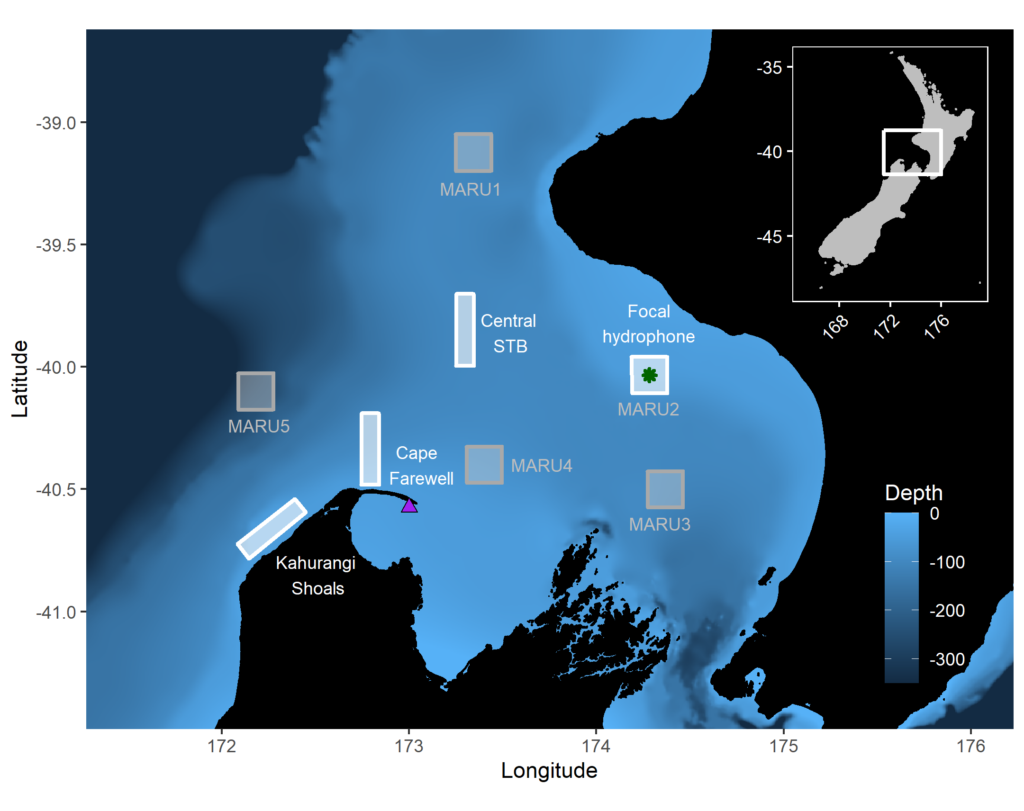
Figure 2. Top panel: Map of the study region within the South Taranaki Bight (STB) of New Zealand, with location denoted by the white rectangle on inset map in the upper right panel. All spatial sampling locations for sea surface temperature implemented in our timeseries analyses are denoted by the boxes, with the four focal boxes shown in white that represent the typical path of the upwelling plume originating off Kahurangi shoals and moving north and east into the STB. The purple triangle represents the Farewell Spit weather station where wind measurements were acquired. The location of the focal hydrophone (MARU2) where blue whale D calls were recorded is shown by the green star. (Reproduced from Barlow et al. 2021). Bottom panel: Results of the timeseries cross-correlation analyses, illustrating the lag between some of the metrics and locations examined.

This publication forms the second chapter of my PhD dissertation. However, in reality it is the culmination of a team effort. Just as whale aggregations lag wind events, publications lag years of hard work. The GEMM Lab has been studying New Zealand blue whales since Leigh first hypothesized that the STB was an undocumented foraging ground in 2013. I was fortunate enough to join the research effort in 2016, first as a Masters student and now as a PhD Candidate. I remember standing on the flying bridge of R/V Star Keys in New Zealand in 2017, when early in our field season we saw very few blue whales. Leigh and I were discussing this, with some frustration. Exclamations of “This is cold, upwelled water! Where are the whales?!” were followed by musings of “There must be a lag… It has to take some time for the whales to respond.” In summer 2019, Christina Garvey came to the GEMM Lab as an intern through the NSF Research Experience for Undergraduates program. She did an outstanding job of wrangling remote sensing and blue whale sighting data, and together we took on learning and understanding timeseries analysis to quantify lag. In a meeting with my PhD committee last spring where I presented preliminary results, Holger Klinck chimed in with “These results are interesting, but why haven’t you incorporated the acoustic data? That is a whale timeseries right there and would really add to your analysis”. Dimitri Ponirakis expertly computed the detection area of our hydrophone so we could adequately estimate the density of blue whale calls. Piecing everything together, and with advice and feedback from my PhD committee and many others, we now have a compelling and quantitative understanding of the upwelling dynamics in the STB ecosystem, and have thoroughly described the pathway from wind to whales in the region.

Figure 3. Dawn and Leigh on the flying bridge of R/V Star Keys on a windy day in New Zealand during the 2017 field season. Photo: T. Chandler.

Our findings are exciting, and perhaps even more exciting are the implications. Understanding the typical patterns that follow a wind event and how the upwelling plume propagates enables us to anticipate what will happen one, two, or up to three weeks in the future based on current conditions. These spatial and temporal lags between wind, upwelling, productivity, and blue whale foraging opportunities can be harnessed to generate informed forecasts of blue whale distribution in the region. I am thrilled to see this work in print, and equally thrilled to build on these findings to predict blue whale occurrence patterns.

Reference: Barlow, D.R., Klinck, H., Ponirakis, D., Garvey, C., Torres, L.G. Temporal and spatial lags between wind, coastal upwelling, and blue whale occurrence. Sci Rep 11, 6915 (2021). https://doi.org/10.1038/s41598-021-86403-y

Snacks at the surface: New GEMM Lab publication reveals insights into blue whale surface foraging through drone observations and prey data

By Dawn Barlow, PhD student, OSU Department of Fisheries and Wildlife, Geospatial Ecology of Marine Megafauna Lab

As the largest animals on the planet, blue whales have massive prey requirements to meet energy demands. Despite their enormity, blue whales feed on a tiny but energy-rich prey source: krill. Furthermore, they are air-breathing mammals searching for aggregations of prey in the expansive and deep ocean, and must therefore budget breath-holding and oxygen consumption, the travel time it takes to reach prey patches at depth, the physiological constraints of diving, and the necessary recuperation time at the surface. Additionally, blue whales employ an energetically demanding foraging strategy known as lunge feeding, which is only efficient if they can locate and target dense prey aggregations that compensate for the energetic costs of diving and lunging. In our recent paper, published today in PeerJ, we examine how blue whales in New Zealand optimize their energy use through preferentially feeding on dense krill aggregations near the water’s surface.

Figure 1. A blue whale lunges on a dense aggregation of krill at the surface. Note the krill jumping away from the mouth of the onrushing whale. UAS piloted by Todd Chandler.
Figure 2. Survey tracklines in 2017 in the South Taranaki Bight (STB) with locations of blue whale sightings, and where surface lunge feeding was observed, denoted. Inset map shows location of the STB within New Zealand. Figure reprinted from Torres et al. 2020.

To understand how predators such as blue whales optimize foraging strategies, knowledge of predator behavior and prey distribution is needed. In 2017, we surveyed for blue whales in New Zealand’s South Taranaki Bight region (STB, Fig. 2) while simultaneously collecting prey distribution data using an echosounder, which allowed us to identify the location, depth, and density of krill aggregations throughout the region. When blue whales were located, we observed their behavior from the research vessel, recorded their dive times, and used an unmanned aerial system (UAS; “drone”) to assess their body condition and behavior.

Much of what is known about blue whale foraging behavior and energetics comes from extensive studies off the coast of California, USA using accelerometer tags to track fine-scale kinematics (i.e., body movements) of the whales. In the California Current, the krill species targeted by blue whales are denser at depth, and therefore blue whales regularly dive to depths of 300 meters to lunge on the most energy-rich prey aggregations. However, given the reduced energetic costs of feeding closer to the surface, optimal foraging theory predicts that blue whales should only forage at depth when the energetic gain outweighs the cost. In New Zealand, we found that blue whales foraged where krill aggregations were relatively shallow and dense compared to the availability of krill across the whole study area (Fig. 3). Their dive times were quite short (~2.5 minutes, compared to ~10 minutes in California), and became even shorter in locations where foraging behavior and surface lunge feeding were observed.

Figure 3. Density contours comparing the depth and density (Sv) of krill aggregations at blue whale foraging sightings (red shading) and in absence of blue whales (gray shading). Density contours: 25% = darkest shade, 755 = medium shade, 95% = light shade. Blue circles indicate krill aggregations detected within 2 km of the sighting of the UAS filmed surface foraging whale analyzed in this study. Figure reprinted from Torres et al. 2020.
Figure 4. Kinematics of a blue whale foraging dive derived from a suction cup tag. Upper panel shows the dive profile (yellow line), with lunges highlighted (green circles), superimposed on a prey field map showing qualitative changes in krill density (white, low; blue, medium; red, high). The lower panels show the detailed kinematics during lunges at depth. Here, the dive profile is shown by a black line. The orange line shows fluking strokes derived from the accelerometer data, the green line represents speed estimated from flow noise, and the grey circles indicate the speed calculated from the vertical velocity of the body divided by the sine of the body pitch angle, which is shown by the red line. Figure and caption reprinted from Goldbogen et al. 2011.

Describing whale foraging behavior and prey in the surface waters has been difficult due to logistical limitations of conventional data collection methods, such as challenges inferring surface behavior from tag data and quantifying echosounder backscatter data in surface waters. To compliment these existing methods and fill the knowledge gap surrounding surface behavior, we highlight the utility of a different technological tool: UAS. By analyzing video footage of a surface lunge feeding sequence, we obtained estimates of the whale’s speed, acceleration, roll angle, and head inclination, producing a figure comparable to what is typically obtained from accelerometer tag data (Fig. 4, Fig. 5). Furthermore, the aerial perspective provided by the UAS provides an unprecedented look at predator-prey interactions between blue whales and krill. As the whale approaches the krill patch, she first observes the patch with her right eye, then turns and lines up her attack angle to engulf almost the entire prey patch through her lunge. Furthermore, we can pinpoint the moment when the krill recognize the impending danger of the oncoming predator—at a distance of 2 meters, and 0.8 seconds before the whale strikes the patch, the krill show a flee response where they leap away from the whale’s mouth (see video, below).

Figure 5. Body kinematics during blue whale surface lunge feeding event derived from Unmanned Aerial Systems (UAS) image analysis. (A) Mean head inclination and roll (with CV in shaded areas), (B) relative speed and acceleration, and (C) distance from the tip of the whale’s rostrum to the nearest edge of krill patch. Blue line on plots indicate when krill first respond to the predation event, and the purple dashed lines indicate strike at time = 0. The orange lines indicate the time at which the whale’s gape is widest, head inclination is maximum, and deceleration is greatest. Figure reprinted from Torres et al. 2020

In this study, we demonstrate that surface waters provide important foraging opportunities and play a key role in the ecology of New Zealand blue whales. The use of UAS technology could be a valuable and complimentary tool to other technological approaches, such as tagging, to gain a comprehensive understanding of foraging behavior in whales.

To see the spectacle of a blue whale surface lunge feeding, we invite you to take a look at the video footage, below:

The publication is led by GEMM Lab Principal Investigator Dr. Leigh Torres. I led the prey data analysis portion of the study, and co-authors include our drone pilot extraordinaire Todd Chandler and UAS analysis guru Dr. Jonathan Burnett. We are grateful to all who assisted with fieldwork and data collection, including Kristin Hodge, Callum Lilley, Mike Ogle, and the crew of the R/V Star Keys (Western Workboats, Ltd.). Funding for this research was provided by The Aotearoa Foundation, The New Zealand Department of Conservation, The Marine Mammal Institute at Oregon State University, Greenpeace New Zealand, OceanCare, Kiwis Against Seabed Mining, The International Fund for Animal Welfare, and The Thorpe Foundation.

Read Oregon State University’s press release about the publication here.

Looking Back: Three Years After Grad School

By Courtney Hann (NOAA Fisheries, West Coast Sustainable Fisheries Division)

Thinking back, as Leigh’s first M.Sc. student for the GEMM Lab, I wonder what poignant insight could have prepared me for my future endeavors. And having faced years of perseverance and dedication in the face of professional unknowns, perhaps the answer is none at all; fore maybe it was the many unknown challenges met that led me to where I am today.

I graduated in December of 2015, with my Masters in Marine Resource Management, and stamped completion of my research with the GEMM Lab. While my research focused on marine mammals, my broader love for the Earth’s oceans and lands guided my determination to help keep our planet’s precious ecosystem resources wild and free. So when I landed a position in terrestrial ecology after graduating, I chose to embrace the challenging decision of jumping away from theoretical research and moving back towards applied research. Consequently, I fell in love with botany, moth identification, birding, and explored the unknowns of a whole new world of conservation biology in Scotland with the Royal Society for the Protection of Birds. Not only was this work incredibly fun, interesting, and spontaneous, it offered me an opportunity to take my knowledge of developing research projects and apply it to nature reserve management. Every survey I completed and dataset I analyzed provided information required to determine the next land management steps for maximizing the conservation of rare and diverse species. From the GEMM Lab, I brought skills on: how to work through what, at times, seemed like an impassible barrier, complete tasks efficiently under a tight deadline, juggle multiple activities and obligations, and still make time to ponder the importance of seeing the bigger picture, while having fun learning new things.

Above: Botanizing and birding in Scotland with the best botanist I have ever known and my boss, Jeff Waddell, with the Royal Society for the Protection of Birds.

For me, the long game of seeing the bigger picture has always been key. And at the end of the day, I remained steadfast in answering the questioned I posed myself: Why do all of this work if not to make a truly positive impact? With that in mind, and with an expiring visa, I moved back to the West Coast of the U.S. and landed a contracting position with NOAA Fisheries. Where I met my second female mentor, Heidi Taylor, who inspired me beyond words and introduced me to the amazing world of fisheries management. All the while, I kept working my second part-time job with the West Coast Regional Planning Body (now called the West Coast Ocean Alliance, WCOA). Working two jobs allowed me to not only accelerate my learning capacity through more opportunities, but also allowed me to extend the reach of growing a positive impact.  For example, I learned about coordinating region-wide ocean management, facilitation of diverse groups, and working with tribes, states, and federal agencies while working for the WCOA. While there were moments that I struggled with overworking and fatigue, my training in graduate school to persevere really kicked in. Driven by the desire to attain a permanent position that complimented my talents and determination to provide sustained help for our Earth’s ecosystems, I worked for what sometimes felt endlessly to reach my goal. Getting there was tough, but well worth it!

One of the most challenging aspects for me was finishing my last publication for the GEMM Lab. I was no longer motivated by the research, since my career path had taken a different turn, and I was already burnt out form working overtime every week. Therefore, if it was not for Leigh’s encouraging words, the promise I made to her to complete the publication, and my other co-author’s invitation to submit a paper for a particular journal, then I likely would have thrown in the towel. I had to re-do the analysis several times, had the paper rejected once, and then ended up re-writing and re-structuring the entire paper for the final publication. In total, it took me two and half years and 100s of hours to complete this paper after graduating. Of course, there was no funding, so I felt a bit like an ongoing graduate student until the paper was finally accepted and the work complete. But the final acceptance of the paper was so sweet, and after years of uncertain challenges, a heavy weight had finally been lifted. So perhaps, if there is one piece of advice I would say to young graduate students, it is to get your work published before you graduate! I had one paper and one book chapter published before I graduated, and that made my life much easier. While I am proud for finishing the final third publication, I would have much preferred to have just taken one extra semester and finished that publication while in school. But regardless, it was completed. And in a catharsis moment, maybe the challenge of completing it taught me the determination I needed to persevere through difficult situations.

Above: Elephant seal expressing my joy of finishing that last publication! Wooohoooooo!

With that publication out of the way, I was able to focus more time on my career. While I no longer use R on a daily basis and do not miss the hours of searching for that one pesky bug, I do analyze, critique, and use scientific literature everyday. Moreover, the critical thinking, creative, and collaborative skills I honed in the GEMM Lab, have been and will be useful for the rest of my life. Those hours of working through complicated statistical analyses and results in Leigh’s office pay off everyday. Reading outside of work, volunteering and working second jobs, all of this I learned from graduate school. Carrying this motivation, hard work, determination, and perseverance on past graduate school was undeniably what led me to where I am today. I have landed my dream job, working for NOAA Fisheries Sustainable Fisheries Division on salmon management and policy, in my dream location, the Pacific Northwest.  My work now ties directly into ongoing management and policy that shapes our oceans, conservation efforts, and fisheries management. I am grateful for all the people who have supported me along the way, with this blog post focusing on the GEMM Lab and Leigh Torres as my advisor. I hope to be a mentor and guide for others along their path, as so many have helped me along mine. Good luck to any grad student reading this now! But more than luck, carry passion and determination forward because that is what will propel you onward on your own path. Thank you GEMM Lab, it is now time for me to enjoy my new job.

Above: Enjoying in my new home in the Pacific Northwest.


Scientific publishing: Impact factor, open access and citations

By Leila Lemos1 and Rachel Ann Hauser-Davis2

1PhD candidate, Fisheries and Wildlife Department, OSU

2PhD, CESTEH/ENSP/Fiocruz, Rio de Janeiro, Brazil

Scientific publishing not only communicates new knowledge, but also is a measure of each scientist’s success: the impact each scientist has on his/her field is often measured by his/her number of publications and the reputation of the journals he/she published in. Therefore, publishing in reputable journals, with a high impact factor, is often essential to get a job, promotion and tenure. So, what is an impact factor?

The impact factor (IF) was first created in the 1960’s and is a measure of a journal’s impact on science, as reflected by the yearly average number of citations to recent articles published in that journal. The IF is used to compare the impact of journals within disciplines. Journals with higher impact factors are deemed as more prestigious and of better quality than those with lower ones.

The IF of a journal for any given year is calculated as the number of citations, received in that year, of articles published in that journal during the two preceding years, divided by the total number of articles published in that journal during the two preceding years, as follows:

In recent years, open access (OA) journals have emerged, changing how we perceive publications. However, the role and significance of IF is still present, valuable and used worldwide.

Conventional (non-open access) journals cover publishing costs through access fees, such as subscriptions, site licenses or download charges, which can be paid by universities, research institutions and, sometimes, by individuals. Papers published in OA journals, on the other hand, are distributed online and free of cost. However, there are still publication costs, which are usually paid by the authors. And, open access article processing charges are not cheap, ranging from a few hundred to several thousand dollars, depending on the field (more thoughts on this theme here).

It seems imbalanced that researchers have to pay for their work to be published. They have carried out a study and have obtained results that should be shared with the community. These results should not be treated as a commercial item to be sold. Also, it ends strengthening those who have resources and weakening those who do not have, increasing the division between Northern and Southern hemispheres, and narrowing the knowledge-production system (Burgman 2018).

Thus, a free-of-charge research paper would be interesting for everyone. PeerJ is a good example of a recent OA, free of publishing costs, peer-reviewed, and scholarly journal, that was released in 2013. It’s a totally new model and pushes the boundaries. In addition, there are hybrid journals (i.e., Conservation Biology) that offer both conventional and OA modes, leaving it to the authors to decide what they prefer (Burgman 2018). In many cases, disadvantaged authors might also be able to appeal for waivers. Thus, authors who cannot pay publishing fees might still see their work getting published.

However, this is not how the publishing system typically works. Therefore, researchers need to determine where to publish based on the journal IF and focus/audience, on the different price structures and fees, and whether it is OA or not.

Researchers in general want their articles to be openly accessible for everyone, not just those who can afford to pay the journal for access, so they can increase visibility of their work. Open access can increase the impact/reach of a research paper by facilitating paper downloads, access, and use in other scientific research, which may, in turn, lead to higher citation rate (Eyesenbach 2006).

Higher citation rates would also improve researchers’ H-index: an author-level metric that measures both productivity and citation impact of a scientist or scholar, based on the scientist’s most cited papers and the number of citations that they have received in publications.

The graph below exemplifies the h-index that is based on the maximum value of h such that the given author/journal has published h papers that have each been cited at least h times. In other words, the index is designed to improve with number of publications or citations. The index can only be compared between researchers from same field, as citation conventions might differ widely among different fields.

H-index from a plot of decreasing citations for numbered papers
Source: Wikipedia


However, publishing in an OA journal might easily increase researchers’ H-index and journals’ IF. Many researchers have also considered OA as an “artificial citation enhancer”.

As with any new system, some are opposed to the establishment of the OA system, including researchers, academics, librarians, university administrators, funding agencies, government officials, publishers and editorial staff, among many others (Markin 2017). This opposition claims that OA publishing leads to financial damages to the large publishers worldwide, and, mainly, that this system may damage the peer review system in place today, leading to reduced scientific quality (such as “you pay, you publish” predatory journals that take advantage of the paid system by publishing as fast as possible, without any scientific rigor whatsoever).

However, many reputable journals, such as Elsevier, Springer, Wiley and Blackwell, now offer OA as an option for their established journals. This approach is simply another option for authors, where they may pay if they want for their paper to be available for everyone. Even if this option is available, manuscripts still go through a rigorous peer-review that occurs with both conventional and OA journals. Thus, publishing in OA should be just as rigorous.

Open access papers would be the most “scientifically ethical”, as science is aimed at society, for society, and this type of publishing furthers research reach. However, paying thousands of dollars is sometimes very complicated, as this means less money for fieldwork costs, gears, laboratory analyses, among others.

All in all, OA is a recent development that is changing scientist approach to publication. The future of scientific publication seems uncertain and likely to hold new developments in the near future.


References:

Burgman M. 2018. Open access and academic imperialism. Conservation Biology 0 (0): 1–2. DOI: 10.1111/cobi.13248.

Eysenbach G. 2006. Citation Advantage of Open Access Articles. PLoS Biology 4 (5): e157. doi:10.1371/journal.pbio.0040157. PMC 1459247. PMID 16683865.

Markin P. 2017. The Sustainability of Open Access Publishing Models Past a Tipping Point. Open Science. Retrieved 26 April 2017.

Some advice on how to navigate the scientific publication maze

Dr. Leigh Torres, Geospatial Ecology of Marine Megafauna Lab, Marine Mammal Institute, Oregon State University

Publication of our science in peer-reviewed journals is an extremely important part of our lives as scientists. It’s how we communicate our work, check each other’s work, and improve, develop and grow our scientific fields. So when our manuscript is finally written with great content, we could use some instructions for how to get it through the publication process.  Who gets authorship? How do I respond to reviewers? Who pays for publication costs?

There is some good advice online about manuscript preparation and selecting the right journal. But there is no blueprint for manuscript preparation. That’s because it’s a complicated and variable process to navigate, even when you’ve done it many times. Every paper is different. Every journal has different content and format requirements. And every authorship list is different, with different expectations. As an academic supervisor of many graduate students, and as author on many peer-reviewed papers, I have seen or been a part of more than a few publication blunders, hiccups, road-blocks, and challenges.

Recently I’ve had students puzzle over the nuances of the publication process: “I had no idea that was my role as lead author!”, “How do I tell a reviewer he’s wrong?”, “Who should I recommend as reviewers?” So, I have put together some advice about how to navigate through a few of the more common pitfalls and questions of the scientific publication process. I’m not going to focus on manuscript content, structure, or journal choice – that advice is elsewhere and for authors to evaluate. My intent here is to discuss some of the ‘unwritten’ topics and expectations of the publication process. This guidance and musings are based my 20 years of experience as a scientist trying to navigate the peer-review publication maze myself. I encourage others to add their advice and comments below based on their experiences so that we can engage as a community in an open dialog about these topics, and add transparency to an already difficult and grueling, albeit necessary, process.

Image Credit: Nick at http://www.lab-initio.com/


Authorship: Deciding who should – and shouldn’t be – be a co-author on a paper is often a challenging, sensitive, and angst-filled experience. Broad collaboration is so common and often necessary today that we often see very long author lists on papers. It’s best to be inclusive and recognize contribution where it is deserved, but we also don’t want to be handing out co-authorship as a token of appreciation or just to pad someone’s CV or boost their H-index. Indeed, journals don’t want that, and we don’t want to promote that trend. Sometimes it is more appropriate to recognize someone’s contribution in the acknowledgements section.

The best advice I can give about how to determine authorship is advice that was given to me by my graduate advisor, Dr. Andy Read at Duke University: To deserve authorship the person must have contributed to at least three of these five areas: concept development, acquisition of funding, data collection, data analysis, manuscript writing. Of course, this rule is not hard and fast, and thoughtful judgement and discussions are needed. Often someone has contributed to only one or two of these areas, but in such a significant manner that authorship is warranted.

I have also seen situations where someone has contributed only a small, but important, piece of data. What happens then? My gut feeling is this should be an acknowledgment, especially if it’s been published previously, but sometimes the person is recognized as a co-author to ensure inclusion of the data. Is this right? That’s up to you and your supervisor(s), and is often case-specific. But I do think we need to limit authorship-inflation. Some scientists in this situation will gracefully turn down co-authorship and ask only for acknowledgement, while others will demand co-authorship when it’s not fully deserved. This is the authorship jungle we all must navigate, which does not get easier with time or experience. So, it’s best to just accept the complexity and make the best decisions we can based on the science, not necessarily the scientists.

Next, there is the decision of author order, which can be another challenging decision. A student with the largest role in data collection/analysis and writing, will often be the lead author, especially if the paper is also forming a chapter of his/her thesis. But, if lead authorship is not clear (maybe the student’s work focuses on a small part of a much larger project) then its best to discuss authorship order with co-authors sooner rather than later. The lead author should be the person with the largest role in making the study happen, but often a senior scientist, like an academic supervisor, will have established the project and gained the funding support independent of a student’s involvement. This ‘senior scientist’ role is frequently recognized by being listed last in the authorship list – a trend that has developed in the last ~15 years. Or the senior scientists will be the corresponding author. The order of authors in between the first and last author is often grey, muddled and confusing. To sort this order out, I often think about who else had a major role in the project, and list them near the front end, after the lead author. And then after that, it is usually just based on alphabetical order; you can often see this trend when you look at long author lists.

Responsibility as lead author:  The role of a lead author is to ‘herd the cats’. Unless otherwise specified by co-authors/supervisor, this process includes formatting the manuscript as per journal specifications, correspondence with journal editors (letters to editors and response to reviewer comments), correspondence with co-authors, consideration and integration of all co-author comments and edits into the manuscript, manuscript revisions, staying on time with re-submissions to the journal, finding funding for publication costs, and review of final proofs before publication. Phew! Lots to do. To help you through this process, here are some tips:

How to get edits back from co-authors: When you send out the manuscript for edits/comments, give your co-authors a deadline. This deadline should be at least 2 weeks out, but best to give more time if you can. Schedules are so packed these days. And, say in the email something like, ‘If I don’t hear back from you by such and such a date I’ll assume you are happy with the manuscript as is.” This statement often spurs authors to respond.

How to respond to reviewer comments: Always be polite and grateful, even when you completely disagree with the comment or feel the reviewer has not understood your work. Phrases like “we appreciate the feedback”, “we have considered the comment”, and “the reviewers provided thoughtful criticism” are good ways to show appreciation for reviewer comments, even when it’s followed by a ‘but’ statement. When revising a manuscript, you do not need to incorporate all reviewer comments, but you do need to go through each comment one-by-one and say “yes, thanks for this point. We have now done that,” or thoughtfully explain why you have not accepted the reviewer advice.

While receiving negative criticism about your work is hard, I have found that the advice is often right and helpful in the long run. When I first receive reviewer comments back on a manuscript, especially if it is a rejection – yes, this happens, and it sucks – I usually read through it all. Fume a bit. And then put it aside for a week or so. This gives me time to process and think about the feedback. By the time I come back to it, my emotional response has subsided and I can appreciate the critical comments with objectivity.

Journal formatting can be a nightmare: Some editor may read this post and hate me, but my advice is don’t worry too much about formatting a manuscript perfectly to journal specs. During the initial manuscript submission, reviewers will be assessing content, not how well you match the journal’s formatting. So don’t kill yourself at this stage to get everything perfect, although you should be close. Once your paper gets through the first round of reviews, then you should worry about formatting perfectly in the revision.

Who should I recommend as a reviewer? Editors like it when you make their lives easier by recommending appropriate reviewers for your manuscript. Obviously you should not recommend close friends or colleagues. Giving useful, appropriate reviewer suggestions can be challenging. My best advice for this step is to look at the authors you have referenced in the manuscript. Those authors referenced multiple times may have interest in your work, and be related to the subject matter.

Who pays or how to pay for publication? Discuss this issue with your co-authors/supervisor and plan ahead. Most journals have publication fees that often range between $1000 and $2000. Sometimes color figures cost more. And, if you want your paper to be open access, plan on paying > $3000. So, when deciding on a journal, keep these costs in mind if you are on a limited budget. These days I add at least $2000 to almost every project budget to pay for publication costs. Publication is expensive, which is ridiculous considering we as scientists provide the content, review the content for free, and then often have to pay for the papers once published. But that’s the frustrating, unbalanced racket of scientific publication today – a topic for another time, but this article is definitely worth a read, if interested.

So that’s it from me. Please add your advice, feedback, and thoughts below in the comments section.