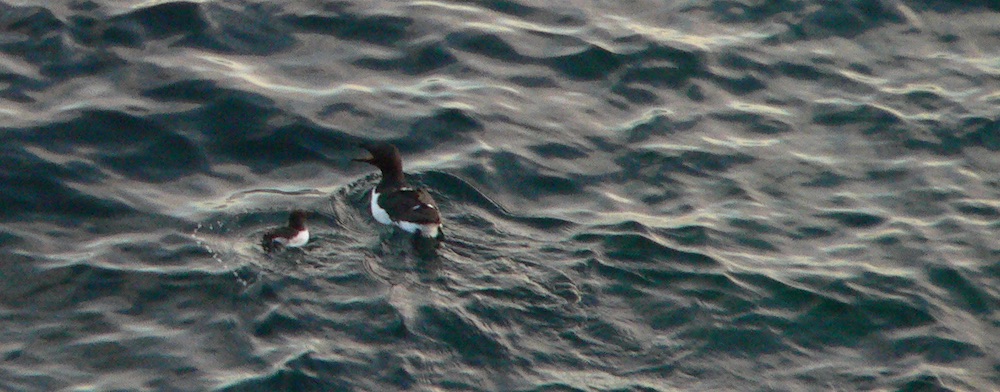
Murre versus Penguin: Happy World Penguin Day!

Rachael Orben PhD, PI Seabird Oceanography Lab

Happy World Penguin Day (officially April 25th)!  I have been contemplating what to write for my tern at the GEMM lab blog. Most of my ideas were a little bit dark, but happily when I loaded my Twitter feed Saturday morning I was greeted with many beautiful photos of penguins and the hashtag #WorldPenguinDay so that inspired something more light hearted.

To be fair, it really should be Alcidae vs. Spheniscidae (scientific family names for auks and penguins). However, I have spent many months in the field studying murres (an alcid), and I find them fascinating. Soon it will be time for them to lay their eggs at colonies along the Oregon coast, including Yaquina Head. Murres have some amazing life history characteristics.

Some of the flamboyant alcid species found in the North Pacific. These species are all crevice or burrow nesters like some penguins including Magellanic, African, and little blue penguins.  

So how do murres stack up against penguins?

At first glance, murres and penguins are fairly similar. They are deep diving seabirds that forage on crustaceans and forage fish. Like murres, penguins have countershading, with black feathers on their backs and white feathers on their front. This coloring is thought to help provide camouflage when they are foraging (Cairns 1986).

There are two species of murres: common murres and thick-billed murres. Both species have a circumpolar distribution in the northern hemisphere with thick-billed murres nesting a colonies in the Arctic and common murres nesting in more temperate latitudes as far south as the central California coast. Their distributions overlap in the subarctic where they often share colonies (Irons et al. 2008).  

Movement

I am under the impression that one of the reasons people love penguins so much is because they waddle. Murres aren’t so graceful either, but they spend much less of their time walking around since they commute between the sea and their colonies by flying. However, murres have to work harder to fly than they do to dive (Elliott et al. 2013). This is because they have high wing-loading. Essentially, they have big bodies and relatively small wings that they use for flying through air and water. Bigger wings would be better for air, but smaller wings are better for moving through water.

Thick-billed murres flying home with fish, St. Paul Island, AK. Photo R. Orben

It really gets interesting when we start comparing the diving ability of alcids and penguins. Murres are the largest alcid species, and as dive depth scales with body size, they can dive the deepest. If we control for body size, alcids dive deeper then penguins (Burger 1991)! For instance, the deepest depth recorded from a thick-billed murres is 210 meters and the deepest dive of the smallest penguin (just a few hundred grams larger then the typical murre at ~1.5 kg), the little blue penguin, is a mere 69 meters (Penguiness.net).

Colonies & Nests

Murres typically nest in colonies on cliffs, off-shore sea stacks, and occasionally low lying predator free islands. Common murres use wider ledges and nest in very close proximity to each other while thick-billed murres prefer narrow ledges. Murres don’t build nests and simply lay their eggs on the rock ledge.
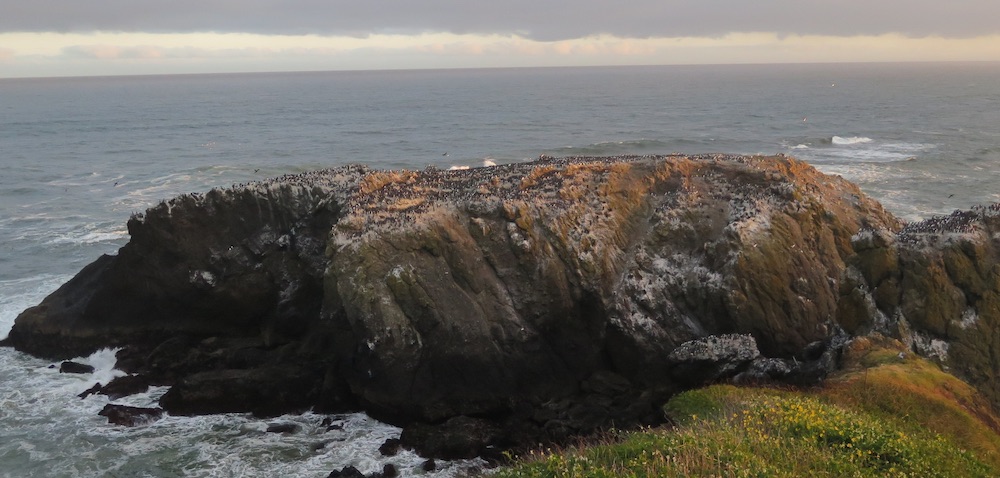
Common murres on Main Colony Rock at Yaquina Head, Newport Oregon. Photo R. Orben

Penguin nesting colonies can take a variety of forms. Colonies of the “brush-tailed” penguins (chinstrap, Adélie and gentoo penguins) are found in places that are snow free for most of the summer. These colonies tend to form as a meandering collection of sub-colonies.  These species build nests out of small rocks that they diligently collect. The rocks help keep their eggs out of snow meltwater. Emperor and king penguins stand together in a group. Burrow nesting penguins like Magellanic penguins can spread their colonies out across large areas where there is suitable habitat for burrowing.
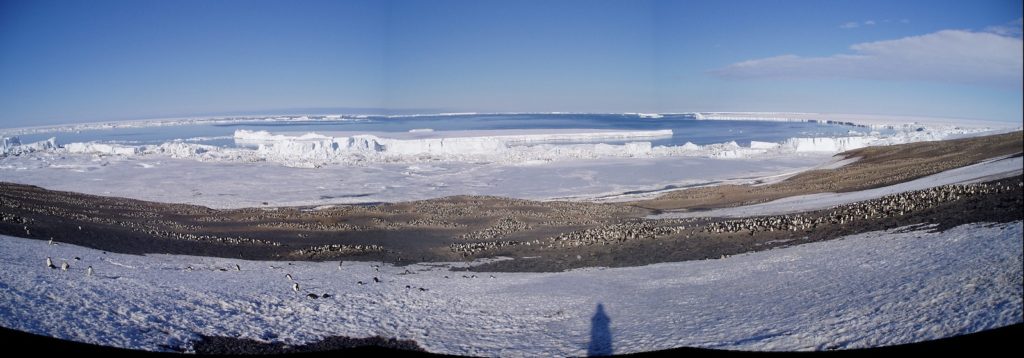
A small portion of the Adélie penguin colony at Cape Crozier, Antarctica. Photo R. Orben

Eggs

Murres lay one large pyriform (pear-shaped) speckled egg that ranges in color from pale cream to brilliant turquoise. This variation allows them to recognize their own eggs (Gaston et al 1993)! The purpose of the shape of murre eggs is something that has been continually puzzled over, but the shape appears to help the blunt end stay cleaner, is stronger, and is more stable on sloping surfaces (Birkhead et al. 2017, 2018).
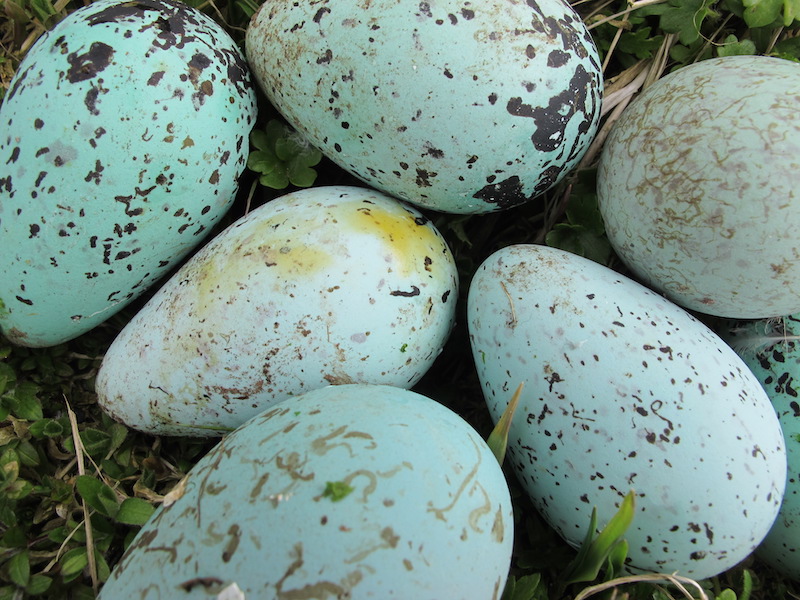
Predated thick-billed murre eggs collected at the top of the cliffs on St. George Island, AK. Photo R. Orben

In comparison, penguin eggs don’t look that remarkable. Many penguin species lay two eggs (e.g. Adélie, chinstrap, rockhopper, gentoo), but king penguins and emperor penguins will just lay one, incubating it on top of their feet. The first egg that macaroni penguins lay is 55-75% smaller than their second egg, potentially due to constraints imposed by migration (Crossin et al. 2010).

Song

Seabirds are not generally known for their melodious songs, but they are still an important part of their social lives. For this comparison I recommend an exploration of the Cornell Lab of Ornithology’s Macaulay Library. Start with the murres and then explore some penguin species. Recently it was discovered that penguins make short noises underwater (Thiebault 2019). Perhaps murres do as well.

If you are interesting a hearing a seabird that can sing, search for Light Mantled Sooty Albatross.

Parent-Offspring Relationship

Murres bring whole fish back to the colony to feed their chick. One fish for each trip. Murre chicks fledge before their flight feathers are fully grown. They jump from the cliffs and glide down to the ocean (hopefully) where they are joined by their male parent. Then the pair paddle out to find good foraging grounds. The male parent needs to feed the growing chick frequently and by bringing the chick to the food is able to meet these demands.

The male parent greets its newly fledged chick. Late evening on St. Paul Island, Alaska. Photo R. Orben

In contrast, penguins regurgitate their stomach contents to feed their offspring. They are able to carry large amounts of food this way. For instance a chinstrap penguin might bring back ~610 grams of food, almost 15% of its body weight (Miller et al. 2010). Adult penguins still have to balance their needs and the demands of their growing chicks. So the adults will leave their chicks alone once they are large enough. The chicks stand in groups known as créches to help protect them against predators like skuas.

Molt

Feather molt is an important part of all birds’ life histories. Feathers don’t last forever and need to be replaced. Both murres and penguins have unique strategies for replacing their feathers. For any flighted bird, replacing primary feathers is especially important. Murres become flightless during molt, which happens in the fall (Birkhead & Taylor 1977). This is actually thought to help their diving as with smaller wings they should be able to fly underwater more easily (Thompson et al. 1998). They replace their body feathers gradually to maintain waterproofing and warmth.

Penguins have solved this problem in another way. Instead of gradually replacing their feathers they undergo a “catastrophic molt” and replace all their feathers at once. Penguins need to be out of the water during this time and will fast, so it is advantageous to quickly grow a new coat of feathers. They too molt after their chicks are fledged.

I will let you decide which seabirds you find most fascinating, because really I find them all amazing and in need of our continued protection.  Thanks for reading!

References

Birkhead TR, Taylor AM (1977) Moult of the Guillemot Uria aalge. Ibis 119:80–85

Birkhead TR, Thompson JE, Jackson D, Biggins JD (2017) The point of a Guillemot’s egg. Ibis 159:255–265

Burger, A. E. (1991). Maximum diving depths and underwater foraging in alcids and penguins. In Studies of High-Latitude Seabirds. 1. Behavioural, Energetic and Oceanographic Aspects of Seabird Feeding Ecology (ed. W. A. Montevecchi and A. J. Gaston), pp. 9-15. Canada: Canadian Wildlife Service Occasional Paper.

Crossin GT, Trathan PN, Phillips RA, Dawson A, Le Bouard F, Williams TD (2010) A Carryover Effect of Migration Underlies Individual Variation in Reproductive Readiness and Extreme Egg Size Dimorphism in Macaroni Penguins. Am Nat 176:357–366

Elliott KH, Ricklefs RE, Gaston AJ, Hatch SA, John R Speakmane F, Davoren GK (2013) High flight costs, but low dive costs, in auks support the biomechanical hypothesis for flightlessness in penguins. PNAS:9380–9384

Irons DB, Anker-Nilssen T, Gaston AJ, Byrd GV, Falk K, Gilchrist G, Hario M, Hjernquist M, Krasnov YV, Mosbech A, Olsen B, Petersen A, Reid JB, Robertson GJ, Strøm H, Wohl KD (2008) Fluctuations in circumpolar seabird populations linked to climate oscillations. Global Change Biology 14:1455–1463

Miller AK, Kappes MA, Trivelpiece SG, Trivelpiece WZ (2010) Foraging-Niche Separation of Breeding Gentoo and Chinstrap Penguins, South Shetland Islands, Antarctica. The Condor 112:683–695

Thiebault A (2019) First evidence of underwater vocalizations in hunting penguins. PeerJ:1–16

Thompson CW, Wilson ML, Melvin EF, Pierce DJ (1998) An unusual sequence of flight-feather molt in Common Murres and its evolutionary implications. The Auk 115:653–669

Remote Sensing Applications

By Leila Lemos, PhD candidate

Fisheries and Wildlife Department, OSU


I am finally starting my 3rd and last year of my PhD. Just a year left and yet so many things to do. As per department requirements, I still need to take some class credits, but what classes could I take? In this short amount of time it is important to focus on my research project and on what could help me better understand the many branches of the project and what could improve my analyses. Thinking of that, both my advisor (Dr. Leigh G. Torres) and I agreed that it would be useful for me to take a class on remote sensing. So, I could learn more about this field, as well as try to include some remote sensing analyses in my project, such as sea surface temperature (SST) and chlorophyll (i.e., as a productivity indicator) conditions over the years we have collected data on gray whales off the Oregon coast.


Our photogrammetry data indicates that whales gradually increased their body condition over the feeding seasons of 2016 and 2018, while 2017 is different. Whales were still looking skinny in the middle of the season, and we were not collecting many fecal samples up to that point (indicating not much feeding). These findings made us wonder if this was related to delayed seasonal upwelling events and consequently low prey availability. These questions are what motivated me the most to join this class so that we might be able to link environmental correlates with our observations of gray whale body condition.

Figure 01: Skinny body condition state of the gray whale “Pancake” in August 2017.
Source: Leila S. Lemos


If we stop to think about what remote sensing is, we have already been implementing this method in our project since the beginning, as my favorite definition for remote sensing is “the art of collecting information of objects or phenomenon without touching it”. So, yes, the drone is a type of sensor that remotely collects information of objects (in this case, whales).

Figure 02: Drone remotely collecting information of a whale in September 2018. Drone in detail. Collected under NOAA/NMFS permit #16111.
Source: Leila Lemos


However, satellites, all the way up in the space, are also remotely sensing the Earth and its objects and phenomena. Even from thousands of km above Earth, these sensors are capable of generating a great amount of detailed data that is easily and freely accessible (i.e., NASA, NOAA), and can be used for multiple applications in different fields of study. Satellites are also able to collect data from remote areas like the Antarctica and the Arctic, as well as other areas that are not easily reached by humans. One important application of the use of satellite imagery is wildlife monitoring.

For example, satellite data was used to detect variation in the abundance of Weddell seals (Leptonychotes weddellii) in Erebus Bay, Antarctica (LaRue et al., 2011). Because this is a well-studied seal population, the object of this study was to test if satellite imagery could produce reliable abundance estimates. The authors used high-resolution (0.6 m) satellite imagery (from satellites Quick-Bird-2 and WorldView-1) to compare counts from the ground with counts from satellite images in the same locations at the same time. This study demonstrated a reliable methodology for further studies to replicate.

Figure 03: WorldView-1 image (0.6 m resolution) of Weddell seals hauled out east of Inaccessible Island, Erebus Bay, Antarctica.
Source: LaRue et al. (2011).


Satellite imagery was also applied to estimate colony sizes of Adélie penguins in Antarctica (LaRue et al., 2014). High-resolution (0.6 m) satellite imagery combined with spectral analysiswas used to estimate the sizes of the penguin breeding colonies. Ground counts were also used in order to check the reliability of the applied method. The authors then created a model to predict the abundance of breeding pairs as a function of the habitat, which was identified terrain slope as an important component of nesting density.

The identification of whales using satellite imagery is also possible. Fretwell et al. (2014)pioneered this method by successfully identifing Southern Right Whales (Eubalaena australis) in the Golfo Nuevo, Península Valdés, in Argentina in satellite images. By using very high-resolution satellite imagery (50 cm resolution) and a water penetrating coastal band that was able to see deeper into the water column, the researchers were able to successfully identify and count the whales (Fig. 04). The importance of this study was very significant, since this species was extensively hunted from the 17ththrough to the 20thcentury. Since then, the species has shown a strong recovery, but population estimates are still at <15% of historical estimates. Thus, being able to use new tools to identify, count and monitor individuals in this recovering population is a great development, especially in remote and hard to reach areas.

Figure 04: Identification of Southern Right Whales by using imagery from the WorldView2 satellite in the Golfo Nuevo Bay, Península Valdés, Argentina.
Source: Fretwell et al. (2014).


Polar bears (Ursus maritimus) have also been studied in the Foxe Basin, in Nunavut and Quebec, Canada (LaRue et al., 2015). Researchers used high-resolution satellite imagery in an attempt to identify and count the bears, but spectral signature differences between bears and other objects were insufficient to yield useful results. Therefore, researchers developed an automated image differencing, also known as change detection, that identifies differences between remotely sensed images collected at different times and “subtract of one image from another”. This method correctly identified nearly 90% of the bears. The technique also generated false positives, but this problem can be corrected by a manual review.

Figure 05 shows the difference in resolution of two types of satellite imagery, the panchromatic (0.6 m resolution) and the multispectral (2.4 m resolution). LaRue et al. (2015)decided not to use the multispectral imagery due to resolution constraints.

Figure 05: Polar Bears on panchromatic (0.6 m resolution) and multispectral (2.4 m resolution) imagery.
Source: LaRue et al. (2015).


A more recent study is being conducted by my fellow OSU Fisheries and Wildlife graduate student, Jane Dolliveron breeding colonies of three species of North Pacific albatrosses (Phoebastria immutabilis, Phoebastria nigripes, and Phoebastria albatrus)(Dolliver et al., 2017). Jane is using high-resolution multispectral satellite imagery (DigitalGlobe WorldView-2 and -3) and image processing techniques to enumerate the albatrosses. They are also using albatross species at multiple reference colonies in Hawaii and Japan (Fig. 06) to determine species identification accuracy and required correction factor(s). This will allow scientists to accurately count unknown populations on the Senkakus, which are uninhabited islands controlled by Japan in the East China Sea.

Figure 06: Satellite image of a colony of short-tailed albatrosses (Phoebastria albatrus) in Torishima, Japan, 2016.
Source: Satellite image provided by Jane Dolliver.


Using satellite imagery to count seals, penguins, whales, bears and albatrosses is just the start of this rapidly advancing technology. Techniques and resolutions are continuously improving. Methods can also be applied to many other endangered species, especially in remote areas, providing data on presence, abundance, annual productivity, population estimates and trends, changes in distribution, and breeding ground usage.

Other than directly monitoring wildlife, satellite images can also provide information on the environmental variables that can be related to wildlife presence, abundance, productivity and distribution.

Gentemann et al. (2017), for example, used satellite data from NASA to analyze SST variations along the west coast of the United States from 2002 to 2016. The NASA Jet Propulsion Laboratory produces global, daily, 1 km, multiscale ultra-high resolution, motion-compensated analysis of SST, and incorporates SSTs from eight different satellites. Researchers were able to identify warmer than usual SSTs (also called anomalies) along the Washington, Oregon, and California coasts from January 2014 to August 2016 (Fig.07) relative to previous years. This marine heat wave started in the Gulf of Alaska and ended in Southern California, where SST reached a maximum temperature anomaly of 6.2°C, causing major disturbances and substantial economic impacts.

Figure 07: Monthly SST anomalies in the West Coast of United States, from January 2014 to August 2016.
Source: Gentemann et al. (2017).


Changes in SST and winds may alter events such as the coastal upwelling that supplies nutrients to sustain a whole food chain. A marine heat-wave event as described by Gentemann et al. (2017)could have significant impacts on the health of the marine ecosystem in the subsequent season (Gentemann et al., 2017).

These findings may even relate to our questions regarding the poor gray whale body condition we noticed in 2017: this marine heat wave that lasted until August 2016 along the US west coast could have impacted the ecosystem in the subsequent season. However, I must conduct a more detailed study to determine if this heat wave was related or if another oceanographic process was involved.

So, whether remotely sensed data is generated by satellites, drones, thermal imagery, robots (as I previously wrote about), or another type of technology, it can have important  and informative applications to monitor wildlife or environmental variables associated with their ecology and biology. We can take advantage of remotely sensed technology to aid wildlife conservation efforts.


References

Dolliver, J., et al., Multispectral processing of high resolution satellite imagery to determine the abundance of nesting albatross. Ecological Society of America, Portland, OR, United States., 2017.

Fretwell, P. T., et al., 2014. Whales from Space: Counting Southern Right Whales by Satellite. Plos One. 9,e88655.

Gentemann, C. L., et al., 2017. Satellite sea surface temperatures along the West Coast of the United States during the 2014–2016 northeast Pacific marine heat wave. Geophysical Research Letters. 44,312-319.

LaRue, M. A., et al., 2014. A method for estimating colony sizes of Adélie penguins using remote sensing imagery. Polar Biology. 37,507-517.

LaRue, M. A., et al., 2011. Satellite imagery can be used to detect variation in abundance of Weddell seals (Leptonychotes weddellii) in Erebus Bay, Antarctica. Polar Biology. 34,1727–1737.

LaRue, M. A., et al., 2015. Testing Methods for Using High-Resolution Satellite Imagery to Monitor Polar Bear Abundance and Distribution. Wildlife Society Bulletin. 39,772-779.


Understanding How Nature Works

By: Erin Pickett, MS student, Oregon State University

They were climbing on their hands and knees along a high, narrow ridge that was in places only two inches wide. The path, if you could call it that, was layered with sand and loose stones that shifted whenever touched. Down to the left was a steep cliff encrusted with ice that glinted when the sun broke down through the thick clouds. The view to the right, with a 1,000ft drop, wasn’t much better.

The Invention of Nature by Andrea Wulf

This is a description of Alexander von Humboldt and the two men that accompanied him when attempting to summit Chimborazo, which in 1802 was believed to be the highest mountain in the world. The trio was thwarted about 1,000 ft from the top of the peak by an impassable crevice but set a record for the highest any European had ever climbed. This was a scientific expedition. With them the men brought handfuls of scientific instruments and Humboldt identified and recorded every plant and animal species along the way. Humboldt was an explorer, a naturalist, and an observer of everything. He possessed a memory that allowed him to recount details of nature that he had observed on a mountain in Asia, and find patterns and connections between that mountain and another in South America. His perspective of nature as being interconnected, and theories as to why and how this was so, led to him being called the father of Ecology. In less grandeur terms, Humboldt was a biodiversity explainer.

Humboldt sketched detailed images like this one of Chimborazo, which allowed him to map vegetation and climate zones and identify how these and other patterns and processes were related. Source: http://www.mappingthenation.com/blog/alexander-von-humboldt-master-of-infographics/

In a recent guest post on Carbon Brief, University of Connecticut Professor Mark Urban summarized one of his latest publications in the journal Science, and called on scientists to progress from biodiversity explainers to biodiversity forecasters.  Today, as global biodiversity is threatened by climate change, one of our greatest scientific problems has become accurately forecasting the responses of species and ecosystems to climate change. Earlier this month, Urban and his colleagues published a review paper in Science titled “Improving the forecast for biodiversity under climate change”. Many of our current models aimed at predicting species responses to climate change, the authors noted, are missing crucial data that hamper the accuracy and thus the predictive capabilities of these models. What does this mean exactly?

Say we are interested in determining whether current protected areas will continue to benefit the species that exist inside their boundaries over the next century. To do this, we gather basic information about these species: what habitat do they live in, and where will this habitat be located in 100 years? We tally up the number of species currently inhabiting these protected areas, figure out the number of species that will relocate as their preferred habitat shifts (e.g. poleward, or higher in elevation) and then we subtract those species from our count of those who currently exist within the boundaries of this protected area. Voilà, we can now predict that we will lose up to 20% of the species within these protected areas over the next 100 years*.  Now we report our findings to the land managers and environmental groups tasked with conserving these species and we conclude that these protected areas will not be sufficient and they must do more to protect these species. Simple right? It never is.

This predication, like many others, was based on a correlation between these species ranges and climate. So what are we missing? In their review, Urban et al. outline six key factors that are commonly left out of predictive models, and these are: species interactions, dispersal, demography, physiology, evolution and environment (specifically, environment at appropriate spatiotemporal scales) (Figure 1). In fact, they found that more than 75% of models aimed at predicting biological responses to climate change left out these important biological mechanisms. Since my master’s project is centered on species interactions, I will now provide you with a little more information about why this specific mechanism is important, and what we might have overlooked by not including species interactions in the protected area example above.

Figure 1: Six critical biological mechanisms missing from current biodiversity forecasts. Source: Urban et al. 2016

I study Adelie and gentoo penguins, two congeneric penguin species whose breeding ranges overlap in a few locations along the Western Antarctic Peninsula. You can read more about my research in previous blog posts like this one. Similar to many other species around the world, both of these penguins are experiencing poleward range shifts due to atmospheric warming. The range of the gentoo penguin is expanding farther south than ever before, while the number of Adelie penguins in these areas is declining rapidly (Figure 2). A correlative model might predict that Adelie penguin populations will continue to decline due to rising temperatures, while gentoo populations will increase. This model doesn’t exactly inform us of the underlying mechanisms behind what we are observing. Are these trends due to habitat shifts? Declines in key prey species? Interspecific competition? If Adelie populations are declining due to increased competition with other krill predators (e.g. gentoo penguins), then any modelling we do to predict future Adelie population trends will certainly need to include this aspect of species interaction.

Figure 2. A subset of the overall range of Adelie and gentoo penguins and their population trends at my study site at Palmer Station 1975-2014. Source: https://www.allaboutbirds.org/on-the-antarctic-peninsula-scientists-witness-a-penguin-revolution/

Range expansion can result in novel or altered species interactions, which ultimately can affect entire ecosystems. Our prediction above that 20% of species within protected areas will be lost due to habitat shifts does not take species interactions into account. While some species may move out of these areas, others may move in. These new species may potentially outcompete those who remain, resulting in a net loss of species larger than originally predicted. Urban et al. outline the type of data needed to improve the accuracy of predictive models. They openly recognize the difficulties of such a task but liken it to the successful, collective effort of climate scientists over the past four decades to improve the predictive capabilities of climate forecasts.

As a passionate naturalist and philosopher, there is no doubt Humboldt would agree with Urban et al.’s conclusion that “ultimately, understanding how nature works will provide innumerable benefits for long-term sustainability and human well-being”. I encourage you to read the review article yourself if you’re interested in more details on Urban et al.’s views of a ‘practical way forward’ in the field of biodiversity forecasting. For a historical and perhaps more romantic account of the study of biodiversity, check out Andrea Wulf’s biography of Alexander von Humboldt, called The Invention of Nature.

 *This is an oversimplified example based off of a study on biodiversity and climate change in U.S. National parks (Burns et al. 2003)

References:

Burns, C. E., Johnston, K. M., & Schmitz, O. J. (2003). Global climate change and mammalian species diversity in US national parks. Proceedings of the National Academy of Sciences100(20), 11474-11477.

Urban, M. 14 September 2016. Carbon Brief. Guest post: How data is key to conserving wildlife in a challenging environment. From: https://www.carbonbrief.org/guest-post-data-key-conserving-wildlife-changing-climate (Accessed: 22 September 2016)

Urban, M. C., Bocedi, G., Hendry, A. P., Mihoub, J. B., Pe’er, G., Singer, A., … & Gonzalez, A. (2016). Improving the forecast for biodiversity under climate change. Science353(6304), aad8466.

Wulf, A. (2015). The Invention of Nature: Alexander Von Humboldt’s New World. Knopf Publishing Group.

On niche partitioning and the Ohio State Buckeyes

By: Erin Pickett, MS student, Biotelemetry and Behavioral Ecology Laboratory & GEMM Lab, MMI

Buckeye anecdote

I recently found myself sitting at a Sunday brunch at the Westin in Washington, D.C., talking to my uncle about my research on the foraging ecology of penguins. Our entire extended family had gathered for a cousin’s wedding, and it was the first family gathering in a long time that I had been able to attend due to always being “out on some island”, as my cousin puts it. In fact, I got a shout-out during one of the dinner reception speeches for coming all the way from Antarctica for the wedding.

My uncle asked me about my research while our surrounding family members sipped their coffee and OJ and recounted the highlights of the previous night’s wedding reception. This conversation with my uncle was the first I’d had with a family member all weekend that had progressed past my ‘elevator speech’ of what I was studying in school. After I described my research questions about resource partitioning between Adelie and gentoo penguins, my uncle glanced around the room full of family members and said to me, “You know what….”? And then he went on to describe his thoughts about how our aunts, uncles, cousins and in-laws all occupied distinct niches within our family.

The definition of the word niche is broad, and for this reason it can be used to describe the roles of younger siblings, matriarchs, sisters, and Ohio State Buckeye fans within their families or communities. Take for example my entire family on the dance floor chanting O-H-I-O during the bands requisite rendition of “Hang on Sloopy” at the wedding reception. As Buckeyes, we were occupying a role distinct from that of the bride’s family, who are Notre Dame Fans. Within our immediate families, the roles of every sibling and parent are further differentiated. My uncle and I looked around the room and saw a family who despite a wide range of personalities and football allegiances, was managing to enjoy a pretty good time together!

Ecological niche theory and sympatric penguins

In ecology, the term niche is used to describe the ecological role that a species occupies within an ecosystem (Hutchinson 1957). The concept of an ecological niche is typically used in ecology to describe how similar species coexist within the same space. This coexistence is made possible through segregation mechanisms that facilitate resource partitioning, such as spatial or temporal differences in foraging location, or dietary segregation (Pianka 1974). With this in mind, the main objective of my master’s research is to quantify the ecological niches of Adelie and gentoo penguins in terms of space, time and diet, in order to investigate whether foraging competition is occurring between these two species. You’ll find more background on this project here.

The first step in my investigation of resource partitioning was to assess the extent and consistency of dietary overlap between these two species. The diets of Adelie and gentoo penguins vary regionally, but along the Antarctic Peninsula the prey of both species is typically dominated by Antarctic krill. This was the case when I studied the diets of these two species at Palmer Station in Antarctica. I also found that both species consume the same size classes of krill and that this was consistent across both low and high prey availability years (Figure 1).

Size class frequency distribution of Antarctic krill found in penguin diet samples (2010-2015). Krill size class bins shown on x-axis and proportions depicted on y-axis
Figure 1. Length-frequency distribution of Antarctic krill found in penguin diet samples (2010-2015). Krill size class bins shown on x-axis with the proportion of those size classes depicted on the y-axis. Palmer LTER unpublished data.

The next step of my project is to assess the foraging habits and space-use patterns of these two species. They share food, but do they forage in the same areas? I am in the process of analyzing spatial data obtained from satellite and TDR (time depth recording) tags temporarily attached to Adelie and gentoo penguins during the breeding season to determine the core foraging areas. I am using kernel density estimate (KDE) techniques to visually and quantitatively determine the size and extent of spatial overlap between both species foraging areas (Figure 2).

Figure 2.
Figure 2. An example plot of 3D kernel density estimates outlining 95% and 50% volume contours of foraging penguins during the 2010 breeding season. Orange and green depict the core foraging areas of gentoo and Adelies, respectively. Horizontal axes show northing and easting values and depth is shown in meters on the vertical axis.

The KDE method allows me to turn hundreds of satellite tag derived location points into a probability density surface which depicts where an animal is most likely to be found (Kie et al. 2010).  2D KDEs are sufficient to describe the ranges of many terrestrial animals, however, 3D KDEs are a more appropriate description of the space-use patterns of diving seabirds. By failing to incorporate the depth at which these two species are foraging, 2D KDEs might overestimate the extent of spatial overlap between two species who are foraging in the same location but at different depths. Similar to other studies (Cimino et al. 2016 & Wilson 2010), I am finding that Adelie and gentoo penguins may be partitioning resources by foraging at different depths, with gentoo penguins diving deeper than Adelies. By foraging at different depths, these two species are limiting foraging competition.

While I am working on these analyses, I am also thinking about my next step, which will be to determine whether foraging niche overlap between Adelie and gentoo penguins is a function of prey availability. Resource availability is a critical component of niche segregation. When resources are abundant, there is typically a higher tolerance for niche overlap (Pianka 1974, Torres 2009). Conversely, niches may become more distinct as resources decrease and successfully partitioning these resources will become more important to minimize competition. In order to address the effect of resource availability on niche partitioning between Adelie and gentoo penguins, I will be comparing their foraging niches during years of both low and high prey availability. This will allow me to truly evaluate the potential occurrence of foraging competition between these two species.

Conclusion

I’ll keep you updated on my progress with data analysis in future blogs, but before I go I’ll share one last piece of wisdom about niche theory that I’ve learned from my family. There is a niche for everyone unless you are a Michigan fan, then no amount of spatial or dietary partitioning in a room full of Ohio State Buckeyes will save you.

References 

Cimino, Megan A., et al. “Climate-driven sympatry may not lead to foraging competition between congeneric top-predators.” Scientific reports 6 (2016).

Hutchinson, G.E. “Concluding remarks. Population Studies: Animal Ecology and Demography.” Cold Spring Harbor Symposia on Quantitative Biology 22 (1957): 415-427.

Kie, John G., et al. “The home-range concept: are traditional estimators still relevant with modern telemetry technology?” Philosophical Transactions of the Royal Society of London B: Biological Sciences 365.1550 (2010): 2221-2231.

Pianka, Eric R. “Niche overlap and diffuse competition.” Proceedings of the National Academy of Sciences 71.5 (1974): 2141-2145.

Torres, Leigh G. “A kaleidoscope of mammal, bird and fish: habitat use patterns of top predators and their prey in Florida Bay.” Marine Ecology Progress Series 375 (2009): 289-304.

Seabird Research on the Western Antarctic Peninsula

I’d venture to say that I’m not the first field biologist to stare into the distance past my computer for a long while before deciding that trying to describe the smell of a seabird colony in a blog was futile.

My name is Erin Pickett and I am a graduate student at OSU’s Marine Mammal Institute. I am affiliated with the Biotelemetry and Behavioral Ecology Laboratory, a sister-lab of GEMM, and am here to share my recent experience conducting field research in Antarctica.

I’ve recently returned from a field season at Palmer station on Anvers Island, along the Western Antarctic Peninsula. Throughout the month of January I was collecting data for my masters’ project, while partaking in an on-going study conducted by the Palmer Long Term Ecological Research (LTER) program. I was fortunate enough to join the seabird research team at Palmer, a group that has been monitoring the area’s breeding seabirds for over two decades. January is the team’s busiest Antarctic summer month as the seabirds are in the midst of their annual breeding season. Our primary focus was studying the foraging ecology and demography of Adelie penguins; however, we also monitored Chinstrap and Gentoo penguins, southern giant-petrels, brown and south polar skuas, and blue-eyed shags. Before I delve into a description of this research, I’ll tell you a bit more about what it’s like to work in Antarctica.

It became quickly apparent to me that working with a team of experienced field biologists who have spent a collective thirty or so seasons in Antarctica meant that I would be the only one distracted by the scenery. This situation was exacerbated by the fact that I had never witnessed snow falling before I had arrived in Antarctica. I tried to play it cool, but inevitably rolled down every snow-covered hill I came across, and I couldn’t help but stop and stare into the sky every time it snowed.

There might have been some misunderstanding when in an email to a friend I referred to the weather as balmy. By Antarctic standards this was true, the average daily temperature hovered around 35°F. By my Hawaii-born standards, it was only balmy once I donned three or four layers, slipped toe warmers in my boots, and sipped on hot coffee while I hiked up a hill. Still, I considered myself lucky to have escaped my first Oregon winter by travelling south.

At Palmer I quickly learned that birders don’t come in for lunch. I adjusted my rations accordingly, although I have to admit that my “emergency food” in my “emergency boat bag” got eaten despite the fact that no real (non-hunger related) emergencies occurred. Every day after packing lunch and suiting up, we would load a small zodiac with our gear and set off to work on the numerous islands surrounding the station where seabirds were nesting.

One of the main objectives of the Palmer LTER program is to research the effects of climate variability and change on the marine ecosystem surrounding Palmer station. As an apex predator, the Adelie penguin plays a focal role in this project by providing insight into ecosystem-wide changes in the marine environment and the surrounding coastal habitat. Over the last four decades, Adelie penguins on the Western Antarctic Peninsula have experienced a decline of over 85% of their population. During this same time period Gentoo and Chinstrap penguins, who were previously unknown in this area, established founder colonies and they have been increasing in number ever since.

These recent population trends have been alarming and have driven Palmer LTER research objectives aimed at understand the mechanisms behind these changes. The proximal cause behind these demographic shifts is a warming-induced loss of sea ice along the peninsula. Over the last 50 years, the average mid-winter temperature in this region has risen by 6°C (five times higher than rise of the average global temperature). By decreasing the extent, duration and concentration of winter sea-ice, this warming has altered marine primary productivity and transformed coastal habitat along the peninsula.

These transformations have caused the climate along the WAP to more closely resemble the warmer and moister sub-Antarctic, rather than the traditionally cold and arid Antarctic it once was. This has resulted in a southward expansion of the ranges of sub-polar, ice-avoiding species (e.g. the Gentoo penguin) and a contraction of the ranges of ice-obligate species (e.g. the Adelie penguin). The strong influence of sea ice on the ranges of these two species makes it difficult to determine whether sea ice driven marine variability has also influenced these trends. The life history of Antarctic krill, a primary prey item of both Adelie and Gentoo penguins, is intricately tied to the seasonality of sea ice. In regions north of Palmer, decreasing sea ice has resulted in declining krill stocks. In the future, trends at Palmer are predicted to mirror those seen in the northern WAP.

For my master’s research, I am working with the seabird biologists at Palmer station to gain a better understanding of how prey variability affects the foraging strategies of Gentoo and Adelie penguins in this area. Specifically, I will be investigating how the foraging behaviors of Adelie and Gentoo penguins change in relation to inter-annual krill recruitment variability. I will be utilizing a long time series of data collected at Palmer by outfitting Adelie and Gentoo penguins with satellite transmitters and time depth recorders. This data will allow me to describe the foraging behavior and effort expended by these penguins on the daily foraging trips they make to feed their chicks. Determining how each of these species responds to prey variability will help us better understand the current community structure of penguins at Palmer. This is important because it will leave us better informed to predict the effects of future ecosystem shifts on the reproductive success and geographic distributions of these two species.

I’m looking forward to sharing more of this research as time goes on. Until then, enjoy the photos!