You can’t build a pyramid without the base: diving into the foundations of behavioral ecology to understand cetacean foraging

By Lisa Hildebrand, MSc student, OSU Department of Fisheries & Wildlife, Marine Mammal Institute, Geospatial Ecology of Marine Megafauna Lab

The last two months have been challenging for everyone across the world. While I have also experienced lows and disappointments during this time, I always try to see the positives and to appreciate the good things every day, even if they are small. One thing that I have been extremely grateful and excited about every week is when the clock strikes 9:58 am every Thursday. At that time, I click a Zoom link and after a few seconds of waiting, I am greeted by the smiling faces of the GEMM Lab. This spring term, our Principal Investigator Dr. Leigh Torres is teaching a reading and conference class entitled ‘Cetacean Behavioral Ecology’. Every week there are 2-3 readings (a mix of book chapters and scientific papers) focused on a particular aspect of behavioral ecology in cetaceans. During the first week we took a deep dive into the foundations of behavioral ecology (much of which is terrestrial-based) and we have now transitioned into applying the theories to more cetacean-centric literature, with a different branch of behavior and ecology addressed each week.

Leigh dedicated four weeks of the class to discussing foraging behavior, which is particularly relevant (and exciting) to me since my Master’s thesis focuses on the fine-scale foraging ecology of gray whales. Trying to understand the foraging behavior of cetaceans is not an easy feat since there are so many variables that influence the decisions made by an individual on where and when to forage, and what to forage on. While we can attempt to measure these variables (e.g., prey, environment, disturbance, competition, an individual’s health), it is almost impossible to quantify all of them at the same time while also tracking the behavior of the individual of interest. Time, money, and unworkable weather conditions are the typical culprits of making such work difficult. However, on top of these barriers is the added complication of scale. We still know so little about the scales at which cetaceans operate on, or, more importantly, the scales at which the aforementioned variables have an effect on and drive the behavior of cetaceans. For instance, does it matter if a predator is 10 km away, or just when it is 1 km away? Is a whale able to sense a patch of prey 100 m away, or just 10 m away? The same questions can be asked in terms of temporal scale too.

What is that gray whale doing in the kelp? Source: F. Sullivan.

As such, cetacean field work will always involve some compromise in data collection between these factors. A project might address cetacean movements across large swaths of the ocean (e.g., the entire U.S. west coast) to locate foraging hotspots, but it would be logistically complicated to simultaneously collect data on prey distribution and abundance, disturbance and competitors across this same scale at the same time. Alternatively, a project could focus on a small, fixed area, making simultaneous measurements of multiple variables more feasible, but this means that only individuals using the study area are studied. My field work in Port Orford falls into the latter category. The project is unique in that we have high-resolution data on prey (zooplankton) and predators (gray whales), and that these datasets have high spatial and temporal overlap (collected at nearly the same time and place). However, once a whale leaves the study area, I do not know where it goes and what it does once it leaves. As I said, it is a game of compromises and trade-offs.

Ironically, the species and systems that we study also live a life of compromises and trade-offs. In one of this week’s readings, Mridula Srinivasan very eloquently starts her chapter entitled ‘Predator/Prey Decisions and the Ecology of Fear’ in Bernd Würsig’s ‘Ethology and Behavioral Ecology of Odontocetes’ with the following two sentences: “Animal behaviors are governed by the intrinsic need to survive and reproduce. Even when sophisticated predators and prey are involved, these tenets of behavioral ecology hold.”. Every day, animals must walk the tightrope of finding and consuming enough food to survive and ensure a level of fitness required to reproduce, while concurrently making sure that they do not fall prey to a predator themselves. Krebs & Davies (2012) very ingeniously use the idea of economic analysis of costs and benefits to understand foraging behavior (but also behavior in general). While foraging, individuals not only have to assess potential risk (Fig. 1) but also decide whether a certain prey patch or item is profitable enough to invest energy into obtaining it (Fig. 2).

Leigh’s class has been great, not only to learn about foundational theories but to then also apply them to each of our study species and systems. It has been exciting to construct hypotheses based on the readings and then dissect them as a group. As an example, Sih’s 1984 paper on the behavioral response race of predators and prey prompted a discussion on responses of predators and prey to one another and how this affects their spatial distributions. Sih posits that since predators target areas with high prey densities, and prey will therefore avoid areas that predators frequent, their responses are in conflict with one another. Resultantly, there will be different outcomes depending on whichever response dominates. If the predator’s response dominates (i.e. predators are able to seek out areas of high prey density before prey can respond), then predators and prey will have positively correlated spatial distributions. However, if the prey responses dominate, then the spatial distributions of the two should be negatively correlated, as predators will essentially always be ‘one step behind’ the prey. Movement is most often the determinant factor to describe the strength of these relationships.

Video 1. Zooplankton closest to the camera will jump or dart away from it. Source: GEMM Lab.

So, let us think about this for gray whales and their zooplankton prey. The latter are relatively immobile. Even though they dart around in the water column (I have seen them ‘jump’ away from the GoPro when we lower it from the kayak on several occasions; Video 1), they do not have the ability to maneuver away fast or far enough to evade a gray whale predator moving much faster. As such, the predator response will most likely always be the strongest since gray whales operate at a scale that is several orders of magnitude greater than the zooplankton. However, the zooplankton may not be as helpless as I have made them seem. Based on our field observations, it seems that zooplankton often aggregate beneath or around kelp. This behavior could potentially be an attempt to evade predators as the kelp and reef crevices may serve as a refuge. So, in areas with a lot of refuges, the prey response may in fact dominate the relationship between gray whales and zooplankton. This example demonstrates the importance of habitat in shaping predator-prey interactions and behavior. However, we have often observed gray whales perform “bubble blasts” in or near kelp (Video 2). We hypothesize that this behavior could be a foraging tactic to tip the see-saw of predator-prey response strength back into their favor. If this is the case, then I would imagine that gray whales must decide whether the energetic benefit of eating zooplankton hidden in kelp refuges outweighs the energy required to pursue them (Fig. 2). On top of all these choices, are the potential risks and threats of boat traffic, fishing gear, noise, and potential killer whale predation (Fig. 1). Bringing us back to the analogy of economic analysis of costs and benefits to predator-prey relationships. I never realized it so clearly before, but gray whales sure do have a lot of decisions to make in a day!

Video 2. Drone footage of a gray whale foraging in kelp and performing a “bubble blast” at 00:40. Footage captured under NMFS permit #21678. Source: GEMM Lab.

Trying to tease apart these nuanced dynamics is not easy when I am unable to simply ask my study subjects (gray whales) why they decided to abandon a patch of zooplankton (Were the zooplankton too hard to obtain because they sought refuge in kelp, or was the patch unprofitable because there were too few or the wrong kind of zooplankton?). Or, why do gray whales in Oregon risk foraging in such nearshore coastal reefs where there is high boat traffic (Does their need for food near the reefs outweigh this risk, or do they not perceive the boats as a risk?). So, instead, we must set up specific hypotheses and use these to construct a thought-out and informed study design to best answer our questions (Mann 2000). For the past few weeks, I have spent a lot of time familiarizing myself with spatial packages and functions in R to start investigating the relationships between zooplankton and kelp hidden in the data we have collected over 4 years, to ultimately relate these patterns to gray whale foraging. I still have a long and steep journey before I reach the peak but once I do, I hope to have answers to some of the questions that the Cetacean Behavioral Ecology class has inspired.

Literature cited

Krebs, J. R., and N. B. Davies. 2012. Economic decisions and the individual in Davies, N. B. et al., eds. An introduction to behavioral ecology. John Wiley & Sons, Oxford.

Mann, J. 2000. Unraveling the dynamics of social life: long-term studies and observational methods in Mann, J., ed. Cetacean societies: field studies of dolphins and whales. University of Chicago Press, Chicago.

Sih, A. 1984. The behavioral response race between predator and prey. The American Naturalist 123:143-150.

Srinivasan, M. 2019. Predator/prey decisions and the ecology of fear in Würsig, B., ed. Ethology and ecology of odontocetes. Springer Nature, Switzerland. 
Whale blow: good for more than spotting whales

Clara Bird, Masters Student, OSU Department of Fisheries and Wildlife, Geospatial Ecology of Marine Megafauna Lab

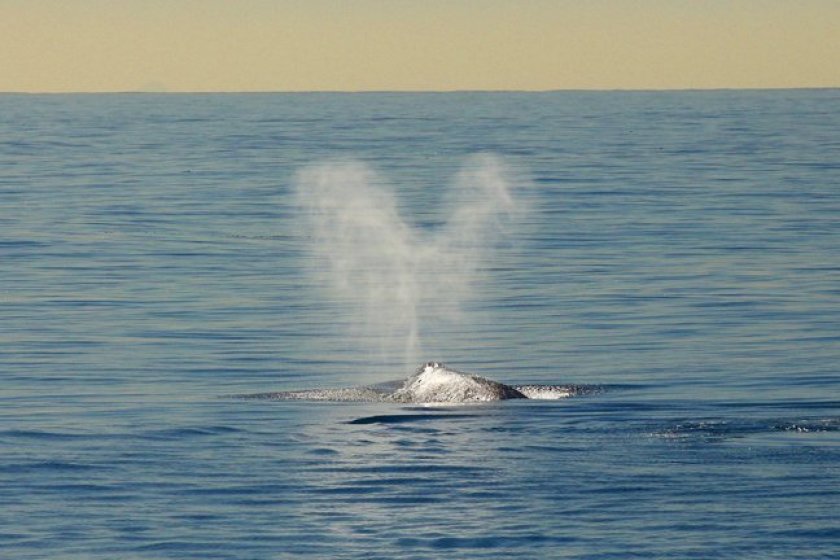
Whale blow, the puff of air mixed with moisture that a whale releases when it comes to the surface, is a famously thrilling indicator of the presence of a whale. From shore, spotting whale blow brings the excitement of knowing that there are whales nearby. During boat-based field work, seeing or hearing blow brings the rush of adrenaline meaning that it’s game time. Whale blow can also be used to identify different species of whales, for example gray whale blow is heart shaped (Figure 1). However, whale blow can be used for more than just spotting and identifying whales. We can use the time between blows to study energetics.

Figure 1. Gray whale blow is often heart shaped (when there is very little wind). Source: https://www.lajollalight.com/sdljl-natural-la-jolla-winter-wildlife-2015jan08-story.html

A blow interval is the time between consecutive blows when a whale is at the surface (Stelle, Megill, and Kinzel 2008). These are also known as short breath holds, whereas long breath holds are times between surfacings (Sumich 1983).  Sumich (1983) hypothesized that short breath holds lead to efficient rates of oxygen use. The body uses oxygen to create energy, so “efficient rate of oxygen use” means that longer breath holds do not use much more oxygen and subsequently do not produce more energy.  Surfacings, during which short blow intervals occur, are often thought of as recovery periods for whales. Think of it this way, when you sprint, immediately afterwards you typically need to take a break to just breathe and recover.

We hypothesize that we can use blow intervals as a measure of how strenuous an activity is; shorter blow intervals may indicate that an activity is more energetically demanding (Wursig, Wells, and Croll 1986). Let’s go back to the sprinting analogy and compare the energetic demands of walking and running. Imagine I asked you to walk for five minutes, stop and measure the time between each breath, and then run for five minutes and do the same; after running, you would likely breathe more heavily and take more breaths with less time between them. This result indicates that running is more demanding, which we already know because we can do other experiments with humans to study metabolic rate and related metrics. In the case of gray whales, we cannot do experiments in the same way, but we can use the same analogy. Several studies have examined how blow intervals differ between travelling and foraging.

Wursig, Wells, and Croll (1986) measured blow interval, surfacing time, and estimated dive depth and duration of gray whales in Alaska from a boat during the foraging season. They found that blow intervals were shorter during feeding. They also found that the number of blows per surfacing increased with increasing depth. Overall these findings suggest that during the foraging season, feeding is more strenuous than other behaviors and that deeper dives may be more physiologically stressful.

Stelle, Megill, and Kinzel (2008) studied gray whales foraging off of British Columbia, Canada. They found shorter blow intervals during foraging, intermediate blow intervals during searching, and longer blow intervals during travelling. Interestingly, within feeding behaviors, they found a difference between whales feeding on mysids (krill-like animals that swim in the water column) and whales feeding benthically on amphipods. They found that whales feeding on mysids made more frequent but shorter dives with short blow intervals at surface, while whales feeding benthically had longer dives with longer blow intervals. They hypothesized that this difference in surfacing pattern is because mysids might scatter when disturbed, so gray whales surface more often to allow the mysids swarm to reform. These studies inspired me to start investigating these same questions with my drone video data.

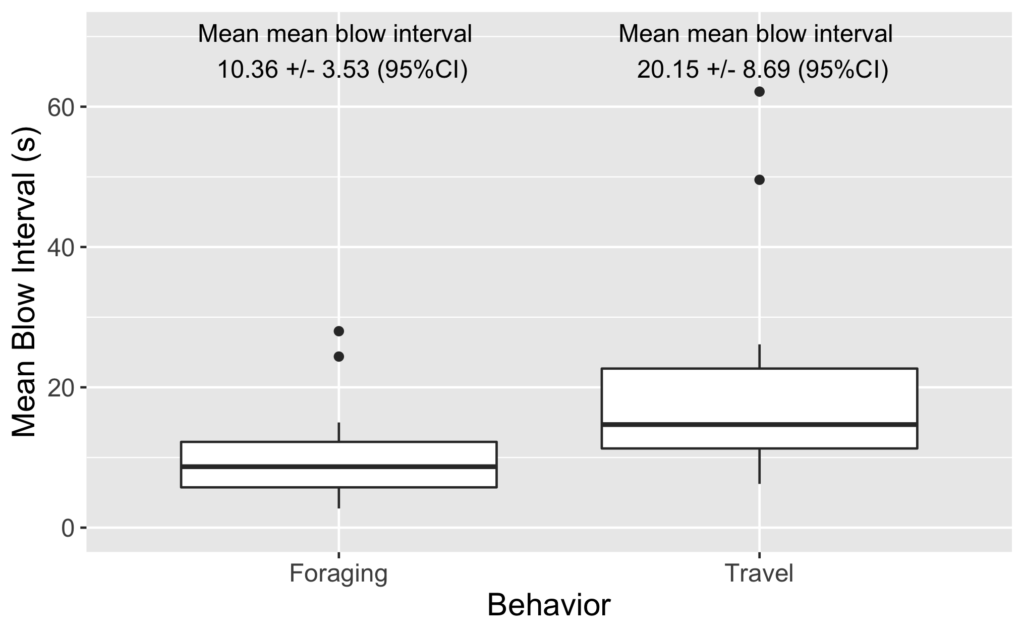
As I review the drone footage and code the behaviors I also mark the time of each blow. I’ve done some initial video coding and using this data I have started to look into differences in blow intervals. As it turns out, we see a similar difference in blow interval relative to behavior state in our data: whales that are foraging have shorter blow intervals than when traveling (Figure 2). It is encouraging to see that our data shows similar patterns.

Figure 2. Boxplot of mean blow interval per sighting of foraging whales and travelling whales.

Next, I would like to examine how blow intervals differ between foraging tactics. A significant part of my thesis is dedicated to studying specific foraging tactics. The perspective from the drone allows us to identify behaviors in greater detail than studies from shore or boat (Torres et al. 2018), allowing us to dig into the differences between the different foraging behaviors. The purpose of foraging is to gain energy. However, this gain is a net gain. To understand the different energetic “values” of each tactic we need to understand the cost of each behavior, i.e. how much energy is required to perform the behavior. Given previous studies, maybe blow intervals could help us measure this cost or at least compare the energetic demands of the behaviors relative to each other. Furthermore, because different behaviors are likely associated with different prey types (Dunham and Duffus 2001), we also need to understand the different energetic gains of each prey type (this is something that Lisa is studying right now, check out the COZI project to learn more). By understanding both of these components – the gains and costs – we can understand the energetic tradeoffs of the different foraging tactics.

Another interesting component to this energetic balance is a whale’s health and body condition. If a whale is in poor health, can it afford the energetic costs of certain behaviors? If whales in poor body condition engage in different behavior patterns than whales in good body condition, are these patterns explained by the energetic costs of the different foraging behaviors? All together this line of investigation is leading to an understanding of why a whale may choose to use different foraging behaviors in different situations. We may never get the full picture; however, I find it really exciting that something as simple and non-invasive as measuring the time between breaths can contribute such a valuable data stream to this project.

References

Dunham, Jason S., and David A. Duffus. 2001. “Foraging Patterns of Gray Whales in Central Clayoquot Sound, British Columbia, Canada.” Marine Ecology Progress Series 223 (November): 299–310. https://doi.org/10.3354/meps223299.

Stelle, Lei Lani, William M. Megill, and Michelle R. Kinzel. 2008. “Activity Budget and Diving Behavior of Gray Whales (Eschrichtius Robustus) in Feeding Grounds off Coastal British Columbia.” Marine Mammal Science 24 (3): 462–78. https://doi.org/10.1111/j.1748-7692.2008.00205.x.

Sumich, James L. 1983. “Swimming Velocities, Breathing Patterns, and Estimated Costs of Locomotion in Migrating Gray Whales, Eschrichtius Robustus.” Canadian Journal of Zoology 61 (3): 647–52. https://doi.org/10.1139/z83-086.

Torres, Leigh G., Sharon L. Nieukirk, Leila Lemos, and Todd E. Chandler. 2018. “Drone up! Quantifying Whale Behavior from a New Perspective Improves Observational Capacity.” Frontiers in Marine Science 5 (SEP). https://doi.org/10.3389/fmars.2018.00319.

Wursig, B., R. S. Wells, and D. A. Croll. 1986. “Behavior of Gray Whales Summering near St. Lawrence Island, Bering Sea.” Canadian Journal of Zoology 64 (3): 611–21. https://doi.org/10.1139/z86-091.

Coding stories, tips, and tricks

Clara Bird1 and Karen Lohman2

1Masters Student in Wildlife Science, Geospatial Ecology of Marine Megafauna Lab

2Masters Student in Wildlife Science, Cetacean Conservation and Genomics Laboratory

In a departure from my typical science-focused blog, this week I thought I would share more about myself. This week I was inspired by International’s Woman’s Day and, with some reflection on the last eight months as a graduate student, I decided to look back on the role that coding has played in my life. We hear about how much coding can be empowering but I thought it might be cool to talk about my personal experience of feeling empowered by coding. I’ve also invited a fellow grad student in the Marine Mammal Institute, Karen Lohman, to co-author this post. We’re going to briefly talk about our experience with coding and then finish with advice for getting started with coding and coding for data analysis.

Our Stories

Clara

I’ve only been coding for a little over two and a half years. In summer 2017 I did an NSF REU (Research Experience for Undergraduates) at Bigelow Laboratory for Ocean Sciences and for my project I taught myself python (with the support of a post-doc) for a data analysis project. During those 10 weeks, I coded all day, every workday. From that experience, I not only acquired the hard skill of programming, but I gained a good amount of confidence in myself, and here’s why: For the first three years of my undergraduate career coding was a daunting skill that I knew I would eventually need but did not know where to start. So, I essentially ended up learning by jumping off the deep end. I found the immersion experience to be the most effective learning method for me. With coding, you find out if you got something right (or wrong) almost instantaneously. I’ve found that this is a double-edged sword. It means that you can easily have days where everything goes wrong. But, the feeling when it finally works is what I think of when I hear the term empowerment. I’m not quite sure how to put it into words, but it’s a combination of independence, confidence, and success. 

Aside from learning the fundamentals, I finished that summer with confidence in my ability to teach myself not just new coding skills, but other skills as well. I think that feeling confident in my ability to learn something new has been the most helpful aspect to allow me to hit the ground running in grad school and also keeping the ‘imposter syndrome’ at bay (most of the time).

Clara’s Favorite Command: pd.groupby (python) – Say you have a column of measurements and a second column with the field site of each location. If you wanted the mean of the measurement per each location, you could use groupby to get this. It would look like this: dataframe.groupby(‘Location’)[‘Measurement’].mean().reset_index()

Karen

I’m quite new to coding, but once I started learning I was completely enchanted! I was first introduced to coding while working as a field assistant for a PhD student (a true R wizard who has since developed deep learning computer vision packages for automated camera trap image analysis) in the cloud forest of the Ecuadorian Andes. This remote jungle was where I first saw how useful coding can be for data management and analysis. It was a strange juxtaposition between being fully immersed in nature for remote field work and learning to think along the lines of coding syntax. It wasn’t the typical introduction to R most people have, but it was an effective hook. We were able to produce preliminary figures and analysis as we collected data, which made a tough field season more rewarding. Coding gave us instant results and motivation.

I committed to fully learning how to code during my first year of graduate school. I first learned linux/command line and python, and then I started working in R that following summer. My graduate research uses population genetics/genomics to better understand the migratory connections of humpback whales. This research means I spend a great deal of time working to develop bioinformatics and big data skills, an essential skill for this area of research and a goal for my career. For me, coding is a skill that only returns what you put in; you can learn to code quite quickly, if you devote the time. After a year of intense learning and struggle, I am writing better code every day.

In grad school research progress can be nebulous, but for me coding has become a concrete way to measure success. If my code ran, I have a win for the week. If not, then I have a clear place to start working the next day. These “tiny wins” are adding up, and coding has become a huge confidence boost.

Karen’s Favorite Command: grep (linux) – Searches for a string pattern and prints all lines containing a match to the screen. Grep has a variety of flags making this a versatile command I use every time I’m working in linux.

Advice

Getting Started

  • Be kind to yourself, think of it as a foreign language. It takes a long time and a lot of practice.
  • Once you know the fundamental concepts in any language, learning another will be easier (we promise!).
  • Ask for help! The chances that you have run into a unique error are quite small, someone out there has already solved your problem, whether it’s a lab mate or another researcher you find on Google!

Coding Tips

1. Set yourself up for success by formatting your datasheets properly

  • Instead of making your spreadsheet easy to read, try and think about how you want to use the data in the analysis.
  • Avoid formatting (merged cells, wrap text) and spaces in headers
  • Try to think ahead when formatting your spreadsheet
    • Maybe chat with someone who has experience and get their advice!

2. Start with a plan, start on paper

This low-tech solution saves countless hours of code confusion. It can be especially helpful when manipulating large data frames or in multistep analysis. Drawing out the structure of your data and checking it frequently in your code (with ‘head’ in R/linux) after manipulation can keep you on track. It is easy to code yourself into circles when you don’t have a clear understanding of what you’re trying to do in each step. Or worse, you could end up with code that runs, but doesn’t conduct the analysis you intended, or needed to do.

3. Good organization and habits will get you far

There is an excellent blog by Nice R Code on project organization and file structure. I highly recommend reading and implementing their self-contained scripting suggestions. The further you get into your data analysis the more object, directory, and function names you have to remember. Develop a naming scheme that makes sense for your project (i.e. flexible, number based, etc.) and stick with it. Temporary object names in functions or code blocks can be a good way to clarify what is the code-in-progress or the code result.

Figure 1. An example of project based workflow directory organization from Nice R Code (https://nicercode.github.io/blog/2013-04-05-projects/ )

4. Annotate. Then annotate some more.

Make comments in your code so you can remember what each section or line is for. This makes debugging much easier! Annotation is also a good way to stay on track as you code, because you’ll be describing the goal of every line (remember tip 1?). If you’re following a tutorial (or STACKoverflow answer), copy the web address into your annotation so you can find it later. At the end of a coding session, make a quick note of your thought process so it’s easier to pick up when you come back. It’s also a good habit to add some ‘metadata’ details to the top of your script describing what the script is intended for, what the input files are, the expected outputs, and any other pertinent details for that script. Your future self will thank you!

Figure 2. Example code with comments explaining the purpose of each line.

5. Get with git/github already

Github is a great way to manage version control. Remember how life-changing the advent of dropbox was? This is like that, but for code! It’s also become a great open-source repository for newly developed code and packages. In addition to backing up and storing your code, GitHub has become a ‘coding CV’ that other researchers look to when hiring.

Wondering how to get started with GitHub? Check out this guide: https://guides.github.com/activities/hello-world/

Looking for a good text/code editor? Check out atom (https://atom.io/), you can push your edits straight to git from here.

6. You don’t have to learn everything, but you should probably learn the R Tidyverse ASAP

Tidyverse is a collection of data manipulation packages that make data wrangling a breeze. It also includes ggplot, an incredibly versatile data visualization package. For python users hesitant to start working in R, Tidyverse is a great place to start. The syntax will feel more familiar to python, and it has wonderful documentation online. It’s also similar to the awk/sed tools from linux, as dplyr removes any need to write loops. Loops in any language are awful, learn how to do them, and then how to avoid them.

7. Functions!

Break your code out into blocks that can be run as functions! This allows easier repetition of data analysis, in a more readable format. If you need to call your functions across multiple scripts, put them all into one ‘function.R’ script and source them in your working scripts. This approach ensures that all the scripts can access the same function, without copy and pasting it into multiple scripts. Then if you edit the function, it is changed in one place and passed to all dependent scripts.

8. Don’t take error messages personally

  • Repeat after me: Everyone googles for every other line of code, everyone forgets the command some (….er every) time.
  • Debugging is a lifestyle, not a task item.
  • One way to make it less painful is to keep a list of fixes that you find yourself needing multiple times. And ask for help when you’re stuck!

9. Troubleshooting

  • Know that you’re supposed to google but not sure what?
    • start by copying and pasting the error message
  • When I started it was hard to know how to phrase what I wanted, these might be some common terms
    • A dataframe is the coding equivalent of a spreadsheet/table
    • Do you want to combine two dataframes side by side? That’s a merge
    • Do you want to stack one dataframe on top of another? That’s concatenating
    • Do you want to get the average (or some other statistic) of values in a column that are all from one group or category? Check out group by or aggregate
    • A loop is when you loop through every value in a column or list and do something with it (use it in an equation, use it in an if/else statement, etc).

Favorite Coding Resource (other than github….)

  • Learnxinyminutes.com
    • This is great ‘one stop googling’ for coding in almost any language! I frequently switch between coding languages, and as a result almost always have this open to check syntax.
  • https://swirlstats.com/
    • This is a really good resource for getting an introduction to R

Parting Thoughts

We hope that our stories and advice have been helpful! Like many skills, you tend to only see people once they have made it over the learning curve. But as you’ve read Karen and I both started recently and felt intimidated at the beginning. So, be patient, be kind to yourself, believe in yourself, and good luck!

Makah Gray Whale Hunt Waiver – a long-time coming, but still premature?

By Lisa Hildebrand, MSc student, OSU Department of Fisheries & Wildlife, Marine Mammal Institute, Geospatial Ecology of Marine Megafauna Lab

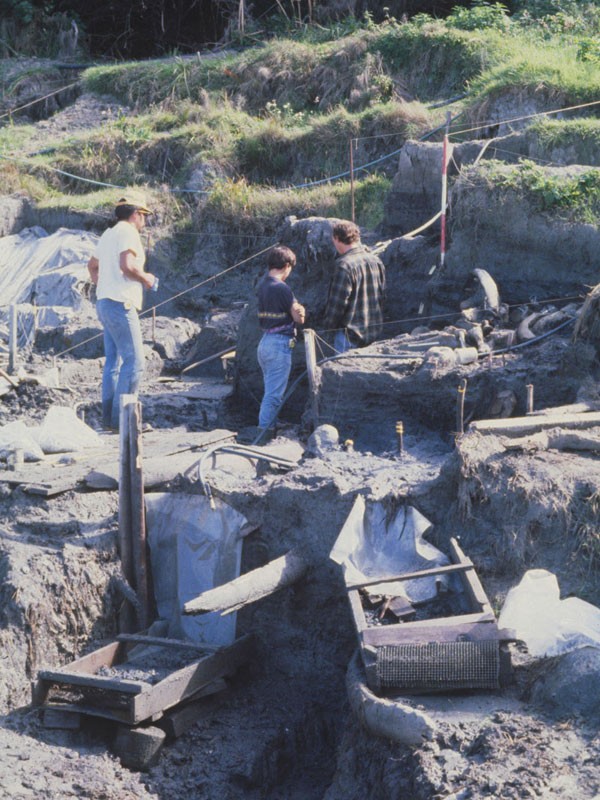
Archaeological site of Ozette Village. Source: Makah Museum.

The Makah, an indigenous people of the Pacific Northwest Coast living in Washington State, have a long history with whaling. Deposits from a mudslide in the village of Ozette suggest that whaling may date back 2,000 years as archaeologists uncovered humpback and gray whale bones and barbs from harpoons (Kirk 1986). However, the history of Makah whaling is also quite recent. On January 29 of this year, the National Marine Fisheries Service (NMFS; informally known as NOAA Fisheries) announced a 45-day public comment period regarding a NMFS proposed waiver on the Marine Mammal Protection Act’s (MMPA) moratorium on the take of marine mammals to allow the Makah to take a limited number of eastern North Pacific gray whales (ENP). To understand how the process reached this point, we first must go back to 1855.

1855 marks the year in which the U.S. government and the Makah entered into the Treaty of Neah Bay (in Washington state). The Makah ceded thousands of acres of land to the U.S. government, and in return reserved their right to whale. Following the treaty, the Makah hunt of gray whales continued until the 1920s. At this point, commercial hunting had greatly reduced the ENP population, so much so that the Makah voluntarily ceased their whaling. The next seven decades brought about the formation of the International Whaling Commission (IWC), the enactment of the Whaling Convention Act, the listing of gray whales as endangered under the U.S. Endangered Species Act, and the enactment of the MMPA. For gray whales, these national and international measures were hugely successful, leading to the removal of the ENP from the Federal List of Endangered Wildlife in 1994 when it was determined that the population had recovered to near its estimated original population size.

One year later on May 5, 1995 (just one month after I was born!), the Makah asked the U.S. Department of Commerce to represent its interest to obtain a quota for gray whales from the IWC in order to resume their treaty right for ceremonial and subsistence harvest of the ENP. The U.S. government pursued this request at the next IWC meeting, and subsequently NMFS issued a final Environmental Assessment that found no significant impact to the ENP population if the hunt recommenced. The IWC set a catch limit and NMFS granted the Makah a quota in 1998. In 1999 the Makah hunted, struck and landed an ENP gray whale.

“Makahs cutting up whale, Neah Bay, ca. 1930. Photo by Asahel Curtis, Courtesy UW Special Collections (CUR767)”. Source and caption: History Link.

I will not go into detail about what happened between 1999 and now because frankly, a lot happened, particularly a lot of legal events including summary judgements, appeals, and a lot of other legal jargon that I do not quite understand. If you want to know the specifics of what happened in those two decades, I suggest you look at NMFS’ chronology of the Makah Tribal Whale Hunt. In short, cases brought against NMFS argued that they did not take a “hard [enough] look” at the National Environmental Policy Act when deciding that the Makah could resume the hunt. Consequently, the hunt was put on hold. Yet, in 2005 NMFS received a waiver request from the Makah on the MMPA’s take moratorium and NMFS published a notice of intent to review this request. A lot more happened between that event and now, including on January 29 of this year when NMFS announced the availability of transcripts from the Administrative Law Judge’s (ALJ) hearing (which happened from November 14-21, 2019) on the proposed regulations and waiver to allow the Makah to resume hunting the ENP. We are currently in the middle of the aforementioned 45-day public comment period on the formal rulemaking record. 
It has been 15 years since the Makah requested the waiver and while the decision has not yet been reached, we are likely nearing the end of this long process. This blog has turned into somewhat of a history lesson (not really my intention) but I feel it is important to understand the lengthy and complex history associated with the decision that is probably going to happen sometime this year. My actual intent for this blog is to ruminate on a few questions, some of which remain unanswered in my opinion, that are large and broad, and important to consider. Some of these questions point out gaps in our ecological knowledge regarding gray whales that I believe should be addressed for a truly informed decision to be made on NMFS’ proposed waiver now or anytime in the near future. 

1. Should the Pacific Coast Feeding Group (PCFG) of gray whales be recognized as its own stock?

Currently, the PCFG are considered a part of the ENP stock. This decision was published following a workshop held by a NMFS task force (Weller et al. 2013). The report concluded that based on photo-identification, genetics, tagging, and other data, there was a substantial level of uncertainty in the strength of the evidence to support the independence of the PCFG from the ENP. Nevertheless, mitochondrial genetic data have indicated a differentiation between the PCFG and the ENP, and the exchange rate between the two groups may be small enough for the two to be considered demographically independent (Frasier et al. 2011). Based on all currently available data, it seems that matrilineal fidelity plays a role in creating population structure within and between the PCFG and the ENP, however there has not been any evidence to suggest that whales from one feeding area (i.e. the PCFG range) are reproductively isolated from whales that utilize other feeding areas (i.e. the Arctic ENP feeding grounds) (Lang et al. 2011). Several PCFG researchers do argue that there needs to be recognition of the PCFG as an independent stock. It is clear that more research, especially efforts to link genetic and photo-identification data within and between groups, is required.

ENP gray whales foraging off the coast of Alaska on their main foraging grounds in the Bering Sea. Photo taken by ASAMM/AFSC. Funded by BOEM IAA No. M11PG00033. Source: NMFS.

2. Is emigration/immigration driving PCFG population growth, or is it births/deaths?

It is unclear whether the current PCFG population growth is a consequence of births and deaths that occur within the group (internal dynamics) or whether it is due to immigration and emigration (external dynamics). Likely, it is a combination of the two, however which of the two has more of an effect or is more prevalent? This question is important to answer because if population growth is driven more by external dynamics, then potential losses to the PCFG population due to the Makah hunt may not be as detrimental to the group as a whole. However, if internal dynamics play a bigger role, then the loss of just a few females could have long-term ramifications for the PCFG (Schubert 2019). NMFS has taken precautions to try and avoid such effects. In their proposed waiver, of the cumulative limit of 16 strikes of PCFG whales over the 10-year waiver period, no more than 8 of the strikes may be PCFG females (Yates 2019a). While a great step, it still begs the question how the loss of 8 females, admittedly over a rather long period of time, may affect population dynamics since we do not know what ultimately drives recruitment. Especially when taken together with potential non-lethal effects on whales (further discussed in question 5 below).

“Scarlet” is a PCFG female who has had multiple calves in the decades that researchers have seen her in the PCFG range. Image captured under NOAA/NMFS permit #21678. Source: L Hildebrand.

3. How important are individual patterns within the PCFG, and how might the loss of these individuals affect the population? 

The hunt will be restricted to the Makah Usual & Accustomed fishing area (U&A), which is off the Washington coast. It has been shown that site fidelity among PCFG individuals is strong. In fact, based on the 143 PCFG gray whales observed in nine or more years from 1996 to 2015, 94.4% were seen in at least one of nine different PCFG regions during six or more of the years they were seen (Calambokidis et al. 2017). While high site-fidelity seems to be common for some PCFG individuals in certain regions, interestingly, an analysis of sighting histories of all individuals that utilized the Makah U&A from 1985-2011 revealed that most PCFG whales do not have strong site fidelity to the Makah U&A (Scordino et al. 2017). Only about 20% of the whales were observed in six or more years of the total 26 years of data analyzed. Since high individual site fidelity does not appear to be strong in this area, perhaps a loss of genetic diversity, cultural knowledge, and behavioral individualism is not of great concern.

“Buttons” seems to have a preference for the southern Oregon coast as in the last 5 years the GEMM Lab has conducted research, he has only been sighted in 1 year in Newport but in all 5 years in Port Orford. However, perhaps such preferences are not common among all PCFG whales. Source: F. Sullivan.

4. How has the current UME affected the situation?

The ENP has experienced two Unusual Mortality Events (UMEs) in the past 20 years; one from 1999-2000 and the second began in May 2019. Many questions arise when thinking about the Makah hunt in light of the UME. 

  • What impacts will the current UME have on ENP and PCFG birth rates in subsequent years? 
  • Could the UME lead to shifts in feeding behavior of ENP whales and result in greater use of PCFG range by more individuals?
  • What caused the UME? Shifting prey availability and a changing climate? Or has the ENP reached carrying capacity? 
  • Will UMEs become more frequent in the future with continued warming of the Arctic? 
  • What is the added impact of such periodic UMEs on population trends?
“A gray whale found dead off Point Reyes National Seashore in northern California [during the 2019 UME]. Photo by M. Flannery, California Academy of Sciences.” Source and caption: NMFS.

A key assumption of the model developed by NMFS (Moore 2019) to forecast PCFG population size for the period 2016-2028, is that the population processes underlying the data from 2002-2015 (population size estimates developed by Calambokidis et al. 2017) will be the same during the forecasted period. In other words, it is assuming that PCFG gray whales will experience similar environmental conditions (with similar variation) during the next decade as the previous one, and that there will be no catastrophic events that could drastically affect population dynamics. The UME that is still ongoing could arguably affect population dynamics enough such that they are drastically different to effects on the population dynamics during the previous decade. The cause of  the 1999/2000 UME remains undetermined and the results of the investigation of the current UME will possibly not be available for several years (Yates 2019b). Even though the ENP did rebound following the 1999/2000 UME and the abundance of the PCFG increased during and subsequent to that UME, much has changed in the 20 years since then. Increased noise due to increased vessel traffic and other anthropogenic activities (seismic surveys, pile driving, construction to name a few) as well as increased coastal recreational and commercial fishing, have all contributed to a very different oceanscape than the ENP and PCFG encountered 20 years ago. Furthermore, the climate has changed considerably since then too, which likely has caused changes in the spatial distribution of habitat and quantity, quality, and predictability of prey. All of these factors make it difficult to predict what impact the UME will have now. If such events were to become more frequent in the future or the impacts of such events are greater than anticipated, then the PCFG population forecasts will not have accounted for this change. 

5. What impacts will the hunt and associated training exercises have on energy and stress levels of whales?

The proposed waiver would allow hunts to occur in the following manner: in even-years, the hunting period is from December 1 of an odd-numbered year through May 31 of the following even-numbered year. While in odd-years, the hunt is limited from July to October.

In the even-years, the hunt coincides with the northbound migration toward the foraging grounds for ENP whales and with the arrival of PCFG whales to their foraging grounds near the Makah U&A. During the northbound migration, gray whales are at their most nutritionally stressed state as they have been fasting for several months. They are therefore most vulnerable to energy losses due to disturbance at this point (Villegas-Amtmann 2019). Attempted strikes and training exercises would certainly cause some level of disturbance and stress to the whales. Furthermore, the timing of even-year hunts, means that hunters would likely encounter pregnant females, as they are the first to arrive at foraging grounds. A loss of just ~4% of a pregnant female’s energy budget could cause them to abort the fetus or not produce a calf that year (Villegas-Amtmann 2019).

In odd-years, the Makah hunt will most certainly target PCFG whales as the Makah U&A forms one of the nine PCFG regions where PCFG individuals will be feeding during those months. However, NMFS’ waiver limits the number of strikes during odd-years to 2 (Yates 2019a), which certainly protects the PCFG population.

Stress is a difficult response to quantify in baleen whales and research on stress through hormone analysis is still relatively novel. It is unlikely that a single boat training approach of a gray whale will have an adverse effect on the individual. However, a whale is never just experiencing one disturbance at a time. There are typically many confounding factors that influence a whale’s state. In an ideal world, we would know what all of these factors are and how to recognize these effects. Yet, this is virtually impossible. Therefore, while precautions will be taken to try to minimize harm and stress to the gray whales, there may very well still be unanticipated impacts that we cannot anticipate. 

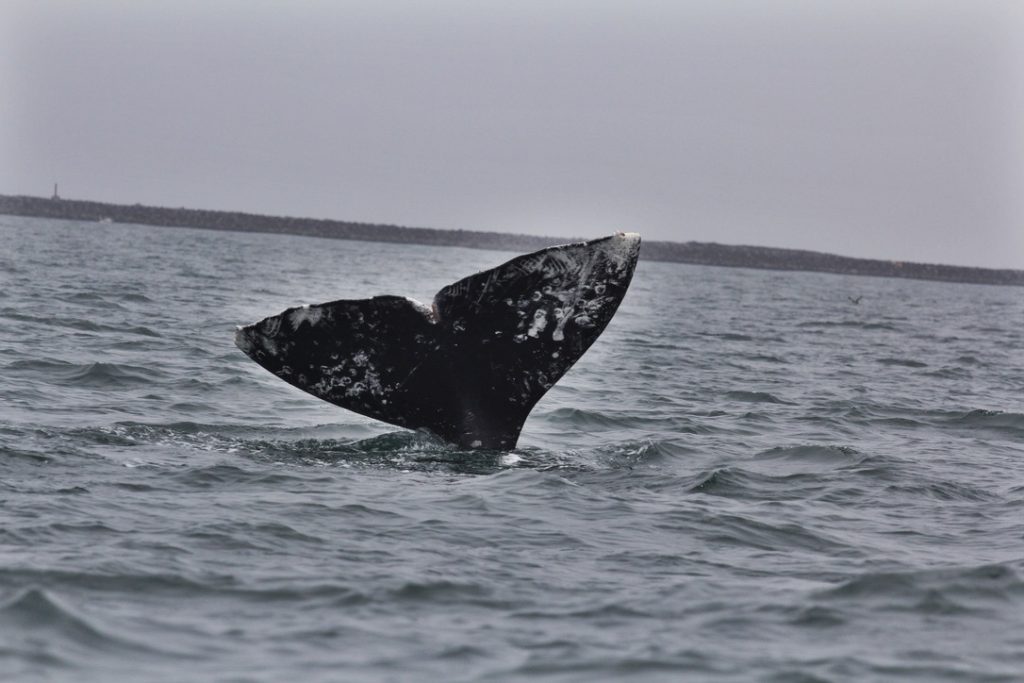
Gray whale fluke. Image captured under NOAA/NMFS permit #21678. Photo: L Hildebrand.

Final thoughts

Many unknowns still remain about the ENP and PCFG gray whale populations. During the ALJ hearing, both sides tried to deal with these unknowns. After reading testimony from both sides, it is clear to me that some of the unknowns still have not been reconciled. Ultimately, a lot of the questions circle back to the first one I posed above: Are the PCFG an independent stock? If there is independent population structure, then the proposed waiver put forth by NMFS would likely change. While NMFS has certainly taken the PCFG into account during the declarations of several experts at the ALJ hearing and has aired on the side of caution, the fact that the PCFG is considered part of the ENP might underestimate the impact that a resumption of the Makah hunt may have on the PCFG. As you can see, there are still many questions that should be addressed to make fully informed decisions on such an important ruling. While this research may take several years to obtain results, the data are within reach through synthesis and collaboration that will fill these critical knowledge gaps. 

Literature cited

Calambokidis, J. C., J. Laake, and A. Pérez. 2017. Updated analysis of abundance and population structure of seasonal gray whales in the Pacific Northwest, 1996-2015. International Whaling Commission SC/A17/GW/05.

Frasier, T. R., S. M. Koroscil, B. N. White, and J. D. Darling. 2011. Assessment of population substructure in relation to summer feeding ground use in eastern North Pacific gray whale. Endangered Species Research 14:39-48.

Kirk, Ruth. 1986. Tradition and change on the Northwest Coast: the Makah, Nuu-chah-nulth, southern Kwakiutl and Nuxalk. University of Washington Press, Seattle.

Lang, A. R., D. W. Weller, R. LeDuc, A. M. Burdin, V. L. Pease, D. Litovka, V. Burkanov, and R. L. Brownell, Jr. 2011. Genetic analysis of stock structure and movements of gray whales in the eastern and western North Pacific. SC/63/BRG10.

Moore, J. E. 2019. Declaration in re: ‘Proposed Waiver and Regulations Governing the Taking of Eastern North Pacific Gray Whales by the Makah Indian Tribe’. Administrative Law Judge, Hon. George J. Jordan. Docket No. 19-NMFS-0001. RINs: 0648-BI58; 0648-XG584.

Schubert, D. J. 2019. Rebuttal testimony in re: ‘Proposed Waiver and Regulations Governing the Taking of Eastern North Pacific Gray Whales by the Makah Indian Tribe’. Administrative Law Judge, Hon. George J. Jordan. Docket No. 19-NMFS-0001. RINs: 0648-BI58; 0648-XG584.

Scordino, J. J., M. Gosho, P. J. Gearin, A. Akmajian, J. Calambokidis, and N. Wright. 2017. Individual gray whale use of coastal waters off northwest Washington during the feeding season 1984-2011: Implications for management. Journal of Cetacean Research and Management 16:57-69.

Villegas-Amtmann, S. 2019. Declaration in re: ‘Proposed Waiver and Regulations Governing the Taking of Eastern North Pacific Gray Whales by the Makah Indian Tribe’. Administrative Law Judge, Hon. George J. Jordan. Docket No. 19-NMFS-0001.

Weller, D. W., S. Bettridge, R. L. Brownell, Jr., J. L. Laake, J. E. Moore, P. E. Rosel, B. L. Taylor, and P. R. Wade. 2013. Report of the National Marine Fisheries Service Gray Whale Stock Identification Workshop. NOAA-TM-NMFS-SWFSC-507. 

Yates, C. 2019a. Declaration in re: ‘Proposed Waiver and Regulations Governing the Taking of Eastern North Pacific Gray Whales by the Makah Indian Tribe’. Administrative Law Judge, Hon. George J. Jordan. Docket No. 19-NMFS-0001. RINs: 0648-BI58; 0648-XG584.

Yates, C. 2019b. Fifth declaration in re: ‘Proposed Waiver and Regulations Governing the Taking of Eastern North Pacific Gray Whales by the Makah Indian Tribe’. Administrative Law Judge, Hon. George J. Jordan. Docket No. 19-NMFS-0001. RINs: 0648-BI58; 0648-XG584.

The complex relationship between behavior and body condition

Clara Bird, Masters Student, OSU Department of Fisheries and Wildlife, Geospatial Ecology of Marine Megafauna Lab

Imagine that you are a wild foraging animal: In order to forage enough food to survive and be healthy you need to be healthy enough to move around to find and eat your food. Do you see the paradox? You need to be in good condition to forage, and you need to forage to be in good condition. This complex relationship between body condition and behavior is a central aspect of my thesis.

One of the great benefits of having drone data is that we can simultaneously collect data on the body condition of the whale and on its behavior. The GEMM lab has been measuring and monitoring the body condition of gray whales for several years (check out Leila’s blog on photogrammetry for a refresher on her research). However, there is not much research linking the body condition of whales to their behavior. Hence, I have expanded my background research beyond the marine world to looked for papers that tried to understand this connection between the two factors in non-cetaceans. The literature shows that there are examples of both, so let’s go through some case studies.

Ransom et al. (2010) studied the effect of a specific type of contraception on the behavior of a population of feral horses using a mixed model. Aside from looking at the effect of the treatment (a type of contraception), they also considered the effect of body condition. There was no difference in body condition between the treatment and control groups, however, they found that body condition was a strong predictor of feeding, resting, maintenance, and social behaviors. Females with better body condition spent less time foraging than females with poorer body condition. While it was not the main question of the study, these results provide a great example of taking into account the relationship between body condition and behavior when researching any disturbance effect.

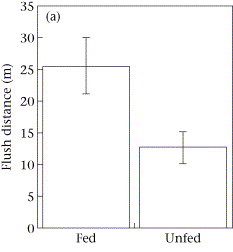
While Ransom et al. (2010) did not find that body condition affected response to treatment, Beale and Monaghan (2004) found that body condition affected the response of seabirds to human disturbance. They altered the body condition of birds at different sites by providing extra food for several days leading up to a standardized disturbance. Then the authors recorded a set of response variables to a disturbance event, such as flush distance (the distance from the disturbance when the birds leave their location). Interestingly, they found that birds with better body condition responded earlier to the disturbance (i.e., when the disturbance was farther away) than birds with poorer body condition (Figure 1). The authors suggest that this was because individuals with better body condition could afford to respond sooner to a disturbance, while individuals with poorer body condition could not afford to stop foraging and move away, and therefore did not show a behavioral response. I emphasize behavioral response because it would have been interesting to monitor the vital rates of the birds during the experiment; maybe the birds’ heart rates increased even though they did not move away. This finding is important when evaluating disturbance effects and management approaches because it demonstrates the importance of considering body condition when evaluating impacts: animals that are in the worst condition, and therefore the individuals that are most vulnerable, may appear to be undisturbed when in reality they tolerate the disturbance because they cannot afford the energy or time to move away.

Figure 1.  Figure showing flush distance of birds that were fed (good body condition) and unfed (poor body condition).

These two studies are examples of body condition affecting behavior. However, a study on the effect of habitat deterioration on lizards showed that behavior can also affect body condition. To study this effect, Amo et al. (2007) compared the behavior and body condition of lizards in ski slopes to those in natural areas. They found that habitat deterioration led to an increased perceived risk of predation, which led to an increase in movement speed when crossing these deteriorated, “risky”, areas. In turn, this elevated movement cost led to a decrease in body condition (Figure 2). Hence, the lizard’s behavior affected their body condition.


Figure 2. Figure showing the difference in body condition of lizards in natural and deteriorated habitats.

Together, these case studies provide an interesting overview of the potential answers to the question: does body condition affect behavior or does behavior affect body condition? The answer is that the relationship can go both ways. Ransom et al. (2004) showed that regardless of the treatment, behavior of female horses differed between body conditions, indicating that regardless of a disturbance, body condition affects behavior. Beale and Monaghan (2004) demonstrated that seabird reactions to disturbance differed between body conditions, indicating that disturbance studies should take body condition into account. And, Amo et al. (2007) showed that disturbance affects behavior, which consequently affects body condition.

Looking at the results from these three studies, I can envision finding similar results in my gray whale research. I hypothesize that gray whale behavior varies by body condition in everyday circumstances and when the whale is disturbed. Yet, I also hypothesize that being disturbed will affect gray whale behavior and subsequently their body condition. Therefore, what I anticipate based on these studies is a circular relationship between behavior and body condition of gray whales: if an increase in perceived risk affects behavior and then body condition, maybe those affected individuals with poor body condition will respond differently to the disturbance. It is yet to be determined if a sequence like this could ever be detected, but I think that it is important to investigate.

Reading through these studies, I am ready and eager to start digging into these hypotheses with our data. I am especially excited that I will be able to perform this investigation on an individual level because we have identified the whales in each drone video. I am confident that this work will lead to some interesting and important results connecting behavior and health, thus opening avenues for further investigations to improve conservation studies.

References

Beale, Colin M, and Pat Monaghan. 2004. “Behavioural Responses to Human Disturbance: A Matter of Choice?” Animal Behaviour 68 (5): 1065–69. https://doi.org/10.1016/j.anbehav.2004.07.002.

Ransom, Jason I, Brian S Cade, and N. Thompson Hobbs. 2010. “Influences of Immunocontraception on Time Budgets, Social Behavior, and Body Condition in Feral Horses.” Applied Animal Behaviour Science 124 (1–2): 51–60. https://doi.org/10.1016/j.applanim.2010.01.015.

Amo, Luisa, Pilar López, and José Martín. 2007. “Habitat Deterioration Affects Body Condition of Lizards: A Behavioral Approach with Iberolacerta Cyreni Lizards Inhabiting Ski Resorts.” Biological Conservation 135 (1): 77–85. https://doi.org/10.1016/j.biocon.2006.09.020.

The teamwork of conservation science

Dr. Leigh Torres
PI, Geospatial Ecology of Marine Megafauna Lab, Marine Mammal Institute
Assistant Professor, Oregon Sea Grant, Department of Fisheries and Wildlife, Oregon State University

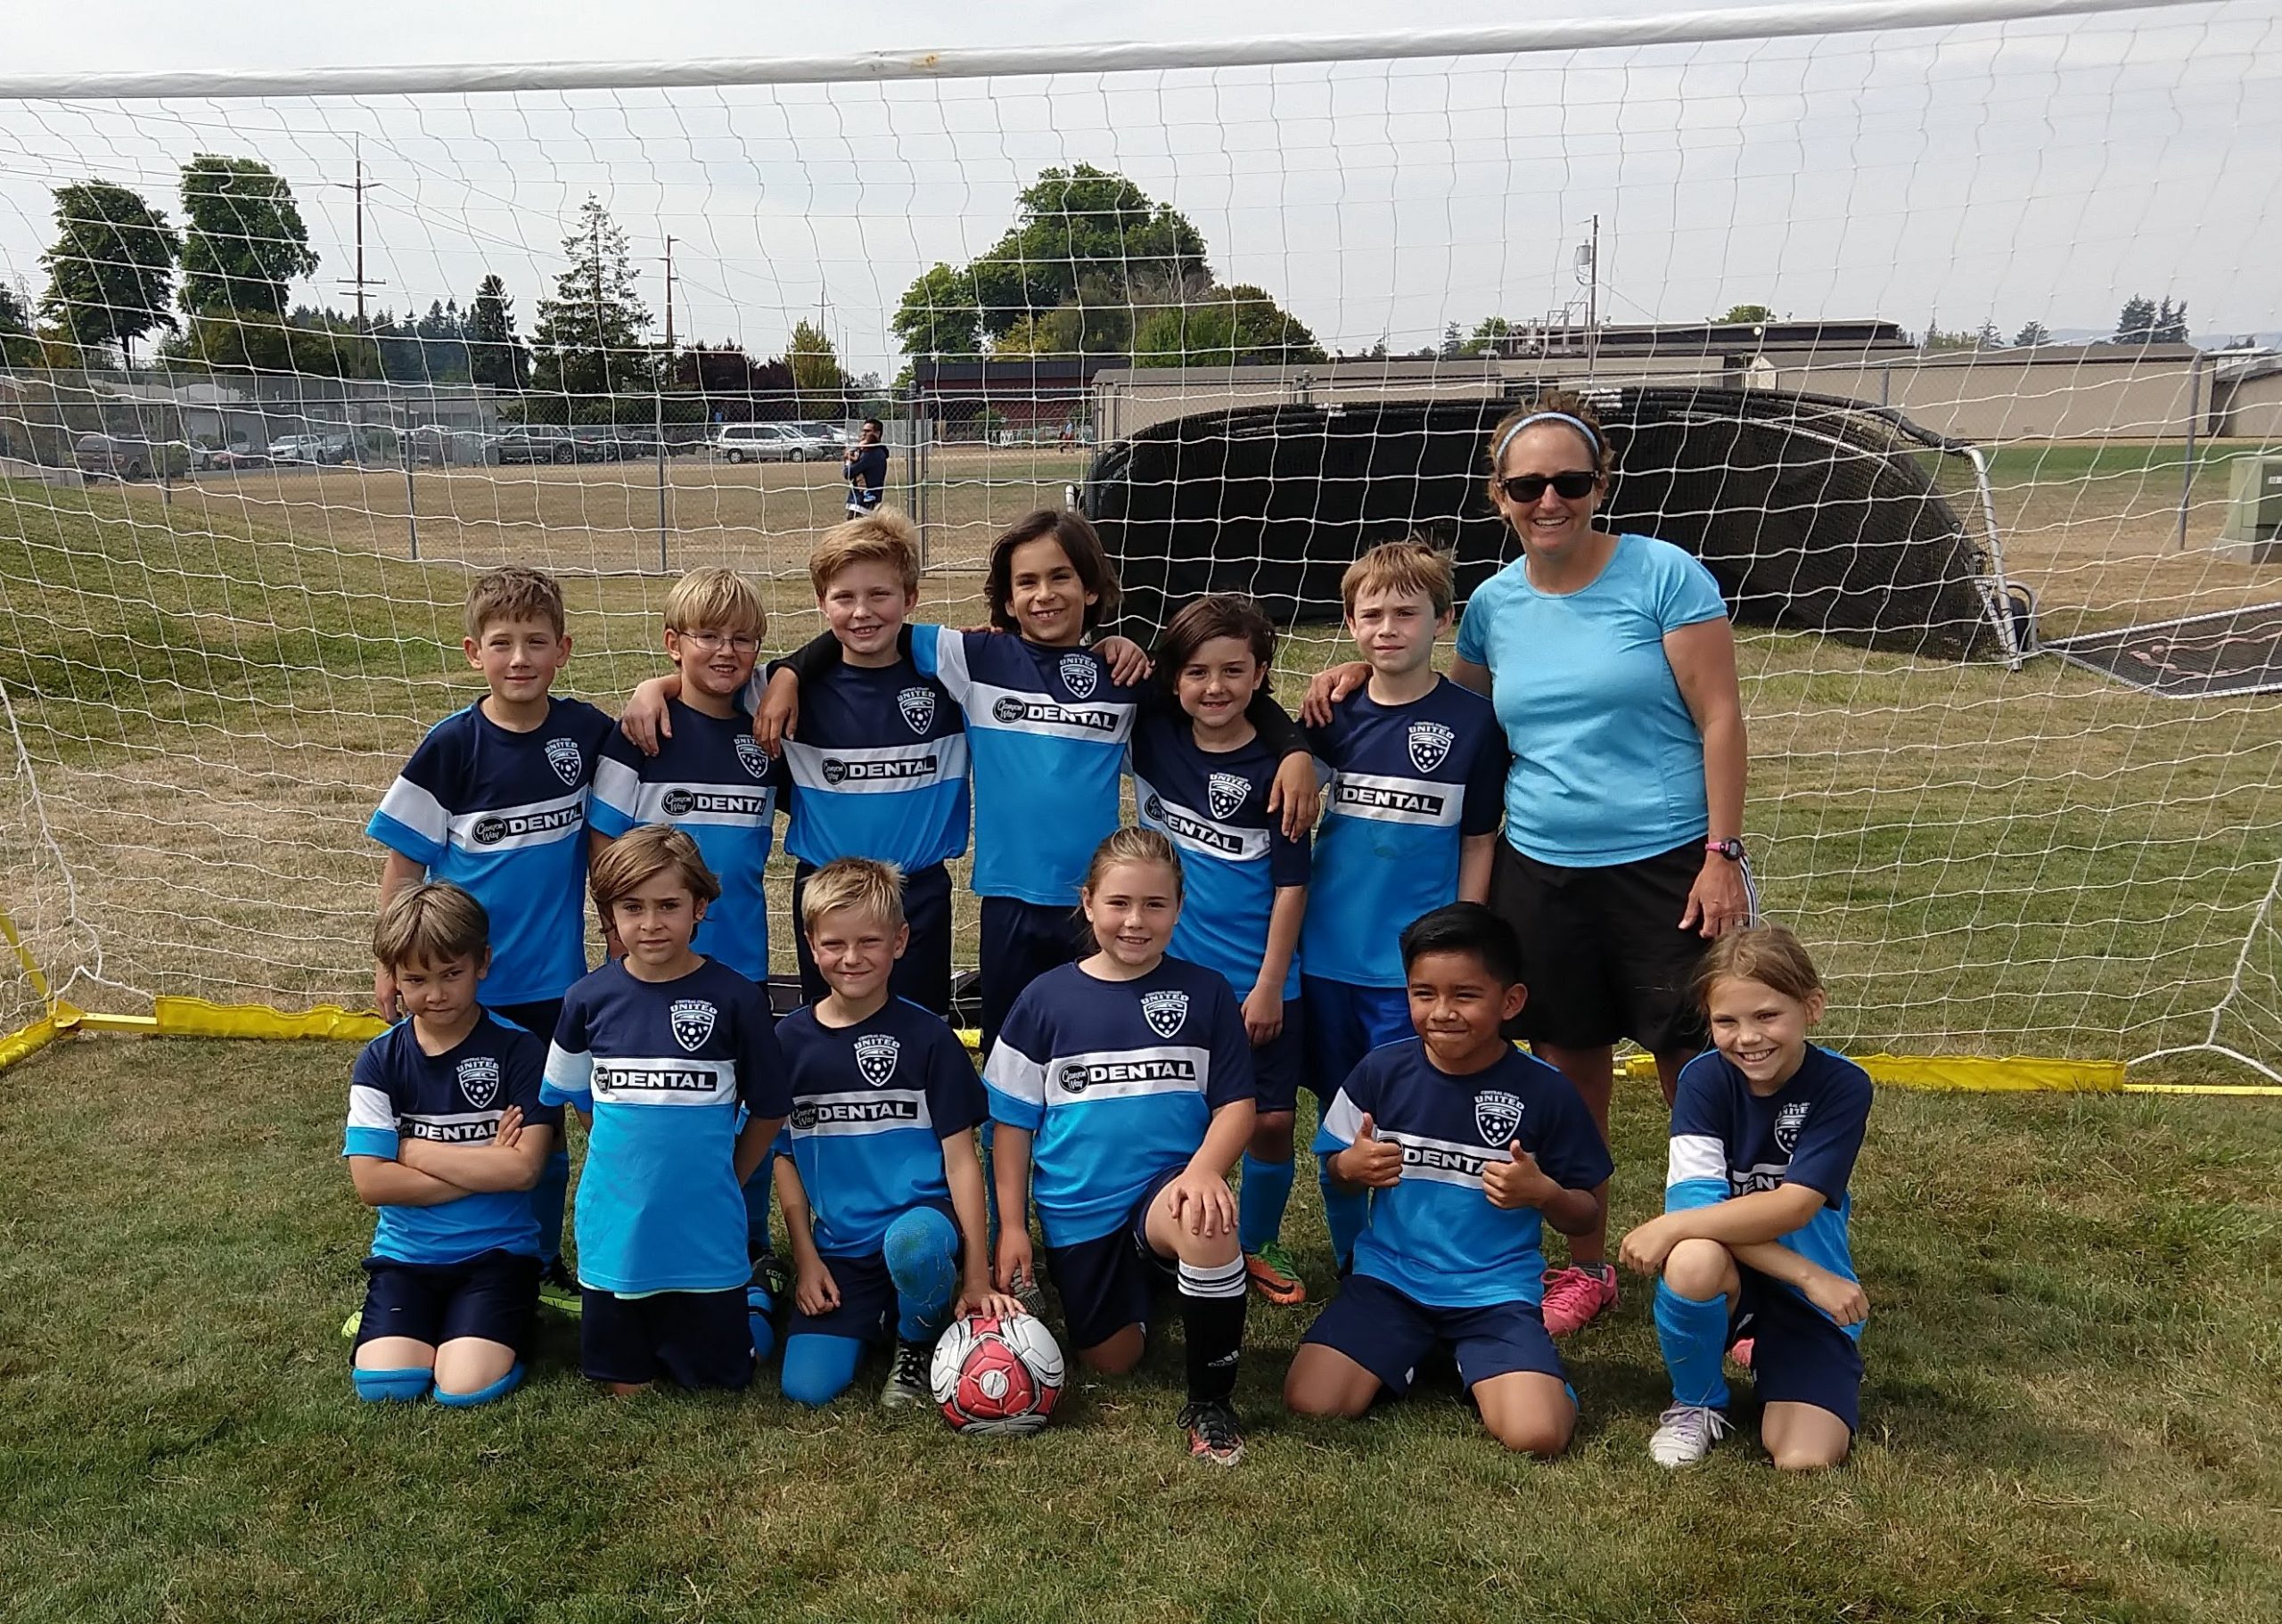
I have played on sports teams all my life – since I was four until present day. Mostly soccer teams, but a fair bit of Ultimate too. Teams are an interesting beast. They can be frustrating when communication breaks down, irritating when everyone is not on the same timeline, and disastrous if individuals do not complete their designated job. Yet, without the whole team we would never win. So, on top of the fun of competition, skill development, and exercise, playing on teams has always been part of the challenging and fulfilling process for me: everyone working toward the same goal – to win – by making the team fluid, complimentary, integrated, and ultimately successful.

I have come to learn that it is the same with conservation science.

A few of my teams through the ages, as player and coach. Some of my favorite people are on these teams, from 1981 to 2018.

Conservation efforts are often so complex, that it is practically impossible to achieve success alone. Forces driving the need for conservation typically include monetary needs/desires, social values, ecological processes, animal physiology, multi-jurisdictional policies, and human behavior. Each one of these forces alone is challenging to understand and takes expertise to comprehend the situation. Hence, building a well-functioning team is essential. Here’s a recent example from the GEMM Lab:

Since 2014 entanglements of blue, humpback and gray whales in fishing gear along the west coast of the USA have dramatically increased, particularly in Dungeness crab fishing gear. Many forces likely led to this increase, including increased whale population abundance, potential shifts in whale distributions, and changes in fishing fleet dynamics. While we cannot point a finger at one cause, many people and groups recognize that we cannot continue to let whales become entangled and killed at such high rates: whale populations would decline, fisheries would look bad in the public eye and potentially lose profits, whales have an intrinsic right to live in the ocean without being bycaught, and whales are an important part of the ecosystem that would deteriorate without them. In 2017, the Oregon Whale Entanglement Working Group was formed to bring stakeholders together that were concerned about this problem to discuss possible solutions and paths forward. I was lucky to be a part of this group, which also included members of the Dungeness crab fishery and commission, the Oregon Department of Fish and Wildlife (ODFW), other marine mammal scientists, and representatives of the American Cetacean Society, The Nature Conservancy, and a local marine gear supplier.

We met regularly over 2.5 years, and despite some hesitation at first about walking into a room of potentially disgruntled fishermen (I would be lying if I did not admit to this), after the first meeting I looked forward to every gathering. I learned an immense amount about the Dungeness crab fishery and how it operates, how ODFW manages the fishery and why, and what people do, don’t and need to know about whales in Oregon. Everyone agreed that reducing whale entanglements is needed, and a frequent approach discussed was to reduce risk by not setting gear where and when we expect whales to be. Yet, this idea flagged a very critical knowledge gap: We do not have a good understanding of whale distribution patterns in Oregon. Thus leading to the development of a highly collaborative research effort to describe whale distribution patterns in Oregon and identify areas of co-occurrence between whales and fishing effort to reduce the risk of entanglements. Sounds great, but a tough task to accomplish in a few short years. So, let me introduce the great team I am working with to make it all happen.

While I may know a few things about whales and spatial ecology, I don’t know too much about fisheries in Oregon. My collaboration with folks at ODFW, particularly Kelly Corbett and Troy Buell, has enabled this project to develop and go forward, and ultimately will lead to success. These partners provide feedback about how and where the fishery operates so I know where and when to collect data, and importantly they will provide the information on fishing effort in Oregon waters to relate to our generated maps of whale distribution. This spatial comparison will produce what is needed by managers and fishermen to make informed and effective decisions about where to fish, and not to fish, so that we reduce whale entanglement risk while still harvesting successfully to ensure the health and sustainability of our coastal economies.

So, how can we collect standardized data on whale distribution in Oregon waters without breaking the bank? I tossed this question around for a long time, and then I looked up to the sky and wondered what that US Coast Guard (USCG) helicopter was flying around for all the time. I reached out to the USCG to enquire, and proposed that we have an observer fly in the helicopter with them along a set trackline during their training flights. Turns out the USCG Sector North Bend and Columbia River were eager to work with us and support our research. They have turned out to be truly excellent partners in this work. We had some kinks to work out at the beginning – lots of acronyms, protocols, and logistics for both sides to figure out – but everyone has been supportive and pleasant to work with. The pilots and crew are interested in our work and it is a joy to hear their questions and see them learn about the marine ecosystem. And our knowledge of helicopter navigation and USCG duties has grown astronomically.

On the left is a plot of the four tracklines we survey for whales each month for two years aboard a US Coast Guard helicopter. On the right are some photos of us in action with our Coast Guard partners.

Despite significant cost savings to the project through our partnership with the USCG, we still need funds to support time, gear and more. And full credit to the Oregon Dungeness Crab Commission for recognizing the value and need for this project to support their industry, and stepping up to fund the first year of this project. Without their trust and support the project may not have got off the ground. With this support in our back pocket and proof of our capability, ODFW and I teamed up to approach the National Oceanographic and Atmospheric and Administration (NOAA) for funds to support the remaining years of the project. We found success through the NOAA Fisheries Endangered Species Act Section 6 Program, and we are now working toward providing the information needed to protect endangered and threatened whales in Oregon waters.

Despite our cost-effective and solid approach to data collection on whale occurrence, we cannot be everywhere all the time looking for whales. So we have also teamed up with Amanda Gladics at Oregon Sea Grant to help us with an important outreach and citizen science component of the project. With Amanda we have developed brochures and videos to inform mariners of all kinds about the project, objectives, and need for them to play a part. We are encouraging everyone to use the Whale Alert app to record their opportunistic sightings of whales in Oregon waters. These data will help us build and test our predictive models of whale distribution. Through this partnership we continue important conversations with fishermen from many fisheries about their concerns, where they are seeing whales, and what needs to be done to solve this complex conservation challenge.  

Of course I cannot collect, process, analyze, and interpret all this data on my own. I do not have the skills or capacity for that. My partner in the sky is Craig Hayslip, a Faculty Research Assistant in the Marine Mammal Institute. Craig has immense field experience collecting data on whales and is the primary observer on the survey flights. Together we have navigated the USCG world and developed methods to collect our data effectively and efficiently (all within a tiny space flying over the ocean). In a few months we will be ¾ of the way through our data collection phase, which means data analysis will take over. For this phase I am bringing back a GEMM Lab star, Solene Derville, who recently completed her PhD. As the post-doc on the project, Solene will take the lead on the species distribution modeling and fisheries overlap analysis. I am looking forward to partnering with Solene again to compile multiple data sources on whales and oceanography in Oregon to produce reliable and accurate predictions of whale occurrence and entanglement risk. Finally I want to acknowledge our great partners at the Cascadia Research Collective (Olympia, WA) and the Cetacean Conservation and Genomics Lab (OSU, Marine Mammal Institute) who help facilitate our data collection, and conduct the whale photo-identification or genetic analyses to determine population assignment.  

As you can see, even this one, smallish, conservation research project takes a diverse team of partners to proceed and ensure success. On this team, my position is sometimes a player, coach, or manager, but I am always grateful for these amazing collaborations and opportunities to learn. I am confident in our success and will report back on our accomplishments as we wrap up this important and exciting conservation science project.   

A fin whale observed off the Oregon coast during one of our surveys aboard a US Coast Guard helicopter.

What are the ecological impacts of gray whale benthic feeding?

Clara Bird, Masters Student, OSU Department of Fisheries and Wildlife, Geospatial Ecology of Marine Megafauna Lab

Happy new year from the GEMM lab! Starting graduate school comes with a lot of learning. From skills, to learning about how much there is to learn, to learning about the system I will be studying in depth for the next few years. This last category has been the most exciting to me because digging into the literature on a system or a species always leads to the unearthing of some fascinating and surprising facts. So, for this blog I will write about one of the aspects of gray whale foraging that intrigues me most: benthic feeding and its impacts.

How do gray whales feed?

Gray whales are a unique species. Unlike other baleen whales, such as humpback and blue whales, gray whales regularly feed off the bottom of the ocean (Nerini, 1984). They roll to one side and swim along the bottom, they then suction up (by depressing their tongue) the sediment and prey, then the sediment and water is filtered out of the baleen. In fact, we use sediment streams, shown in Figure 1, as an indicator of benthic feeding behavior when analyzing drone footage (Torres et al. 2018).

Figure 1. Screenshot of drone video showing sediment streaming from mouth of a whale after benthic feeding. Video taken under NOAA/NMFS permit #21678

Locations of benthic feeding can be identified without directly observing a gray whale actively feeding because of the excavated pits that result from benthic feeding (Nerini 1984). These pits can be detected using side-scan sonar that is commonly used to map the seafloor. Oliver and Slattery (1985) found that the pits typically are from 2-20 m2. In some of the imagery, consecutive neighboring pits are visible, likely created by one whale in series during a feeding event. Figure 2 shows different arrangements of pits.

Figure 2. Different arrangements of pits created by feeding whales (Nerini 1984).

Aside from how fascinating the behavior is, benthic feeding is also interesting because it has a large impact on the environment. Coming from a background of studying baleen whales that primarily feed on krill, I had not really considered the potential impacts of whale foraging other than removing prey from the environment. However, when gray whales feed, they excavate large areas of the benthic substrate that disturb and impact the habitat.

The impacts of benthic feeding

Weitkamp et al. (1992) conducted a study on gray whale benthic foraging on ghost shrimp in Puget Sound, WA, USA. This study, conducted over two years, focused on measuring the impact of benthic foraging by its effect on prey abundance. They found that the standing stock of ghost shrimp within a recently excavated pit was two to five times less than that outside the pit, and that 3100 to 5700 grams of shrimp can be removed per pit. From aerial surveys they estimated that within one season feeding gray whales created between 2700 and 3200 pits. Using these values, they calculated that 55 to 79% of the standing stock of ghost shrimp was removed each season by foraging gray whales. Interestingly, they found that the shrimp biomass within an excavated pit recovered within about two months.

Oliver and Slattery (1985) also found a recovery period of about 2 months per pit in their study on the effect of gray whale benthic feeding on the prey community in the Bering Sea. They sampled prey within and outside feeding excavations, both actual whale pits and man-made, to test the response of the benthic community to the disturbance of a feeding event. They found that after the initial feeding disturbance, the excavated area was rapidly colonized by scavenging lysianassid amphipods, which are small (10 mm) crustaceans that typically eat dead organic material. These amphipods rushed in and attacked the organisms that were injured or dislodged by the whale feeding event, typically small crustaceans and polychaete worms. Within hours of the whale feeding event, these amphipods had dispersed and a different genre of scavenging lysianassid amphipods slowly invaded the excavated pit further and stayed much longer. After a few days or weeks these pits collected and trapped organic debris that attracted more colonists. Indeed, they found that the number of colonists remained elevated within the excavated areas for over two months.

Notably, these results on how the disturbance of gray whale benthic feeding changes sediment composition support the idea that this foraging behavior maintains the sand substrate and therefore helps to maintain balanced levels of benthic dwelling amphipods, their primary source of prey in this study area (Johnson and Nelson, 1984). Gray whales scour the sea floor when they feed and this process leads to the resuspension of lots of sediments and nutrients that would otherwise remain on the seafloor. Therefore, while this feeding may seem like a violent disturbance, it may in fact play a large role in benthic productivity (Johnson and Nelson, 1984; Oliver and Slattery, 1985).

These ecosystem impacts of gray whale benthic feeding I have described above demonstrate the various stages of invaders after a feeding disturbance, and the process of succession. Succession is the ecological process of how a community structure builds and grows. Primary succession is when the structure grows from truly nothing and secondary succession occurs after a disturbance, such as a fire. In secondary succession, there are typically pioneer species that first appear and then give way to other species and a more complex community eventually emerges. Succession is well documented in many terrestrial studies after disturbance events, and the processes of secondary succession is very important to community ecology and resilience.

Since gray whale benthic foraging does not impact an entire habitat all at once, the process is not perfectly comparable to secondary succession in terrestrial systems. Yet, when thinking about the smaller scale, another example of succession in the marine environment takes place at a whale fall. When a whale dies and sinks to the ocean floor, a small ecosystem emerges. Different organisms arrive at different stages to scavenge different parts of the carcass and a food web is created around it.

To me the impacts of gray whale benthic feeding are akin to both terrestrial disturbance events and whale falls. The excavation serves as a disturbance, and through secondary succession the habitat is refreshed via stages of different species colonization until the system eventually returns to the pre-disturbance levels. However, like a whale fall the feeding event leaves behind injured or displaced organisms that scavengers consume; in fact seabirds are known to take advantage of benthic invertebrates that are brought to the surface by a gray whale feeding event (Harrison, 1979). 

So much of our research is focused on questions about how the changing environment impacts our study species and not the other way around. This venture into the literature has provided me with an important reminder to think about flipping the question. I have enjoyed starting 2020 with a reminder of how cool gray whales are, and that while a disturbance can initially be thought of as negative, it may actually bring about important, and positive, change.

References

Nerini, Mary. 1984. “A Review of Gray Whale Feeding Ecology.” In The Gray Whale: Eschrichtius Robustus, 423–50. Elsevier Inc. https://doi.org/10.1016/B978-0-08-092372-7.50024-8.

Oliver, J. S., and P. N. Slattery. 1985. “Destruction and Opportunity on the Sea Floor: Effects of Gray Whale Feeding.” Ecology 66 (6): 1965–75. https://doi.org/10.2307/2937392.

Torres, Leigh G., Sharon L. Nieukirk, Leila Lemos, and Todd E. Chandler. 2018. “Drone up! Quantifying Whale Behavior from a New Perspective Improves Observational Capacity.” Frontiers in Marine Science 5 (SEP). https://doi.org/10.3389/fmars.2018.00319.

Weitkamp, Laurie A, Robert C Wissmar, Charles A Simenstad, Kurt L Fresh, and Jay G Odell. 1992. “Gray Whale Foraging on Ghost Shrimp (Callianassa Californiensis) in Littoral Sand Flats of Puget Sound, USA.” Canadian Journal of Zoology 70 (11): 2275–80. https://doi.org/10.1139/z92-304.

Johnson, Kirk R., and C. Hans Nelson. 1984. “Side-Scan Sonar Assessment of Gray Whale Feeding in the Bering Sea.” Science 225 (4667): 1150–52.

Harrison, Craig S. 1979. “The Association of Marine Birds and Feeding Gray Whales.” The Condor 81 (1): 93. https://doi.org/10.2307/1367866.

Barcelona-bound! The GEMM Lab heads to the World Marine Mammal Conference

By Dawn Barlow, PhD student, OSU Department of Fisheries and Wildlife, Geospatial Ecology of Marine Megafauna Lab

Every two years, an international community of scientists, managers, policy-makers, educators, and students gather to share the most current research and most pressing conservation issues facing marine mammals. This year, the World Marine Mammal Conference will take place in Barcelona, Spain from December 7-12, and the whole GEMM Lab will make their way across the Atlantic to present their latest work. The meeting is an international gathering of scientists ranging from longtime researchers who have shaped the field throughout the course of their careers to students who are just beginning to carve out a niche of their own. This year’s conference has 2,500 registered attendees from 95 different countries, 1,960 abstract submissions, and 700 accepted oral and speed talks and 1,200 posters. Needless to say, it is an incredible platform for learning, networking, and putting our work in the context of research taking place around the globe.

This will be my third time at this conference. I attended in San Francisco in 2015 as a wide-eyed undergraduate and met with Leigh, who I hoped would soon become my graduate advisor. I also presented my Masters research at the conference in Halifax in 2017. This time around, I will be presenting findings from the first two chapters of my PhD. Looking ahead to the Barcelona 2019 meeting and having some sense of what to expect, I feel butterflies rising in my stomach—a perfect mixture of the nerves that come with putting your hard work out in the world, eagerness to learn and absorb new information, and excitement to reconnect with friends and colleagues from around the world. In short, I can’t wait!

For those of you reading this blog that are unable to attend, I’d like to share an overview of what the GEMM Lab will be presenting at the conference. If you will be in Barcelona, we warmly invite you to the following posters, speed talks, and oral presentations! In order of appearance:

Lisa Hildebrand, MS Student

What do Oregon gray whales like to eat? Do individual whales have individual foraging habits? To learn more visit Lisa Hildebrand’s poster “Investigating potential gray whale individual foraging specializations within the Pacific Coast Feeding Group”. (Poster presentation, Session: Foraging Ecology – Group A, Time: Monday, 1:30-3:00pm)

Todd Chandler, Faculty Research Assistant

Did you know it is possible to measure the mechanics of how a blue whale feeds using a drone? The GEMM Lab’s all-star drone pilot Todd Chandler will present a poster titled “More than snacks: An analysis of drone observed blue whale surface lunge feeding linked with prey data”. (Poster presentation, Session: Foraging Ecology – Group A, Time: Monday, 1:30-3:00pm)

Clara Bird, MS Student

The GEMM Lab’s newest student Clara Bird will present a poster on work she conducted with the Marine Robotics and Remote Sensing lab at Duke University using new technologies and approaches to investigate scarring patterns on humpbacks. Her poster is titled “A comparison of percent dorsal scar cover between populations of humpback whales (Megaptera novaeangliae) off California and the Western Antarctic Peninsula”. (Poster presentation, Session: New Technology  – Group B, Time: Tuesday, 8:30-9:45am)

Dr. Leigh Torres, Principal Investigator

GEMM Lab PI Leigh Torres will synthesize some exciting new analyses from the GEMM Lab’s gray whale physiology and ecology research off the Oregon Coast. Is it stressful to feed in a noisy coastal environment? Leigh will discuss the latest findings in her talk, “Sounds of stress: Evaluating the relationships between variable soundscapes and gray whale stress hormones”. (Oral presentation, Session: Physiology, Time: Tuesday, 11:30-11:45am)

Leila Lemos, PhD Student

Carrying on with exciting new findings about Oregon gray whales, Leila Lemos will present a speed talk titled “Stressed and slim or relaxed and chubby? A simultaneous assessment of gray whale body condition and hormone variability”, in which she will summarize three years of analysis of how gray whale health can be quantified, and how physiology is influenced by ocean conditions. (Speed talk, Session: Physiology, Time: Tuesday, 11:55am-12:m)

Dawn Barlow, PhD Student

Can we predict where blue whales will be using our understanding of their environment and prey? Can this knowledge be used for effective conservation? I (Dawn Barlow) will give a presentation titled “Cloudy with a chance of whales: Forecasting blue whale occurrence based on tiered, bottom-up models to mitigate industrial impacts”, which will share our latest findings on how functional ecological relationships can be modeled in changing ocean conditions. (Oral presentation, Session: Habitat and Distribution I, Time: Wednesday, 10:15-10:30am)

Dr. Solene Derville, Post-Doctoral Scholar

The GEMM Lab’s most recent graduate Solene Derville will present work she has conducted in New Caledonia regarding humpback whale diving and movement patterns around breeding grounds. Her speed talk is titled “Whales of the deep: Horizontal and vertical movements shed light on humpback whale use of critical pelagic habitats in the western South Pacific” (Speed talk, Session: Behavioral Ecology II, Time: Wednesday, 11:35-11:40am)

Dominique Kone, MS Student

Can sea otters make a comeback in Oregon after a long absence? Dom Kone takes a comprehensive look at how Oregon coast habitat could support a reintroduced sea otter population in his speed talk, “An evaluation of the ecological needs and effects of a potential sea otter reintroduction to Oregon, USA”. (Speed talk, Session: Conservation II, Time: Wednesday, 2:45-2:50pm)

Alexa Kownacki, PhD Student

Alexa Kownacki will share her latest findings on dolphin distribution relative to static and dynamic oceanographic variables in her speed talk titled “The biogeography of common bottlenose dolphins (T. truncatus) of the southwestern USA and Mexico”. (Speed talk, Session: Habitat and Distribution II, Time: Wednesday, 3:35-3:40pm)

Other members of the Marine Mammal Mnstitute who will present their work include: Scott Baker, Debbie Steel, Angie Sremba, Karen Lohman, Daniel Palacios, Bruce Mate, Ladd Irvine, and Robert Pitman. For anyone planning to attend, we look forward to seeing you there! For those who wish to stay tuned from home, keep your eye on the GEMM Lab twitter page for our updates during the conference and follow the conference hashtag #WMMC19, and look forward to future blog posts recapping the experience.

Classifying cetacean behavior

Clara Bird, Masters Student, OSU Department of Fisheries and Wildlife, Geospatial Ecology of Marine Megafauna Lab

The GEMM lab recently completed its fourth field season studying gray whales along the Oregon coast. The 2019 field season was an especially exciting one, we collected rare footage of several interesting gray whale behaviors including GoPro footage of a gray whale feeding on the seafloor, drone footage of a gray whale breaching, and drone footage of surface feeding (check out our recently released highlight video here). For my master’s thesis, I’ll use the drone footage to analyze gray whale behavior and how it varies across space, time, and individual. But before I ask how behavior is related to other variables, I need to understand how to best classify the behaviors.

How do we collect data on behavior?

One of the most important tools in behavioral ecology is an ‘ethogram’. An ethogram is a list of defined behaviors that the researcher expects to see based on prior knowledge. It is important because it provides a standardized list of behaviors so the data can be properly analyzed. For example, without an ethogram, someone observing human behavior could say that their subject was walking on one occasion, but then say strolling on a different occasion when they actually meant walking. It is important to pre-determine how behaviors will be recorded so that data classification is consistent throughout the study. Table 1 provides a sample from the ethogram I use to analyze gray whale behavior. The specificity of the behaviors depends on how the data is collected.

Table 1. Sample from gray whale ethogram. Based on ethogram from Torres et al. (2018).

In marine mammal ecology, it is challenging to define specific behaviors because from the traditional viewpoint of a boat, we can only see what the individuals are doing at the surface. The most common method of collecting behavioral data is called a ‘focal follow’. In focal follows an individual, or group, is followed for a set period of time and its behavioral state is recorded at set intervals.  For example, a researcher might decide to follow an animal for an hour and record its behavioral state at each minute (Mann 1999). In some studies, they also recorded the location of the whale at each time point. When we use drones our methods are a little different; we collect behavioral data in the form of continuous 15-minute videos of the whale. While we collect data for a shorter amount of time than a typical focal follow, we can analyze the whole video and record what the whale was doing at each second with the added benefit of being able to review the video to ensure accuracy. Additionally, from the drone’s perspective, we can see what the whales are doing below the surface, which can dramatically improve our ability to identify and describe behaviors (Torres et al. 2018).

Categorizing Behaviors

In our ethogram, the behaviors are already categorized into primary states. Primary states are the broadest behavioral states, and in my study, they are foraging, traveling, socializing, and resting. We categorize the specific behaviors we observe in the drone videos into these categories because they are associated with the function of a behavior. While our categorization is based on prior knowledge and critical evaluation, this process can still be somewhat subjective.  Quantitative methods provide an objective interpretation of the behaviors that can confirm our broad categorization and provide insight into relationships between categories.  These methods include path characterization, cluster analysis, and sequence analysis.

Path characterization classifies behaviors using characteristics of their track line, this method is similar to the RST method that fellow GEMM lab graduate student Lisa Hildebrand described in a recent blog. Mayo and Marx (1990) analyzed the paths of surface foraging North Atlantic Right Whales and were able to classify the paths into primary states; they found that the path of a traveling whale was more linear and then paths of foraging or socializing whales that were more convoluted (Fig 1). I plan to analyze the drone GPS track line as a proxy for the whale’s track line to help distinguish between traveling and foraging in the cases where the 15-minute snapshot does not provide enough context.

Figure 1. Figure from Mayo and Marx (1990) showing different track lines symbolized by behavior category.

Cluster analysis looks for natural groupings in behavior. For example, Hastie et al. (2004) used cluster analysis to find that there were four natural groupings of bottlenose dolphin surface behaviors (Fig. 2). I am considering using this method to see if there are natural groupings of behaviors within the foraging primary state that might relate to different prey types or habitat. This process is analogous to breaking human foraging down into sub-categories like fishing or farming by looking for different foraging behaviors that typically occur together.

Figure 2. Figure from Hastie et al. (2004) showing the results of a hierarchical cluster analysis.

Lastly, sequence analysis also looks for groupings of behaviors but, unlike cluster analysis, it also uses the order in which behaviors occur. Slooten (1994) used this method to classify Hector’s dolphin surface behaviors and found that there were five classes of behaviors and certain behaviors connected the different categories (Fig. 3). This method is interesting because if there are certain behaviors that are consistently in the same order then that indicates that the order of events is important. What function does a specific sequence of behaviors provide that the behaviors out of that order do not?

Figure 3. Figure from Slooten (1994) showing the results of sequence analysis.

Think about harvesting fruits and vegetables from a garden: the order of how things are done matters and you might use different methods to harvest different kinds of produce. Without knowing what food was being harvested, these methods could detect that there were different harvesting methods for different fruits or veggies. By then studying when and where the different methods were used and by whom, we could gain insight into the different functions and patterns associated with the different behaviors. We might be able to detect that some methods were always used in certain habitat types or that different methods were consistently used at different times of the year.

Behavior classification methods such as these described provide a more refined and detailed analysis of categories that can then be used to identify patterns of gray whale behaviors. While our ultimate goal is to understand how gray whales will be affected by a changing environment, a comprehensive understanding of their current behavior serves as a baseline for that future study.

References

Burnett, J. D., Lemos, L., Barlow, D., Wing, M. G., Chandler, T., & Torres, L. G. (2019). Estimating morphometric attributes of baleen whales with photogrammetry from small UASs: A case study with blue and gray whales. Marine Mammal Science, 35(1), 108–139. https://doi.org/10.1111/mms.12527

Darling, J. D., Keogh, K. E., & Steeves, T. E. (1998). Gray whale (Eschrichtius robustus) habitat utilization and prey species off Vancouver Island, B.C. Marine Mammal Science, 14(4), 692–720. https://doi.org/10.1111/j.1748-7692.1998.tb00757.x

Hastie, G. D., Wilson, B., Wilson, L. J., Parsons, K. M., & Thompson, P. M. (2004). Functional mechanisms underlying cetacean distribution patterns: Hotspots for bottlenose dolphins are linked to foraging. Marine Biology, 144(2), 397–403. https://doi.org/10.1007/s00227-003-1195-4

Mann, J. (1999). Behavioral sampling methods for cetaceans: A review and critique. Marine Mammal Science, 15(1), 102–122. https://doi.org/10.1111/j.1748-7692.1999.tb00784.x

Slooten, E. (1994). Behavior of Hector’s Dolphin: Classifying Behavior by Sequence Analysis. Journal of Mammalogy, 75(4), 956–964. https://doi.org/10.2307/1382477

Torres, L. G., Nieukirk, S. L., Lemos, L., & Chandler, T. E. (2018). Drone up! Quantifying whale behavior from a new perspective improves observational capacity. Frontiers in Marine Science, 5(SEP). https://doi.org/10.3389/fmars.2018.00319

Mayo, C. A., & Marx, M. K. (1990). Surface foraging behaviour of the North Atlantic right whale, Eubalaena glacialis, and associated zooplankton characteristics. Canadian Journal of Zoology, 68(10), 2214–2220. https://doi.org/10.1139/z90-308

What is that whale doing? Only residence in space and time will tell…

By Lisa Hildebrand, MSc student, OSU Department of Fisheries and Wildlife, Geospatial Ecology of Marine Megafauna Lab

For my research in Port Orford, my field team and I track individual gray whales continuously from a shore-based location: once we spot a whale we will track it for the entire time that it remains in our study site. The time spent tracking a whale can vary widely. In the 2018 field season, our shortest trackline was three minutes, and our longest track was over three hours in duration.

This variability in foraging time is partly what sparked my curiosity to investigate potential foraging differences between individuals of the Pacific Coast Feeding Group (PCFG) gray whales. I want to know why some individuals, like “Humpy” who was our longest tracked individual in 2018, stayed in an area for so long, while others, like “Smokey”, only stayed for three minutes (Figure 1). It is hard to pinpoint just one variable that drives these decisions (e.g., prey, habitat) made by individuals about where they forage and how long because the marine environment is so dynamic. Foraging decisions are likely dictated by several factors acting in concert with one another. As a result, I have many research questions, including (but certainly not limited to):

  1. Does prey density drive length of individual foraging bouts?
  2. Do individual whales have preferences for a particular prey species?
  3. Are prey patches containing gravid zooplankton targeted more by whales?
  4. Do whales prefer to feed closer to kelp patches?
  5. How does water depth factor into all of the above decisions and/or preferences? 

I hope to get to the bottom of these questions through the data analyses I will be undertaking for my second chapter of my Master’s thesis. However, before I can answer those questions, I need to do a little bit of tidying up of my whale tracklines. Now that the 2019 field season is over and I have all of the years of data that I will be analyzing for my thesis (2015-2019), I have spent the past 1-2 weeks diving into the trackline clean-up and analysis preparation.

The first step in this process is to run a speed filter over each trackline. The aim of the speed filter is to remove any erroneous points or outliers that must be wrong based on the known travel speeds of gray whales. Barb Lagerquist, a Marine Mammal Institute (MMI) colleague who has tracked gray whales for several field seasons, found that the fastest individual she ever encountered traveled at a speed of 17.3 km/h (personal communication). Therefore, based on this information,  my tracklines are run through a speed filter set to remove any points that suggest that the whale traveled at 17.3 km/h or faster (Figure 2). 

Fig 3. Trackline of “Humpy” after interpolation. The red points are interpolated.

Next, the speed-filtered tracklines are interpolated (Figure 3). Interpolation fills spatial and/or temporal gaps in a data set by evenly spacing points (by distance or time interval) between adjacent points. These gaps sometimes occur in my tracklines when the tracking teams misses one or several surfacings of a whale or because the whale is obscured by a large rock. 

After speed filtration and interpolation has occurred, the tracklines are ready to be analyzed using Residence in Space and Time (RST; Torres et al. 2017) to assign behavior state to each location. The questions I am hoping to answer for my thesis are based upon knowing the behavioral state of a whale at a given location and time. In order for me to draw conclusions over whether or not a whale prefers to forage by a reef with kelp rather than a reef without kelp, or whether it prefers Holmesimysis sculpta over Neomysis rayii, I need to know when a whale is actually foraging and when it is not. When we track whales from our cliff site, we assign a behavior to each marked location of an individual. It may sound simple to pick the behavior a whale is currently exhibiting, however it is much harder than it seems. Sometimes the behavioral state of a whale only becomes apparent after tracking it for several minutes. Yet, it’s difficult to change behaviors retroactively while tracking a whale and the qualitative assignment of behavior states is not an objective method. Here is where RST comes in.

Those of you who have been following the blog for a few years may recall a post written in early 2017 by Rachael Orben, a former post-doc in the GEMM Lab who currently leads the Seabird Oceanography Lab. The post discussed the paper “Classification of Animal Movement Behavior through Residence in Space Time” written by Leigh and Rachael with two other collaborators, which had just been published a few days prior. If you want to know the nitty gritty of what RST is and how it works, I suggest reading Rachael’s blog, the GEMM lab’s brief description of the project and/or the actual paper since it is an open-access publication. However, in a nut shell, RST allows a user to identify three primary behavioral states in a tracking dataset based on the time and distance the individual spent within a given radius. The three behavioral categories are as follows:

Fig 4. Visualization of the three RST behavioral categories. Taken from Torres et al. (2017).
  • Transit – characterized by short time and distance spent within an area (radius of given size), meaning the individual is traveling.
  • Time-intensive – characterized by a long time spent within an area, meaning the individual is spending relatively more time but not moving much distance (such as resting in one spot). 
  • Time & distance-intensive – characterized by relatively high time and distances spent within an area, meaning the individual is staying within and moving around a lot in an area, such as searching or foraging. 

What behavior these three categories represent depends on the resolution of the data analyzed. Is one point every day for two years? Then the data are unlikely to represent resting. Or is the data 1 point every second for 1 hour? In which case travel segments may cover short distances. On average, my gray whale tracklines are composed of a point every 4-5 minutes for 1-2 hours.  Bases on this scale of tracking data, I will interpret the categories as follows: Transit is still travel, time & distance-intensive points represent locations where the whale was searching because it was moving around one area for a while, and time-intensive points represent foraging behavior because the whale has ‘found what it is looking for’ and is spending lots of time there but not moving around much anymore. The great thing about RST is that it removes the bias that is introduced by my field team when assigning behavioral states to individual whales (Figure 5). RST looks at the tracklines in a very objective way and determines the behavioral categories quantitatively, which helps to remove the human subjectivity.

While it took quite a bit of troubleshooting in R and overcoming error messages to make the codes run on my data, I am proud to have results that are interesting and meaningful with which I can now start to answer some of my many research questions. My next steps are to create interpolated prey density and distance to kelp layers in ArcGIS. I will then be able to overlay my cleaned up tracklines to start teasing out potential patterns and relationships between individual whale foraging movements and their environment. 

Literature cited

Torres, L. G., R. A. Orben, I. Tolkova, and D. R. Thompson. 2017. Classification of animal movement behavior through residence in space and time. PLoS ONE: doi. org/10.1371/journal.pone.0168513.