Measuring dolphin response to Navy sonar

By Lisa Hildebrand, MSc student, OSU Department of Fisheries and Wildlife, Geospatial Ecology of Marine Megafauna Lab

During the summer of 2017 I was an intern for Cascadia Research Collective (CRC), a non-profit organization based out of Olympia, Washington, that conducts research on marine mammal behavior, ecology, and population status along the western US coast and around Hawaii. My internship was primarily office-based and involved processing photographs of humpback and blue whales along the US west coast to add to CRC’s long-term photo-identification catalogues. However, I was asked to join a research project investigating the behavioral and physiological responses of four dolphin species in southern California (Fig. 1). The research project is a collaborative effort lead by Dr. Brandon Southall and involves researchers from CRC, Kelp Marine Research, NOAA’s Southwest Fisheries Science Center, and SR3. Since my internship with CRC, there have been three pilot efforts and one full field effort of this project, called the SOCAL Tagless Behavioral and Physiological Response Study (BPRS), and I have been a part of all of them.

The marine environment is stressed out, and so are the millions of flora and fauna that inhabit the global ocean. Humans are a big contributor to this stress. During the last few decades, we have produced more and more things that have ended up in the ocean, whether by choice or by chance. Plastic pollution has become a pervasive and persistent problem, especially after the discovery that when large plastic items are exposed to UV light and seawater they break down into smaller pieces, termed micro- and nano-plastics (Jambeck et al. 2015). Increased demand for oil and gas to supply a growing human population has led to much more marine oil and gas exploration and exploitation (World Ocean Review 2013). Since 1985, global container shipping has increased by approximately 10% annually (World Ocean Review 2010) and it is estimated that global freight demand will triple by 2050 (International Transport Forum 2019). The list of impacts is long. Our impact on the earth, of which the ocean makes up 71%, has been so extreme that expert groups suggest that a new geological epoch – the Anthropocene – needs to be declared to define the time that we now find ourselves in and the impact humanity is having on the environment (Lewis and Maslin 2015). While this term has not been officially recognized, it is irrefutable that humans have and continue to alter ecosystems, impacting the organisms within them. 

Noise is an impact often overlooked when thinking about anthropogenic effects in the marine environment, likely because we as humans do not hear much of what happens beneath the ocean surface. However, ocean noise is of particular concern for cetaceans as sound is their primary sense, both over long and short distances. Sound travels extremely efficiently underwater and therefore anthropogenic sounds can be propagated for thousands of kilometers or more (Weilgart 2007a). While it is widely agreed upon that anthropogenic noise is likely a significant stressor to cetaceans (Weilgart 2007b; Wright et al. 2007; Tyack 2008), very few studies have quantified their responses to noise to date. This knowledge gap is likely because behavioral and physiological responses to sound can be subtle, short-lived or slowly proliferate over time, hence making them hard to study. However, growing concern over this issue has resulted in more research into impacts of noise on marine mammals, including the GEMM Lab’s impacts of ocean noise on gray whales project.

The most extreme impact of sound exposure on marine mammals is death. Mass strandings of a few cetacean species have coincided in time and space with Navy sonar operations (Jepson et al. 2003; Fernández et al. 2005; Filadelfo et al. 2009). While fatal mass strandings of cetaceans are extremely troubling, they are a relatively rare occurrence. A cause for perhaps greater concern are sub-lethal changes in important behaviors such as feeding, social interactions, and avoidance of key habitat as a result of exposure to Navy sonar. All of these potential outcomes have raised interest within the U.S. Navy to better understand the responses of cetaceans to sonar. 

The SOCAL Tagless BPRS is just one of several studies that has been funded by the U.S. Office of Naval Research to improve our understanding of Navy sonar impact on cetaceans, in particular the sub-lethal effects described earlier. It builds upon knowledge and expertise gained from previous behavioral response studies led by Dr. Southall on a variety of marine mammal species, including beaked whales, baleen whales, and sperm whales. Those efforts included deploying tags on individual whales to obtain high-resolution movement and passive acoustic data paired with controlled exposure experiments (CEEs) during which simulated Navy mid-frequency active sonar (MFAS) or real Navy sonar were employed. Results from that multi-year effort have shown that for blue whales, responses generally only lasted for as long as the sound was active and highly dependent on exposure context such as behavioral state, prey availability and the horizontal distance between the sound source and the individual whale. Blue whales identified as feeding in shallow depths showed no changes in behavior, however over 50% of deep-feeding whales responded during CEEs (Southall et al. 2019).

The SOCAL Tagless BPRS, as the name implies, does not involve deploying tags on the animals. Tags were omitted from this study design because tags on dolphins have not had high success rates of staying on for a very long time. Furthermore, dolphins are social species that typically occur in groups and individuals within a group are likely to interact or react together when exposed to an external stimuli. Therefore, the project integrates established methods of quantifying dolphin behavior and physiology in a novel way to measure broad and fine-scale group and individual changes of dolphin behavior and physiology to simulated Navy MFAS or real Navy sonars using CEEs. 

During these tagless CEEs, a dolphin group is tracked from multiple platforms using several different tools. Kelp Marine Research is our on-shore team that spots workable groups (workable meaning that a group should be within range of all platforms and not moving too quickly so that they will leave this range during the CEE), tracks the group using a theodolite (just like I do for my Port Orford gray whale project), and does focal follows to record behavior of the group over a period of time. Ziphiid, one of CRC’s RHIBs, is tasked with deploying three passive acoustic sensors to record sounds emitted by the dolphins and to measure the intensity of the sound of the simulated Navy MFAS or the real Navy sonars. Musculus, the second CRC RHIB, has a dual-function during CEEs; it holds the custom vertical line array sound source, which emits the simulated Navy MFAS, and it is also the ‘biopsy boat’ tasked with obtaining biopsy samples of individuals within the dolphin group to measure potential changes in stress hormone levels. And last but not least, the Magician, the third vessel on the water, serves as ‘home-base’ for the project (Fig. 3). Quite literally it is where the research team eats and sleeps, but it is also the spotting vessel from which visual observations occur, and it is the launch pad for the unmanned aerial system (UAS) used to measure potential changes in group composure, spacing, and speed of travel.

The project involves a lot of moving parts and we are careful to conduct the research with explicit monitoring and mitigation requirements to ensure our work is carried out safely and ethically. These factors, as well as the fact that we are working with live, wild animals that we cannot ‘control’, are why three pilot efforts were necessary. Our first ‘official’ phase this past October was a success: in just eight days we conducted 11 CEEs. Six of these involved experimental sonar transmissions (two being from real Navy sonars dipped from hovering helicopters) and five were no-sonar controls that are critical to be able to experimentally associate sonar exposure with potential response. There are more phases to come in 2020 and 2021 and I look forward to continue working on such a collaborative project.

For more information on the project, you can visit Southall Environmental Associates project page, or read the blog posts written by Dr. Brandon Southall (this one or this one).

For anyone attending the World Marine Mammal Conference in Barcelona, Spain, there will be several talks related to this research:

  • Dr. Brandon Southall will be presenting on the Atlantic BRS on beaked whales and short-finned pilot whales on Wednesday, December 11 from 2:15 – 2:30 pm
  • Dr. Caroline Casey will be presenting on the experimental design and results of this SOCAL Tagless BPRS project on Wednesday, December 11 from 2:30 – 2:45 pm

All research is authorized under NMFS permits #16111, 19091, and 19116 as well as numerous Institutional Animal Care and Use Committee and other federal, state, and local authorizations. More information is available upon request from the project chief scientist at Brandon.Southall@sea-inc.net

Literature cited

Fernández, A., J. F. Edwards, F. Rodríguez, A. Espinosa de los Monteros, P. Herráez, P. Castro, J. R. Jaber, V. Martín, and M. Arbelo. 2005. “Gas and fat embolic syndrome” involving a mass stranding of beaked whales (Family Ziphiidae) exposed to anthropogenic sonar signals. Veterinary Pathology 42(4):446-457.

Filadelfo, R., J. Mintz, E. Michlovich, A. D’Amico, P. L. Tyack, and D. R. Ketten. 2009. Correlating military sonar use with beaked whale mass strandings: what do the historical data show? Aquatic Mammals 35(4):435-444.

International Transport Forum. 2019. Transport demand set to triple, but sector faces potential disruptions. Retrieved from: https://www.itf-oecd.org/transport-demand-set-triple-sector-faces-potential-disruptions

Jambeck, J. R., R. Geyer, C. Wilcox, T. R. Siegler, M. Perryman, A. Andrady, R. Narayan, and K. L. Law. 2015. Plastic waste inputs from land into the ocean. Science 347(6223):768-771.

Jepson, P. D., M. Arbelo, R. Deaville, I A. P. Patterson, P. Castro, J. R. Baker, E. Degollada, H. M. Ross, P. Herráez, A. M. Pocknell, F. Rodríguez, F. E. Howie II, A. Espinosa, R. J. Reid, J. R. Jaber, V. Martin, A. A. Cunningham, and A. Fernández. 2003. Gas-bubble lesions in stranded cetaceans. Nature 425:575.

Lewis, S. L., and M. A. Maslin. 2015. Defining the Anthropocene. Nature 519:171-180.

Southall, B. L., S. L. DeRuiter, A. Friedlaender, A. K. Stimpert, J. A. Goldbogen, E. Hazen, C. Casey, S. Fregosi, D. E. Cade, A. N. Allen, C. M. Harris, G. Schorr, D. Moretti, S. Guan, and J. Calambokidis. 2019. Behavioral responses of individual blue whales (Balaenoptera musculus) to mid-frequency military sonar. Journal of Experimental Biology 222: doi. 10.1242/jeb.190637.

Tyack, P. L. 2008. Implications for marine mammals of large-scale changes in the marine acoustic environment. Journal of Mammalogy 89(3):549-558.

Weilgart, L. S. 2007a. The impacts of anthropogenic ocean noise on cetaceans and implications for management. Canadian Journal of Zoology 85(11):1091-1116.

Weilgart, L. S. 2007b. A brief review of known effects of noise on marine mammals. International Journal of Comparative Psychology 20(2):159-168.

World Ocean Review. 2014. WOR 3: Marine resources – opportunities and risks. Report No 3. Retrieved from: https://worldoceanreview.com/en/wor-3/oil-and-gas/.

World Ocean Review. 2010. WOR 1: Marine resources – Living with the oceans. A report on the state of the world’s oceans. Report No 1. Retrieved from: https://worldoceanreview.com/en/wor-1/transport/global-shipping/3/

Wright, A. J., N. A. Soto, A. L. Baldwin, M. Bateson, C. M. Beale, C. Clark, T. Deak, E. F. Edwards, A. Fernández, A. Godinho, L. T. Hatch, A. Kakuschke, D. Lusseau, D. Martineau, M. L. Romero, L. S. Weilgart, B. A. Wintle, G. Notarbartolo-di-Sciara, and V. Martin. Do marine mammals experience stress related to anthropogenic noise? International Journal of Comparative Psychology 20(2):274-316.

Classifying cetacean behavior

Clara Bird, Masters Student, OSU Department of Fisheries and Wildlife, Geospatial Ecology of Marine Megafauna Lab

The GEMM lab recently completed its fourth field season studying gray whales along the Oregon coast. The 2019 field season was an especially exciting one, we collected rare footage of several interesting gray whale behaviors including GoPro footage of a gray whale feeding on the seafloor, drone footage of a gray whale breaching, and drone footage of surface feeding (check out our recently released highlight video here). For my master’s thesis, I’ll use the drone footage to analyze gray whale behavior and how it varies across space, time, and individual. But before I ask how behavior is related to other variables, I need to understand how to best classify the behaviors.

How do we collect data on behavior?

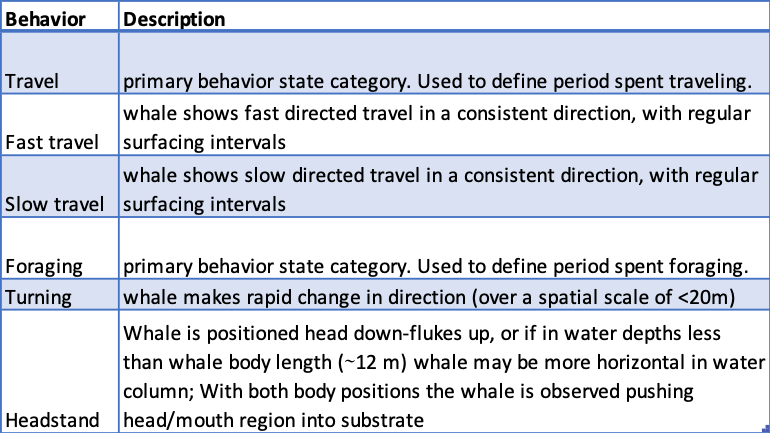
One of the most important tools in behavioral ecology is an ‘ethogram’. An ethogram is a list of defined behaviors that the researcher expects to see based on prior knowledge. It is important because it provides a standardized list of behaviors so the data can be properly analyzed. For example, without an ethogram, someone observing human behavior could say that their subject was walking on one occasion, but then say strolling on a different occasion when they actually meant walking. It is important to pre-determine how behaviors will be recorded so that data classification is consistent throughout the study. Table 1 provides a sample from the ethogram I use to analyze gray whale behavior. The specificity of the behaviors depends on how the data is collected.

Table 1. Sample from gray whale ethogram. Based on ethogram from Torres et al. (2018).

In marine mammal ecology, it is challenging to define specific behaviors because from the traditional viewpoint of a boat, we can only see what the individuals are doing at the surface. The most common method of collecting behavioral data is called a ‘focal follow’. In focal follows an individual, or group, is followed for a set period of time and its behavioral state is recorded at set intervals.  For example, a researcher might decide to follow an animal for an hour and record its behavioral state at each minute (Mann 1999). In some studies, they also recorded the location of the whale at each time point. When we use drones our methods are a little different; we collect behavioral data in the form of continuous 15-minute videos of the whale. While we collect data for a shorter amount of time than a typical focal follow, we can analyze the whole video and record what the whale was doing at each second with the added benefit of being able to review the video to ensure accuracy. Additionally, from the drone’s perspective, we can see what the whales are doing below the surface, which can dramatically improve our ability to identify and describe behaviors (Torres et al. 2018).

Categorizing Behaviors

In our ethogram, the behaviors are already categorized into primary states. Primary states are the broadest behavioral states, and in my study, they are foraging, traveling, socializing, and resting. We categorize the specific behaviors we observe in the drone videos into these categories because they are associated with the function of a behavior. While our categorization is based on prior knowledge and critical evaluation, this process can still be somewhat subjective.  Quantitative methods provide an objective interpretation of the behaviors that can confirm our broad categorization and provide insight into relationships between categories.  These methods include path characterization, cluster analysis, and sequence analysis.

Path characterization classifies behaviors using characteristics of their track line, this method is similar to the RST method that fellow GEMM lab graduate student Lisa Hildebrand described in a recent blog. Mayo and Marx (1990) analyzed the paths of surface foraging North Atlantic Right Whales and were able to classify the paths into primary states; they found that the path of a traveling whale was more linear and then paths of foraging or socializing whales that were more convoluted (Fig 1). I plan to analyze the drone GPS track line as a proxy for the whale’s track line to help distinguish between traveling and foraging in the cases where the 15-minute snapshot does not provide enough context.

Figure 1. Figure from Mayo and Marx (1990) showing different track lines symbolized by behavior category.

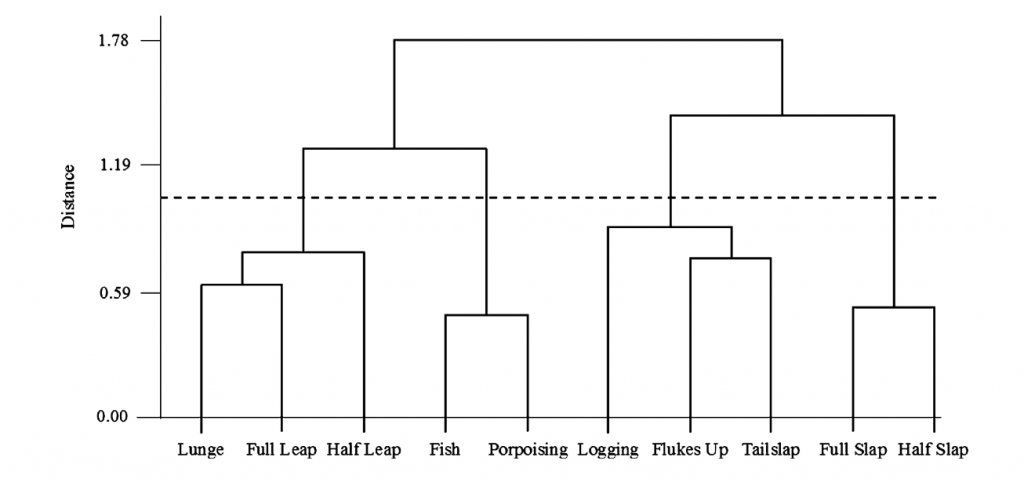
Cluster analysis looks for natural groupings in behavior. For example, Hastie et al. (2004) used cluster analysis to find that there were four natural groupings of bottlenose dolphin surface behaviors (Fig. 2). I am considering using this method to see if there are natural groupings of behaviors within the foraging primary state that might relate to different prey types or habitat. This process is analogous to breaking human foraging down into sub-categories like fishing or farming by looking for different foraging behaviors that typically occur together.

Figure 2. Figure from Hastie et al. (2004) showing the results of a hierarchical cluster analysis.

Lastly, sequence analysis also looks for groupings of behaviors but, unlike cluster analysis, it also uses the order in which behaviors occur. Slooten (1994) used this method to classify Hector’s dolphin surface behaviors and found that there were five classes of behaviors and certain behaviors connected the different categories (Fig. 3). This method is interesting because if there are certain behaviors that are consistently in the same order then that indicates that the order of events is important. What function does a specific sequence of behaviors provide that the behaviors out of that order do not?

Figure 3. Figure from Slooten (1994) showing the results of sequence analysis.

Think about harvesting fruits and vegetables from a garden: the order of how things are done matters and you might use different methods to harvest different kinds of produce. Without knowing what food was being harvested, these methods could detect that there were different harvesting methods for different fruits or veggies. By then studying when and where the different methods were used and by whom, we could gain insight into the different functions and patterns associated with the different behaviors. We might be able to detect that some methods were always used in certain habitat types or that different methods were consistently used at different times of the year.

Behavior classification methods such as these described provide a more refined and detailed analysis of categories that can then be used to identify patterns of gray whale behaviors. While our ultimate goal is to understand how gray whales will be affected by a changing environment, a comprehensive understanding of their current behavior serves as a baseline for that future study.

References

Burnett, J. D., Lemos, L., Barlow, D., Wing, M. G., Chandler, T., & Torres, L. G. (2019). Estimating morphometric attributes of baleen whales with photogrammetry from small UASs: A case study with blue and gray whales. Marine Mammal Science, 35(1), 108–139. https://doi.org/10.1111/mms.12527

Darling, J. D., Keogh, K. E., & Steeves, T. E. (1998). Gray whale (Eschrichtius robustus) habitat utilization and prey species off Vancouver Island, B.C. Marine Mammal Science, 14(4), 692–720. https://doi.org/10.1111/j.1748-7692.1998.tb00757.x

Hastie, G. D., Wilson, B., Wilson, L. J., Parsons, K. M., & Thompson, P. M. (2004). Functional mechanisms underlying cetacean distribution patterns: Hotspots for bottlenose dolphins are linked to foraging. Marine Biology, 144(2), 397–403. https://doi.org/10.1007/s00227-003-1195-4

Mann, J. (1999). Behavioral sampling methods for cetaceans: A review and critique. Marine Mammal Science, 15(1), 102–122. https://doi.org/10.1111/j.1748-7692.1999.tb00784.x

Slooten, E. (1994). Behavior of Hector’s Dolphin: Classifying Behavior by Sequence Analysis. Journal of Mammalogy, 75(4), 956–964. https://doi.org/10.2307/1382477

Torres, L. G., Nieukirk, S. L., Lemos, L., & Chandler, T. E. (2018). Drone up! Quantifying whale behavior from a new perspective improves observational capacity. Frontiers in Marine Science, 5(SEP). https://doi.org/10.3389/fmars.2018.00319

Mayo, C. A., & Marx, M. K. (1990). Surface foraging behaviour of the North Atlantic right whale, Eubalaena glacialis, and associated zooplankton characteristics. Canadian Journal of Zoology, 68(10), 2214–2220. https://doi.org/10.1139/z90-308

Detecting blue whales from acoustic data

By Dawn Barlow, PhD student, OSU Department of Fisheries and Wildlife, Geospatial Ecology of Marine Megafauna Lab

In January of 2016, five underwater recording units were dropped to the seafloor in New Zealand to listen for blue whales (Fig. 1). These hydrophones sat listening for two years, brought to the surface only briefly every six months to swap out batteries and offload the data. Through all seasons and conditions when scientists couldn’t be on the water, they recorded the soundscape, generating a wealth of acoustic data with the potential to greatly expand our knowledge of blue whale ecology

Figure 1. Locations of the five Marine Autonomous Recording Units (MARUs) in the South Taranaki Bight region of New Zealand.

We have established that blue whales are present in New Zealand waters year-round 1. However, many questions remain regarding their distribution across daily, seasonal, and yearly scales. Our two-year acoustic dataset from five hydrophones throughout the STB region is a goldmine of information on blue whale occurrence patterns and the soundscape they inhabit. Having year-round occurrence data will allow us to examine what environmental and anthropogenic factors may influence blue whale distribution patterns. The hydrophones were listening for whales around the clock, every day, while we were on the other side of the world awaiting the recovery of the data to answer our questions.

Before any questions of seasonal distribution or anthropogenic impacts and noise can be addressed, however, we need to know something far more basic: when and where did we record blue whale vocalizations? This may seem like a simple, stepping-stone question, but it is actually quite involved, and the reason I spent the last month working with a team of acousticians at Cornell University’s Center for Conservation Bioacoustics. The expert research group here at Cornell, led by Dr. Holger Klinck, have been instrumental in our New Zealand blue whale research, including developing and building the recording units, hydrophone deployment and recovery, data processing, analysis, and advice. I am thrilled to work with all of them, and had an incredibly productive month of learning about acoustics from the best.

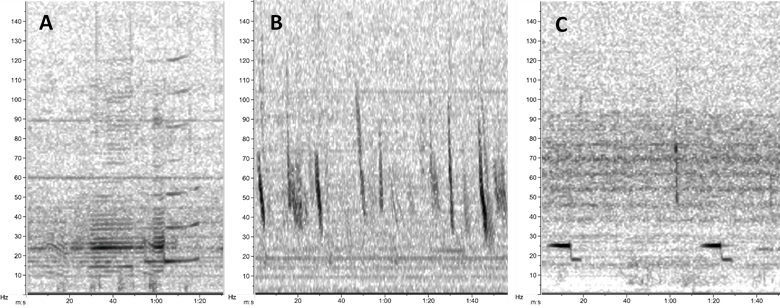
Blue whales produce multiple vocalizations that we are interested in documenting. The New Zealand song (Fig. 2A) is highly stereotyped and unique to the Southwest Pacific Ocean 2,3. Low-frequency downsweeps, or “D calls” (Fig. 2B), are far more variable and produced by blue whale populations around the world 4. Furthermore, Antarctic blue whales produce a highly-stereotyped “Z call” (Fig. 2C) and are known to be present in New Zealand waters occasionally 5.

Figure 2. Spectrograms of (A) the New Zealand blue whale song, (B), D calls, and (C) Antarctic Z calls.

One way to determine when blue whales were vocalizing is for an analyst to manually review the entirety of the two years of sound recordings for each of the five hydrophones by hand to scan for and select individual vocalizations. An alternative approach is to develop a detector algorithm to locate calls in the data based on their stereotypical characteristics. Over the past month I built, tested, and ran detectors for each blue whale call type using what is called a data template detector. This technique uses example signals from the data that the analyst selects as templates. The templates should be clear signals, and representative of the variation in calls contained in the dataset. Then, by comparing pixel characteristics between the template spectrograms and the spectrogram of the recording of interest using certain matching criteria (e.g. threshold for spectrogram correlation, detection frequency range), the algorithm searches for other signals like the templates in the full dataset. For example, in Fig. 3 you can see units of blue whale song I selected as templates for my detector.

Figure 3. Spectrogram of selected sound clips of New Zealand blue whale song, with units used as templates for a detector shown inside the teal boxes.

Testing the performance of a detector algorithm is critical. Therefore, a dataset is needed where calls were identified by an analyst and then used as the “ground truth”, to which the detector results are compared. For my ground truth dataset, I took a subset of 52 days and hand-browsed the spectrograms to identify and log New Zealand blue whale song, D calls, and Antarctic Z calls. In evaluating detector performance, there are three important metrics that need to be weighed: precision (the proportion of detections that are true), recall (the proportion of true calls identified by the detector), and false alarm rate (the number of false positive detections per hour). Ideally, the detector should be optimized to maximize precision and recall and minimize the false positives.

The STB region is highly industrial, and our two-year acoustic dataset contains periods of pervasive seismic airgun noise from oil and gas exploration. Ideally, a detector would be able to identify blue whale vocalizations even in the presence of airgun operations that dominate the soundscape for months. For blue whale song, the detector did quite well! With a precision of 0.91 and recall of 0.93, the detector could pick out song units over airgun noise (Fig. 4). A false alarm rate of 8 false positives per hour is a sacrifice worth making to identify song during seismic operations (and the false positives will be removed in a subsequent step). For D calls, seismic survey activity presented a different challenge. While the detector did well at identifying D calls during airgun operation, the first several detector attempts also logged every single airgun blast as a blue whale vocalization—clearly problematic. Through an iterative process of selecting template signals, and adjusting the number of templates used and the correlation threshold, I was able to come up with a detector which selected D calls and missed most airgun blasts. This success felt like a victory.

Figure 4. An example of spectrograms of simultaneous recordings from the five hydrophones illustrating seismic airgun noise (strong broadband signals that appear as repetitive black, vertical lines) overlapping New Zealand blue whale song. The red boxes are detection events selected by the detector, demonstrating its ability to capture song even during airgun operation.

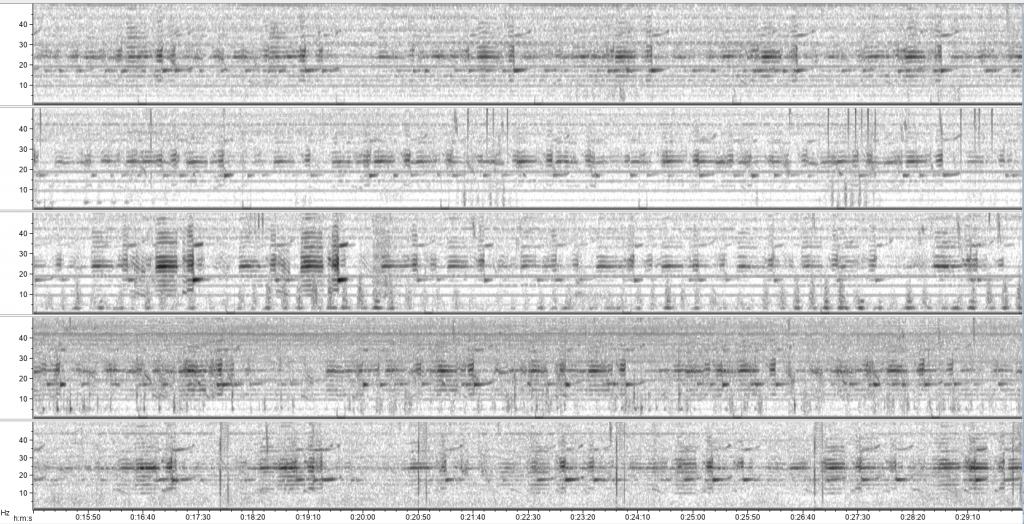
After this detector development and validation process, I ran each detector on the full two-year acoustic dataset for all five recording units. This step was a good exercise in patience as I eagerly awaited the outputs for the many hours they took to run. The next step in the process will be for me to go through and validate each detector event to eliminate any false positives. However, running the detectors on the full dataset has allowed for exciting preliminary examinations of seasonal blue whale acoustic patterns, which need to be refined and expanded upon as the analysis continues. For example, sometimes the New Zealand song dominates the recordings on all hydrophones (Fig. 5), whereas other times of year song is less common. Similarly, there appear to be seasonal patterns in D calls and Antarctic Z calls, with peaks and dips in detections during different times of year.

Figure 5. An example spectrogram of simultaneous recordings from all five hydrophones during a time when New Zealand blue whale song dominated the recordings, with numerous, overlapping calls.

As with many things, the more questions you ask, the more questions you come up with. From preliminary explorations of the acoustic data my head is buzzing with ideas for further analysis and with new questions I hadn’t thought to ask of the data before. My curiosity has been fueled by scrolling through spectrograms, looking, and listening, and I am as excited as ever to continue researching blue whale ecology. I would like to thank the team at the Center for Conservation Bioacoustics for their support and guidance over the past month, and I look forward to digging deeper into the stories being told in the acoustic data!

Figure 6. A pair of blue whales observed in February 2017 in the South Taranaki Bight. Photo: L. Torres.

References

1.          Barlow, D. R. et al. Documentation of a New Zealand blue whale population based on multiple lines of evidence. Endanger. Species Res. 36, 27–40 (2018).

2.          McDonald, M. A., Mesnick, S. L. & Hildebrand, J. A. Biogeographic characterisation of blue whale song worldwide: using song to identify populations. J. Cetacean Res. Manag. 8, 55–65 (2006).

3.          Balcazar, N. E. et al. Calls reveal population structure of blue whales across the Southeast Indian Ocean and the Southwest Pacific Ocean. J. Mammal. 96, 1184–1193 (2015).

4.          Oleson, E. M. et al. Behavioral context of call production by eastern North Pacific blue whales. Mar. Ecol. Prog. Ser. 330, 269–284 (2007).

5.          McDonald, M. A. An acoustic survey of baleen whales off Great Barrier Island, New Zealand. New Zeal. J. Mar. Freshw. Res. 40, 519–529 (2006).


Vaquita: a porpoise caught between people and money

By: Alexa Kownacki, Ph.D. Student, OSU Department of Fisheries and Wildlife, Geospatial Ecology of Marine Megafauna Lab

When I first learned of the critically endangered vaquita in early 2015, there were an estimated 97 individuals remaining as reported by CIRVA* (Morell 2014). I was a recent graduate with a bachelor’s degree in Wildlife, Fish, and Conservation Biology, and I, of all people, had never heard of the vaquita. Today, there are an estimated 19 vaquita left (Roth 2019).

Digital painting of a vaquita mother with her calf (Image Source: Aquarium of the Pacific).

The vaquita (Phocoena sinus) is a small porpoise endemic to the Sea of Cortez in the northern region of the Gulf of California, Mexico. It is the most endangered marine mammal and has been for many years, and yet, I had not heard of the vaquita. It wasn’t until I listened to a lunchtime seminar hosted by NOAA Fisheries, that I heard about the porpoise. As a young scientist, “in the field”, I was shocked to realize that I was just learning about an animal, let alone a cetacean, actively going extinct in my lifetime. I believe it’s our job to inform those around us of news in our expertise, and I had failed. I wasn’t informed. As much as I tried in the past four years to describe the decline of the smallest cetacean to anyone who’d listen, I was only reaching a few people at a time. But, today, the vaquita is finally capturing the public’s eye thanks to celebrity support and a feature-length film.

A rare photo of a vaquita (Image Source: Tom Jefferson via the Marine Mammal Center)

From executive producer, Leonardo DiCaprio, comes the Sundance Film Festival Audience Award winner, “Sea of Shadows”. The story of the vaquita truly is an “eco-thriller” and one worth watching. This is not your typical plot line of an endangered species tragically going extinct without action. The vaquita’s story boasts big-name players, such as the Mexican Navy, internationally recognized scientists, Mexican cartels, Chinese mafia, celebrities, the National Marine Mammal Foundation, and Sea Shepherd. At the center of this documentary is the elusive vaquita. The vaquita is not hunted, in fact, this species is not desirable for fisherman. The animal is not aggressive and, in contrast, is notoriously shy, only surfacing to breathe. Furthermore, its name roughly translates into “little cow” because of the rings around its eyes and its docile nature. So, why is this cute creature on the road to extinction? The answer: the wrong place at the wrong time.

“Sea of Shadows” official trailer by National Geographic

The vaquita occupy a small part of the Sea of Cortez where totoaba (Totoaba macdonaldi), a large fish in the drum family, is also endemic. If you’re wondering what a small porpoise and a large fish have in common, then you’d be close to recognizing that is the key to understanding this tragedy. Both species are roughly the same size, one to two meters in length with similar girths. The totoaba, although said to have tender meat, is caught for only one organ: the swim bladder. Now referred to as the “cocaine of the sea”, the dried swim bladders of the totoaba are sold to Mexican cartels who then export the product to China. Once in China, illegal markets sell the swim bladders for up to $100,000USD. Unfortunately, the nets used to illegally catch totoaba, also catch the vaquita. The porpoise has no economic value to the fishermen and therefore are tossed as bycatch. The vaquita is the innocent bystander in a war for money and power.

A man displays the catch from an illegal gillnet, including the totoaba in his arms, and a vaquita, below, that was bycatch (Image Source: Omar Vidal via Aquarium of the Pacific/NOAA Fisheries).

Watching a charismatic species severely decline because of human greed is horrific. The film, however, focuses on the effort of a few incredible organizations that band together in the fight to save the vaquita. Moreover, the multimillion-dollar project, Vaquita CPR, is still ongoing. On a more positive note, in October of 2019, scientists spotted six vaquita during continued conservation and monitoring efforts (Blust & Desk 2019). The path to saving a critically endangered species, especially one that is thought not to do well in captivity, is challenging. The vaquita’s recovery path has many complicated connections which for what appears to be an uphill battle. But, we, the people, are responsible for this. We must support research and conservation by using our voice to share what is happening, for a porpoise and for the world.

*Comité Internacional para la Recuperación de la Vaquita (International Committee for the Recovery of the Vaquita)

Citations:

Blust, Kendal, and Fronteras Desk. “Photo Sparks Increased Concern over Fishing in Vaquita Refuge.” Arizona Public Media, 25 Oct. 2019, https://news.azpm.org/p/news-topical-nature/2019/10/25/160806-photo-sparks-increased-concern-over-fishing-in-vaquita-refuge/.

Morell, Virginia. “Vaquita Porpoise Faces Imminent Extinction-Can It Be Saved?” National Geographic, 15 Aug. 2014, https://www.nationalgeographic.com/news/2014/8/140813-vaquita-gulf-california-mexico-totoaba-gillnetting-china-baiji/.

Roth, Annie. “The ‘Little Cow’ of the Sea Nears Extinction.” National Geographic, 17 Sept. 2019, https://www.nationalgeographic.com/animals/2019/09/vaquita-the-porpoise-familys-smallest-member-nears-extinction/#close.