Kelp to whales: New GEMM Lab publication explores indirect effects of a classic trophic cascade on gray whales

By Lisa Hildebrand, PhD candidate, OSU Department of Fisheries, Wildlife, & Conservation Sciences, Geospatial Ecology of Marine Megafauna Lab

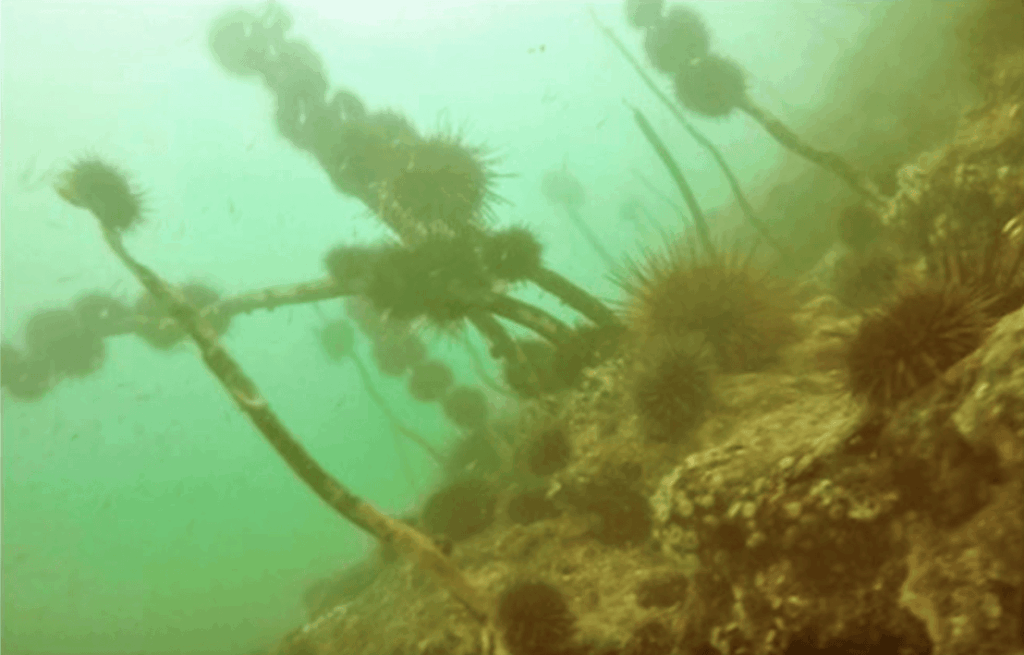
As many of our avid readers already know, the Pacific Coast Feeding Group (PCFG) of gray whales employs a wide range of foraging tactics to feed on a number of different prey items in various benthic substrate types (Torres et al. 2018). One example foraging tactic is when PCFG whales, particularly when they are in the Oregon portion of their feeding range, forage on mysid shrimp in and near kelp beds on rocky reefs. We have countless drone video clips of whales weaving their large bodies through kelp and many photographs of whales coming to the surface to breath completely covered in kelp, looking more like a sea monster than a whale (Figure 1). So, when former intern Dylan Gregory made an astute observation during the 2018 TOPAZ/JASPER field season in Port Orford about a GoPro video the field team collected that showed many urchins voraciously feeding on an unhealthy-looking kelp stalk (Figure 2a), it made us wonder if and how changes to kelp forests may impact gray whales. 
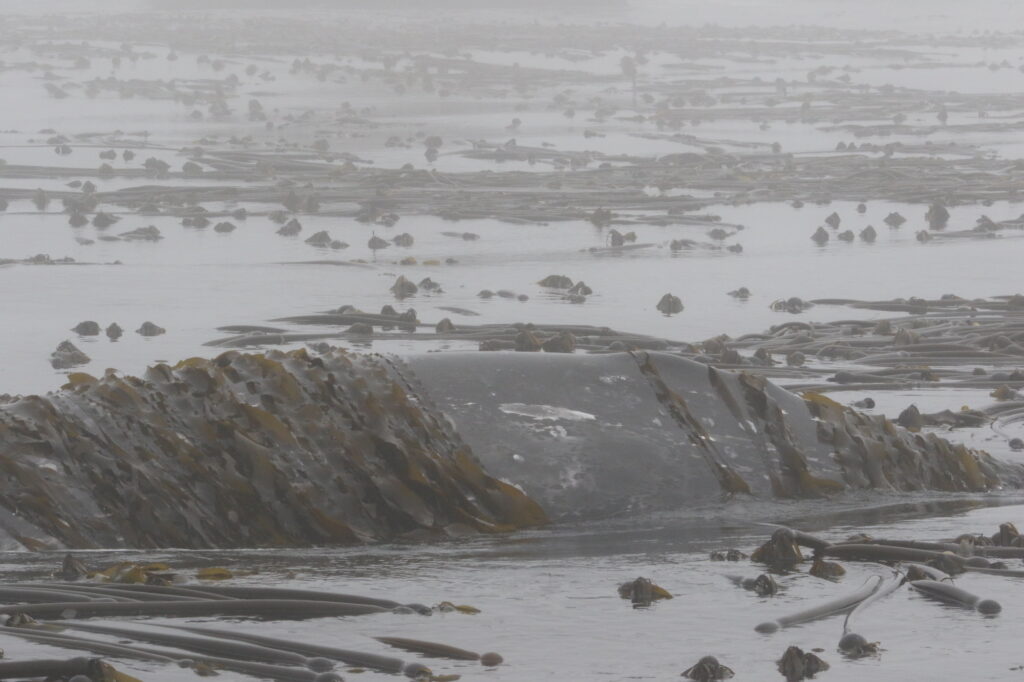
Fig 1. Gray whale surfacing in a large kelp patch. Photograph captured under NOAA/NMFS research permit #16111. Source: GEMM Lab.

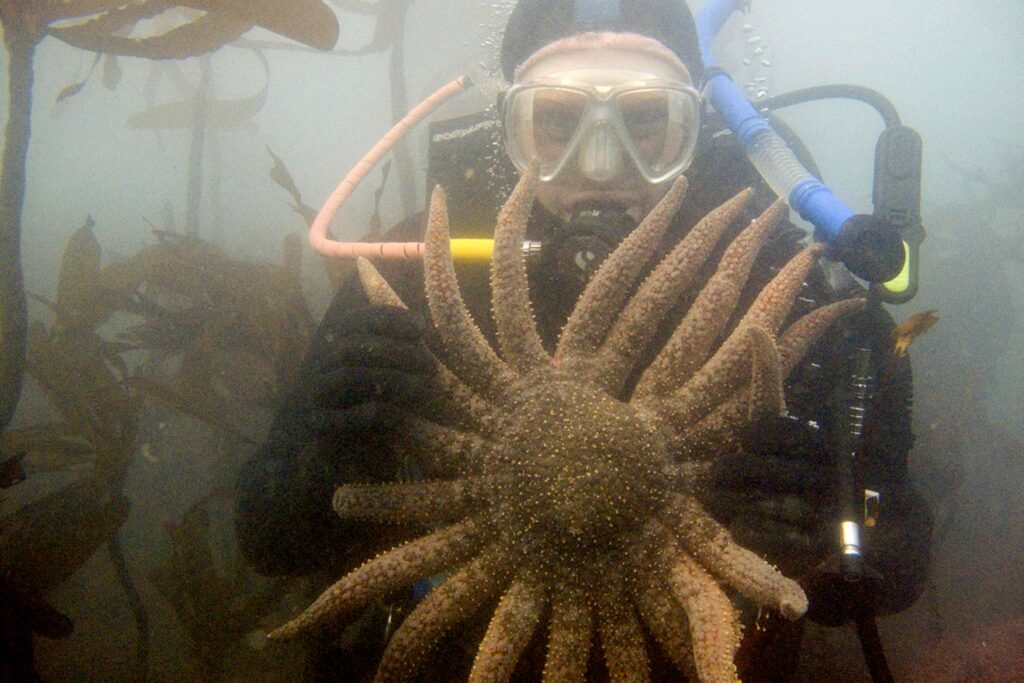
Kelp forests are widely used as a marine example of trophic cascades. Trophic cascades are trigged by the addition/removal of a top predator to/from a system, which causes changes further down the trophic chain. Sea urchins are common inhabitants of kelp forests and in a balanced, healthy system, urchin populations are regulated by predators as they behave cryptically by hiding in crevices in the reef and individual urchins feed passively on drift kelp that breaks off from larger plants. When we think about who controls urchins in kelp forests, we probably think of sea otters first. However, sea otters have been absent from Oregon waters for over a century (Kone et al. 2021), so who controls urchins here? The answer is the sunflower sea star (Figure 2b). Sunflower sea stars are large predators with a maximum arm span of up to 1 m! Unfortunately, a disease epidemic that started in 2013 known as sea star wasting disease caused 80-100% population decline of sunflower sea stars along the coastline between Mexico and Alaska (Harvell et al. 2019). Shortly thereafter, a record-breaking marine heatwave caused warm, nutrient-poor water conditions to persist in the northeast Pacific Ocean from 2014 to 2016 (Jacox et al. 2018). These co-occurring stressors caused unprecedented and long-lasting decline of a previously robust kelp forest in northern California (Rogers-Bennett & Catton 2019), where sea otters are also absent. Given the biogeographical similarity between southern Oregon and northern California and the observation made by Dylan in 2018, we decided to undertake an analysis of the eight years of data collected during the TOPAZ/JASPER project in Port Orford starting in 2016, to investigate the trends of four trophic levels (purple sea urchins, bull kelp, zooplankton, and gray whales) across space and time. The results of our study were published last week in Scientific Reports and I am excited to be able to share them with you today.
Every day during the TOPAZ/JASPER field season, two teams head out to collect data. One team is responsible for tracking gray whales from shore using a theodolite, while the other team heads out to sea on a tandem research kayak to collect prey data (Figure 3). The kayak team samples prey in multiple ways, including dropping a GoPro camera at each sampling station. When the project was first developed, the original goal of these GoPro videos was to measure the relative abundance of prey. Since the sampling stations occur on or near reefs that are shallow with dense surface kelp, traditional methods to assess prey density, such as using a boat with an echosounder, are not suitable options. Instead, GEMM Lab PI Leigh Torres, together with the first Master’s student on this project Florence Sullivan, developed a method to score still images extracted from the GoPro videos to estimate relative zooplankton abundance. However, after we saw those images of urchins feeding on kelp in 2018, we decided to develop another protocol that allowed us to use these GoPro videos to also characterize sea urchin coverage and kelp condition. Once we had occurrence values for all four species, we were able to dig into the spatiotemporal trends.
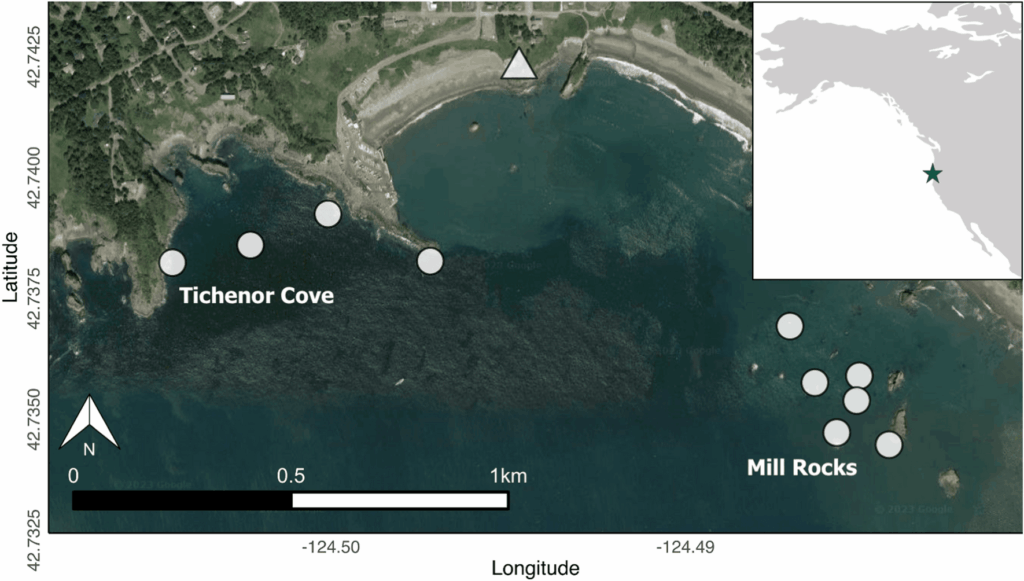
Figure 3. Map of Port Orford, USA study area showing the 10 kayak sampling stations (white circles) within the two study sites (Tichenor Cove and Mill Rocks). The white triangle represents the cliff top location where theodolite tracking of whales was conducted. Figure and caption taken from Hildebrand et al. 2024.

When we examined the trends for each of the four study species across years, we found that purple sea urchin coverage in both of our study sites within Port Orford increased dramatically within our study period (Figure 4). In 2016, the majority of our sampled stations contained no visible urchins. However, by 2020, we detected urchins at every sampling station. For kelp, we saw the reverse trend; in 2016 all sampling stations contained kelp that was healthy or mostly healthy. But by 2019, there were many stations that contained kelp in poor health or where kelp was absent entirely. Zooplankton and gray whales experienced similar temporal trends as the kelp, with their occurrence metrics (abundance and foraging time, respectively) having higher values at the start of our study period and declining steadily during the eight years. While the rise in urchin coverage across our study area occurred concurrently with the decrease in kelp condition, zooplankton abundance, and gray whale foraging, we wanted to explicitly test how these species are related to one another based on prior ecological knowledge.
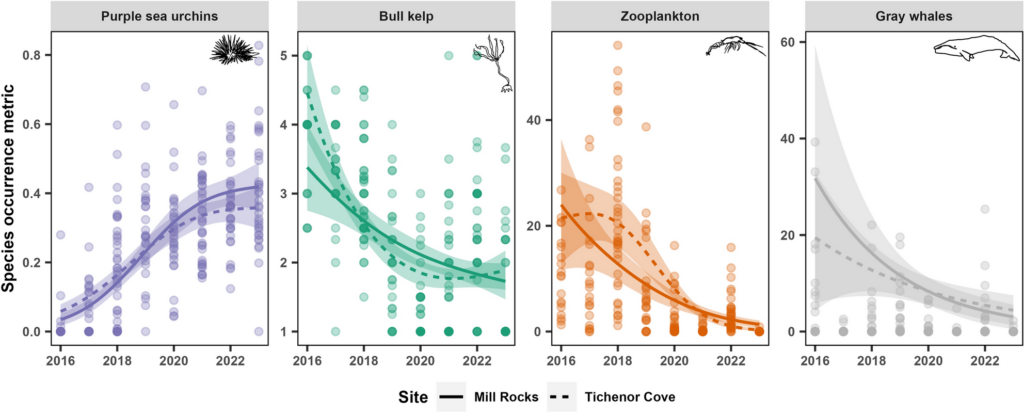
Figure 4. Temporal trends of purple sea urchin coverage, bull kelp condition, relative zooplankton abundance, and gray whale foraging time by year across the eight-year study period (2016–2023), from the generalized additive models. The colored ribbons represent approximate 95% confidence intervals. Line types represent the two study sites, Mill Rocks (MR; solid) and Tichenor Cove (TC; dashed). All curves are statistically significant (P < 0.05). Figure and caption taken from Hildebrand et al. 2024.

To test whether urchin coverage had an effect on kelp condition, we hypothesized that increased urchin coverage would be correlated with reduced kelp condition based on the decades of research that has established a negative relationship between the two when a trophic cascade occurs in kelp forest systems. Next, we wanted to test whether kelp condition had an effect on zooplankton abundance and hypothesized that increased kelp condition would be correlated with increased zooplankton abundance. We based this hypothesis on several pieces of prior knowledge, particularly as they pertain to mysid shrimp: (1) high productivity within kelp beds provides food for mysids, including kelp zoospores (VanMeter & Edwards 2013), (2) current velocities are one third slower inside kelp beds compared to outside (Jackson & Winant 1983), which might support the retention of mysids within kelp beds since they are not strong swimmers, and (3) the kelp canopy may serve as potential protection for mysids from predators (Coyer 1984). Finally, we wanted to test whether both kelp condition and zooplankton abundance have an effect on gray whales and we hypothesized that increased values for both would be correlated with increased gray whale foraging time. While the reasoning behind our hypothesized correlation between zooplankton prey and gray whales is obvious (whales eat zooplankton), the reasoning behind the kelp-whale connection may not be. We speculated that since kelp habitat may aggregate or retain zooplankton prey, gray whales may use kelp as an environmental cue to find prey patches. 

When we tested our hypotheses through generalized additive models, we found that increased urchin coverage was significantly correlated with decreased kelp condition in both study sites, providing evidence that a shift from a kelp forest to an urchin barren may have occurred in the Port Orford area. Additionally, increased kelp condition was correlated with increased zooplankton abundance, supporting our hypothesis that kelp forests are an important habitat and resource for nearshore zooplankton prey. Interestingly, this relationship was bell-shaped in one of our two study sites, suggesting that there are other factors besides healthy bull kelp that influence zooplankton abundance, which likely include upwelling dynamics, habitat structure, and local oceanographic characteristics. For the whale model, we found that increased kelp condition was significantly correlated with increased gray whale foraging time, which may corroborate our hypothesis that gray whales use kelp as an environmental cue to locate prey. Zooplankton abundance was significantly correlated with gray whale foraging time in one of our two sites. Once again, this relationship was bell-shaped, which suggests other factors influence gray whale foraging time, including prey quality (Hildebrand et al. 2022) and density.
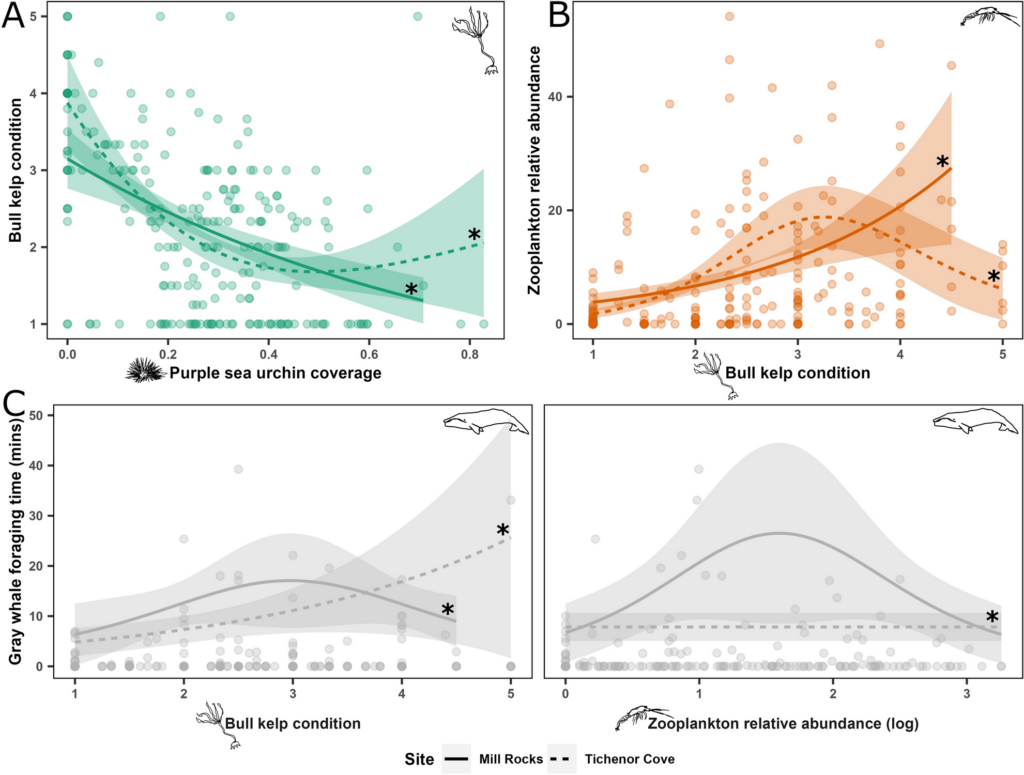
Figure 5. Effects derived from trophic path generalized additive models of purple sea urchin coverage on kelp condition (A), kelp condition on relative zooplankton abundance (B), and kelp condition and relative zooplankton abundance on gray whale foraging time (C). The colored ribbons represent approximate 95% confidence intervals. Line types represent the two study sites, Mill Rocks (MR; solid) and Tichenor Cove (TC; dashed). Curves with asterisks indicate statistically significant (P < 0.05) relationships. Figure and caption taken from Hildebrand et al. 2024.

Our results highlight the potential larger impacts of reduced gray whale foraging time as a result of these trophic dynamics may cause at the individual and population level. If an area that was once a reliable source of food (like Port Orford) is no longer favorable, then whales likely search for other areas in which to feed. However, if the areas affected by these dynamics are widespread, then individuals may spend more time searching for, and less time consuming, prey, which could have energetic consequences. While our study took place in a relatively small spatial area, the trophic dynamics we documented in our system may be representative of patterns across the PCFG range, given ecological and topographic similarities in habitat use patterns. In fact, in the years with the lowest kelp, zooplankton, and whale occurrence (2020 and 2021) in Port Orford, the GRANITE field team also noted low whale numbers and minimal surface kelp extent in the central Oregon field site off of Newport. However, ecosystems are resilient. We are hopeful that the dynamics we documented in Port Orford are just short-term changes and that the system will return to its former balanced state with less urchins, more healthy bull kelp, zooplankton, and lots of feeding gray whales.

If you are interested in getting a more detailed picture of our methods and analysis, you can read our open access paper here: https://www.nature.com/articles/s41598-024-59964-x

Did you enjoy this blog? Want to learn more about marine life, research, and conservation? Subscribe to our blog and get a weekly message when we post a new blog. Just add your name and email into the subscribe box below.

Loading

References

Coyer, J. A. (1984). The invertebrate assemblage associated with the giant kelp, Macrocystis pyrifera, at Santa Catalina Island, California: a general description with emphasis on amphipods, copepods, mysids, and shrimps. Fishery Bulletin, 82(1), 55-66.

Harvell, C. D., Montecino-Latorre, D., Caldwell, J. M., Burt, J. M., Bosley, K., Keller, A., … & Gaydos, J. K. (2019). Disease epidemic and a marine heat wave are associated with the continental-scale collapse of a pivotal predator (Pycnopodia helianthoides). Science advances, 5(1), eaau7042.

Hildebrand, L., Sullivan, F. A., Orben, R. A., Derville, S., & Torres, L. G. (2022). Trade-offs in prey quantity and quality in gray whale foraging. Marine Ecology Progress Series, 695, 189-201.

Jackson, G. A., & Winant, C. D. (1983). Effect of a kelp forest on coastal currents. Continental Shelf Research, 2(1), 75-80.

Jacox, M. G., Alexander, M. A., Mantua, N. J., Scott, J. D., Hervieux, G., Webb, R. S., & Werner, F. E. (2018). Forcing of multi-year extreme ocean temperatures that impacted California Current living marine resources in 2016. Bull. Amer. Meteor. Soc, 99(1).

Kone, D. V., Tinker, M. T., & Torres, L. G. (2021). Informing sea otter reintroduction through habitat and human interaction assessment. Endangered Species Research, 44, 159-176.

Rogers-Bennett, L., & Catton, C. A. (2019). Marine heat wave and multiple stressors tip bull kelp forest to sea urchin barrens. Scientific reports, 9(1), 15050.

Torres, L. G., Nieukirk, S. L., Lemos, L., & Chandler, T. E. (2018). Drone up! Quantifying whale behavior from a new perspective improves observational capacity. Frontiers in Marine Science, 5, 319.

VanMeter, K., & Edwards, M. S. (2013). The effects of mysid grazing on kelp zoospore survival and settlement. Journal of Phycology, 49(5), 896-901.
The Unpredictable Nature of Field Work & a Mystery Mysid

By Jasen C. White, GEMM Lab summer intern, OSU senior, Department of Fisheries, Wildlife, and Conservation Sciences

Field work is predictably unpredictable. Even with years of experience and exhaustive planning, nature always manages to throw a few curveballs, and this gray whale foraging ecology field season is no exception. We are currently in our sixth week of data collection here in Port Orford, and we have been battling the weather, our equipment, and a notable lack of whales and their zooplankton prey. Throughout all of these setbacks, Team “Heck Yeah” has lived up to its mantra as we have approached each day ready to hit the ground running. When faced with any of our myriad of problems, we have managed to work collaboratively to assess our options and develop solutions to keep the project on track. 

For those of you that are unfamiliar with Port Orford, it is windy here, and when it is not, it can be foggy. Both of these weather patterns have the potential to make unsafe paddling conditions for our kayak sampling team. This summer we have frequently delayed or altered our field work routines to accommodate these weather patterns. Occasionally, we had to call off kayaking altogether as the winds and swell precluded us from maintaining our boat “on station” at the predetermined GPS coordinates during our samples, only for the winds to die down once we had returned to shore and completed the daily gear maintenance. Despite weather challenges, we have made the most of our data collection opportunities over these past six weeks, and we have only been forced to give up four total days of data collection. Flexibility to take advantage of the good weather windows when they arrive is the key!

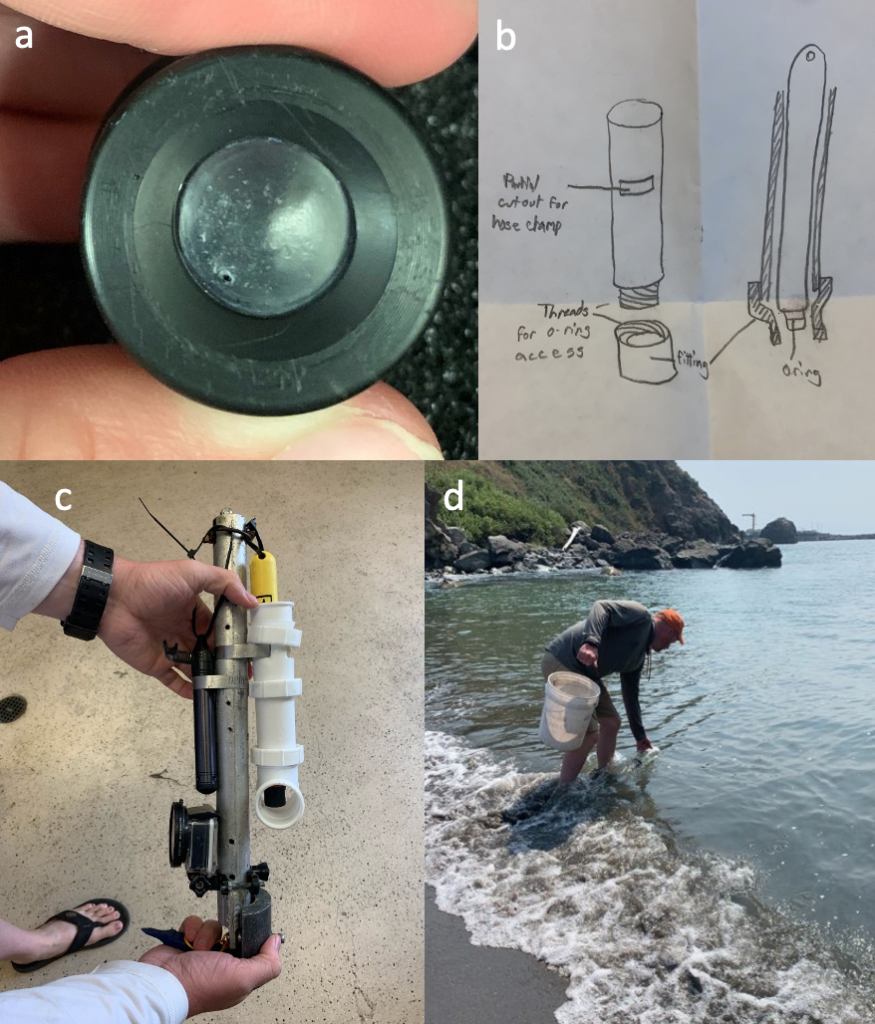
Equipment issues can be even more unpredictable than the weather. The first major stumbling block for our equipment was a punctured membrane in the dissolved oxygen probe that we lower into the water at each of our twelve sample locations. This puncture was likely the result of a stray urchin’s spine that was in the wrong place at the wrong time. Soon after noticing the problem, we quickly rallied to refurbish the membrane, recalibrate the sensor, and design a protective housing using some plumbing parts from the local hardware store to prevent any future damage to the membrane (Figures 1a-d). Within 6 days, we were back up and running with the dissolved oxygen sensor.

Figure 1. a) Punctured dissolved oxygen sensor membrane; b) plans for constructing a protective housing for the sensor; c) the new protective housing for the dissolved oxygen sensor (yellow) is attached to the sensor array; d) intern Jasen White measuring seawater for the dissolved oxygen sensor calibration after replacing the punctured membrane. Source: A. Dawn

The next major equipment issue involved a GoPro camera whose mounting hardware snapped while being retrieved at a sample site. This event was captured on the camera itself (see below). Fortunately, thanks to our collaborators at the Oregon Institute of Marine Biology, we were soon able to recover the lost GoPro camera, and in the meantime, we relied on our spare to continue sampling. 

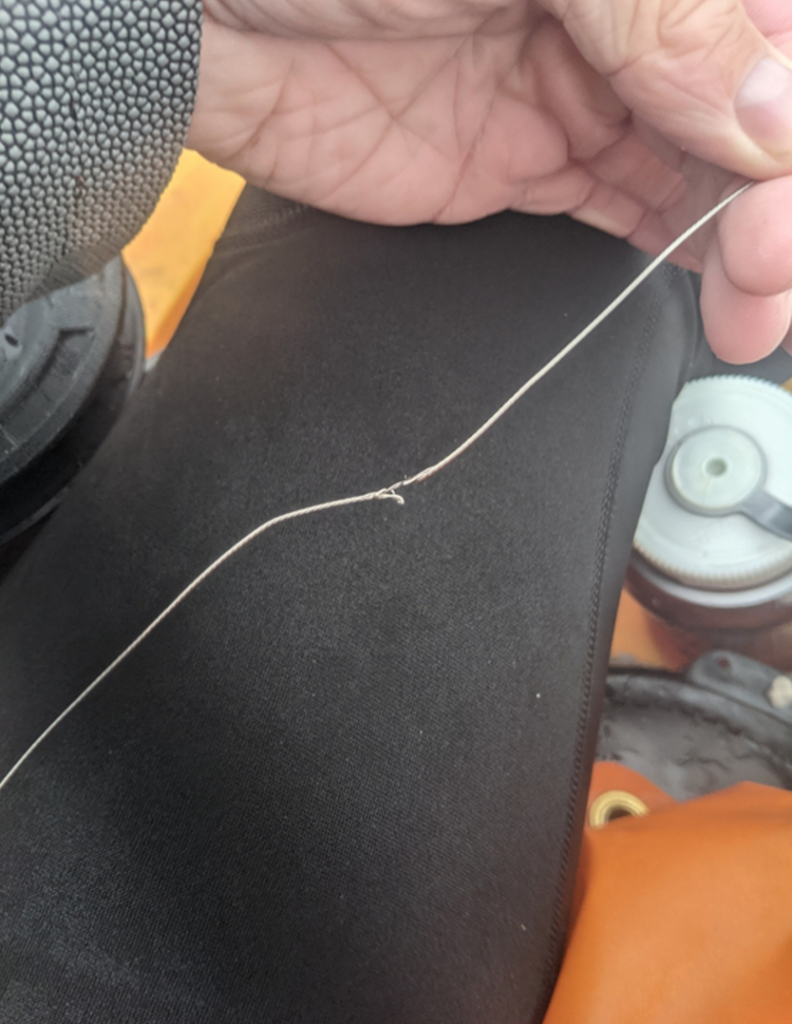
Figure 2. The steel cable of the downrigger used to deploy and retrieve our sensor array had worn down until only two strands remained intact. Source: J. White.

The most recent equipment problem was a fraying cable (Figure 2) on our downrigger. We use the downrigger as a winch to lower and raise our sensor array and zooplankton nets into the water to obtain our samples. Fortunately, keen eyes on our team noticed the fray before it fully separated while the sensor array was in the water which could have resulted in losing our gear. We were quickly able to find the necessary repair part locally and get back on the water to finish out our sample regime within an hour of noticing the problem. 

Finally, as Damian mentioned in his post last week, this season seemed to start much slower than the previous field seasons. In the early weeks, many of our zooplankton sampling nets repeatedly came up almost empty. There was often nothing but murky water to see in the GoPro videos that accompany the zooplankton samples. Likely due to the lack of prey, we have only managed to spot a couple of transitory whales that rarely entered our study area. Those few whales that we did observe were difficult to track as the relatively high winds and waves quickly dissipated the tell-tale blows and camouflaged their briefly exposed backs and flukes. 

Our determination and perseverance have recently started to pay off, however, as the prey abundance in at least some of our sample sites has begun to increase. This increase in prey has also corresponded to a slight increase in whale sightings. One whale even spent nearly 30 minutes around the sampling station that consistently yields the most prey, likely indicating foraging behavior. These modest increases in zooplankton prey and whale sightings provide more evidence in support of the hypothesis Damian mentioned last week that reduced whale abundance in the area is likely the result of low prey abundance.

Figure 3. Example of a previously unidentified mysid that dominates several of our zooplankton samples. Due to the unique fat and flat telson (the “tail”) portion, we have been affectionately calling these “beavertail” mysids. Source: J. White.

As the zooplankton abundance finally started to increase, we noticed an interesting shift in the kinds of prey that we are capturing compared to previous seasons. Donovan Burns, an intern from the 2019 field season, noted in his blog post that the two most common types of zooplankton they found in their samples were the mysid species Holmesimysis sculpta and members of the genus Neomysis. While Neomysis mysid shrimp are continuing to make up a large proportion of our prey samples this year, we have noticed that many of our samples are dominated by a different type of mysid shrimp (Figure 3) which, in previous years, was a very rare capture. After searching through several mysid identification guides, this unknown mysid appears to be a member of the genus Lucifer, identified based on the presence of some distinctive characteristics that are unique to this genus (Omori 1992). 

This observation is interesting because historically, Lucifer mysid shrimp are typically found in warmer tropical and subtropical waters and were rarely reported in the eastern North Pacific Ocean before the year 1992 (Omori 1992). Additionally, a key to common coastal mysid shrimp of Oregon, Washington, and British Columbia does not include members of the Lucifer genus, nor does it include any examples of mysids that resemble these new individuals showing up in our zooplankton nets (Daly and Holmquist 1986). If our initial identification of this mysid species is correct, then the sudden rise in the abundance of a typically warm water mysid species in Port Orford may indicate some fascinating shifts in oceanographic conditions that could lend some insight into why our prey and subsequent whale observations are so different this year than in years past.

Figure 4. View from the cliff site where we track gray whales using a theodolite. Source: A. Dawn.

As the 2021 field season draws to a close in Port Orford, I cannot help but reflect on what a wonderful opportunity we have been given through this summer internship program. I have loved the short time that I have spent living in this small but lively community for these past five weeks. Most days we could either be found kayaking around the nearshore to sample for the tiny creatures that our local gray whales call dinner, or we were on a cliff, gazing at the tirelessly beautiful, rugged coastline (Figure 4), hoping to glimpse the blow of a foraging whale so that we could track its course with our theodolite. Though the work can be physically exhausting during long and windy kayaking trips, mentally taxing when processing the data for each of the new samples after a full day of fieldwork, or incredibly frustrating with equipment failures, weather delays and shy whales, it is also tremendously satisfying to know that I contributed in a small but meaningful way to the mission of the GEMM Lab. I cannot imagine a better way to obtain the experience that my fellow interns and I have gained from this work, and I know that it will serve each of us well in our future ambitions.

References

Daly, K. L., and C. Holmquist. 1986. A key to the Mysidacea of the Pacific Northwest. Canadian Journal of Zoology 64:1201–1210.

Omori, M. 1992. Occurrence of Two Species of Lucifer (Dendrobranchiata: Sergestoidea: Luciferidae) off the Pacific Coast of America. Journal of Crustacean Biology 12:104–110.

Dual cameras provide bigger picture

By Hunter Warick, Research Technician, Geospatial Ecology of Marine Megafauna Lab, Marine Mammal Institute

When monitoring the health of a capital breeding species, such as whales that store energy to support reproduction costs, it is important to understand what processes and factors drive the status of their body condition. Information gained will allow for better insight into their cost of reproduction and overall life history strategies.

For the past four years the GEMM Lab has utilized the perspective that Unoccupied Aerial Systems (UAS; or ‘drones’) provide for observations of marine mammals. This aerial perspective has documented gray whale behavior such as jaw snapping, drooling mud, and headstands, all of which shows or suggest foraging (Torres et al. 2018). However, UAS is limited to a bird’s eye view, allowing us to see WHAT whales are doing, but limited information about the reasons WHY. To overcome this hurdle, Leigh Torres and team have equipped their marine mammal research utility belts with the use of GoPro cameras. They developed a technique known as the “GoPro drop” where a GoPro camera mounted to a weighted pole is lowered off the side of the research vessel in waters < 20 m deep via a line to record video data. This technique allows the team to obtain fine-scale habitat and prey variation information, like what the whale experiences. Along with the context provided by the UAS, this dual camera perspective allows for deeper insight into gray whale foraging strategies and efficiency. Torres’s GoPro data analysis protocol examines kelp density, kelp health, benthic substrate, rock fish density, and mysid density. These characteristics are graded along a scale (Figure 1), allowing for relative comparisons of habitat and prey availability between where whales spend time and forage. These GoPro drops will also help create a fine-scale benthic habitat map of the Newport field area. So, why are these data on gray whale habitat and prey important to understand?

Figure 1. The top row shows varying degrees of mysid density (low to high, left to right). Middle row illustrates different types of substrate you might encounter (reef, sandy, boulders; left to right). Bottom row shows the different levels of kelp health (poor, medium, good).

The foraging grounds are the first step in the life history domino chain reaction for many rorqual whales; if this step doesn’t go off cleanly then everything else fails to fall into place. Gray whales partake on a 15,000-20,000 km (round trip) migration, which is the longest of any known mammal (Swartz 1986). During this migration, whales spend around three months fasting in their breeding grounds (Highsmith & Coyle 1992), living only off the energy stores that they accumulated in their feeding grounds (Næss et al. 1998). These extreme conditions of existence for gray whales drive the need to be a successful forager and is why it is so crucial for them to forage in high prey density areas (Newell, C. 2009).

Mysids are a critical part of the gray whale diet in Oregon waters (Newell, C. 2009; Sullivan, F. 2017) and mysids have strong predator-prey relationships with both top-down and bottom-up control (Dunham & Duffus 2001; Newell & Cowles 2006). This unique tie illustrates the great dependency that gray whales have on mysids, further showing the benefit to looking at the density of mysids where gray whales are seen foraging. The quality of mysids may also be as important as quantity; with higher water temperatures resulting in lower lipid content in mysids (Mauchline 1980), suggesting density might not be the only factor for determining efficient whale foraging. The overall goal of gray whales on their foraging grounds is to get as fat as possible in order to reproduce as often as possible. But, this isn’t always as easy as it sounds. Gray whales typically have a two-year breeding interval but can be anywhere from 1-4 years (Blokhin 1984). The longer time it takes to build up adequate energy stores to support reproduction costs, the longer it will take to breed successfully. Building back up these energy stores can prove to be difficult, especially for lactating females (Figure 2).

Being able to track the health and behavior of gray whales on an individual level, including comparisons between variation in body condition, foraging behavior, and fine scale information on benthic communities gained through the use of GoPros, can provide a better understanding of the driving factors and impacts on their health and population trends (Figure 3).


Figure 3. A compilation of video clips captured by the GEMM Lab during their research on gray whale ecology and physiology off Newport, Oregon using Unoccupied Aerial Systems (UAS, or “drones”) and GoPro cameras. UAS are used to observe gray whale behavior and conduct photogrammetry assessment of body condition. GoPro camera drops assess the benthic habitat and prey density across the study region, with a couple chance encounters of whales. Research is conducted under NOAA/NMFS permit # 21678.

The five senses of fieldwork

By Leila Lemos, PhD student


This summer was full of emotions for me: I finally started my first fieldwork season after almost a year of classes and saw my first gray whale (love at first sight!).

During the fieldwork we use a small research vessel (we call it “Red Rocket”) along the Oregon coast to collect data for my PhD project. We are collecting gray whale fecal samples to analyze hormone variations; acoustic data to assess ambient noise changes at different locations and also variations before, during and after events like the “Halibut opener”; GoPro recordings to evaluate prey availability; photographs in order to identify each individual whale and assess body and skin condition; and video recordings through UAS (aka “drone”) flights, so we can measure the whales and classify them as skinny/fat, calf/juvenile/adult and pregnant/non-pregnant.

However, in order to collect all of these data, we need to first find the whales. This is when we use our first sense: vision. We are always looking at the horizon searching for a blow to come up and once we see it, we safely approach the animal and start watching the individual’s behavior and taking photographs.

If the animal is surfacing regularly to allow a successful drone overflight, we stay with the whale and launch the UAS in order to collect photogrammetry and behavior data.

Each team member performs different functions on the boat, as seen in the figure below.

Figure 1: UAS image showing each team members’ functions in the boat at the moment just after the UAS launch.


While one member pilots the boat, another operates the UAS. Another team member is responsible for taking photos of the whales so we can match individuals with the UAS videos. And the last team member puts the calibration board of known length in the water, so that we can later calculate the exact size of each pixel at various UAS altitudes, which allows us to accurately measure whale lengths. Team members also alternate between these and other functions.

Sometimes we put the UAS in the air and no whales are at the surface, or we can’t find any. These animals only stay at the surface for a short period of time, so working with whales can be really challenging. UAS batteries only last for 15-20 minutes and we need to make the most of that time as we can. All of the members need to help the UAS pilot in finding whales, and that is when, besides vision, we need to use hearing too. The sound of the whale’s respiration (blow) can be very loud, especially when whales are closer. Once we find the whale, we give the location to the UAS pilot: “whale at 2 o’clock at 30 meters from the boat!” and the pilot finds the whale for an overflight.

The opposite – too many whales around – can also happen. While we are observing one individual or searching for it in one direction, we may hear a blow from another whale right behind us, and that’s the signal for us to look for other individuals too.

But now you might be asking yourself: “ok, I agree with vision and hearing, but what about the other three senses? Smell? Taste? Touch?” Believe it or not, this happens. Sometimes whales surface pretty close to the boat and blow. If the wind is in our direction – ARGHHHH – we smell it and even taste it (after the first time you learn to close your mouth!). Not a smell I recommend.

Fecal samples are responsible for the 5th sense: touch!

Once we identify that the whale pooped, we approach the fecal plume in order to collect as much fecal matter as possible (Fig.2).

Figure 2: A: the poop is identified; B: the boat approaches the feces that are floating at the surface (~30 seconds); C: one of the team members remains at the bow of the boat to indicate where the feces are; D: another team member collects it with a fine-mesh net. Filmed under NOAA/NMFS permit #16111 to John Calambokidis).


After collecting the poop we transfer all of it from the net to a small jar that we then keep cool in an ice chest until we arrive back at the lab and put it in the freezer. So, how do we transfer the poop to the jar? By touching it! We put the jar inside the net and transfer each poop spot to the jar with the help of water pressure from a squeeze bottle full of ambient salt water.

Figure 3: Two gray whale individuals swimming around kelp forests. Filmed under NOAA/NMFS permit #16111 to John Calambokidis).


That’s how we use our senses to study the whales, and we also use an underwater sensory system (a GoPro) to see what the whales were feeding on.

GoPro video of mysid swarms that we recorded near feeding gray whales in Port Orford in August 2016:

Our fieldwork is wrapping up this week, and I can already say that it has been a success. The challenging Oregon weather allowed us to work on 25 days: 6 days in Port Orford and 19 days in the Newport and Depoe Bay region, totaling 141 hours and 50 minutes of effort. We saw 195 whales during 97 different sightings and collected 49 fecal samples. We also performed 67 UAS flights, 34 drifter deployments (to collect acoustic data), and 34 GoPro deployments.

It is incredible to see how much data we obtained! Now starts the second part of the challenge: how to put all of this data together and find the results. My next steps are:

– photo-identification analysis;

– body and skin condition scoring of individuals;

– photogrammetry analysis;

– analysis of the GoPro videos to characterize prey;

– hormone analysis laboratory training in November at the Seattle Aquarium


For now, enjoy some pictures and a video we collected during the fieldwork this summer. It was hard to choose my favorite pictures from 11,061 photos and a video from 13 hours and 29 minutes of recording, but I finally did! Enjoy!

Figure 4: Gray whale breaching in Port Orford on August 27th. (Photo by Leila Lemos; Taken under NOAA/NMFS permit #16111 to John Calambokidis).


Figure 5: Rainbow formation through sunlight refraction on the water droplets of a gray whale individual's blow in Newport on September 15th. (Photo by Leila Lemos; Taken under NOAA/NMFS permit #16111 to John Calambokidis).
Figure 5: Rainbow formation through sunlight refraction on the water droplets of a gray whale individual’s blow in Newport on September 15th. (Photo by Leila Lemos; Taken under NOAA/NMFS permit #16111 to John Calambokidis).


Likely gray whale nursing behavior (Taken under NOAA/NMFS permit #16111 to John Calambokidis):