By: Kate Colson, MSc Student, University of British Columbia, Institute for the Oceans and Fisheries, Marine Mammal Research Unit
Hello! My name is Kate Colson and I am a master’s student at the University of British Columbia, co-supervised by Dr. Andrew Trites of the Marine Mammal Research Unit and Dr. Leigh Torres of the GEMM Lab. As part of my thesis work, I have had the opportunity to spend the summer field season with Leigh and the GEMM Lab team.
For my master’s I am studying the foraging energetics of Pacific Coast Feeding Group (PCFG) gray whales as part of the much larger Gray whale Response to Ambient Noise Informed by Technology and Ecology (GRANITE) project. Quantifying the energy expenditure of PCFG gray whales during foraging can help establish a baseline for how disturbance impacts the ability of this unique population to meet their energy needs. Additionally, determining how many calories are burned during different PCFG foraging behaviors might help explain why some gray whales are in better body condition than others.
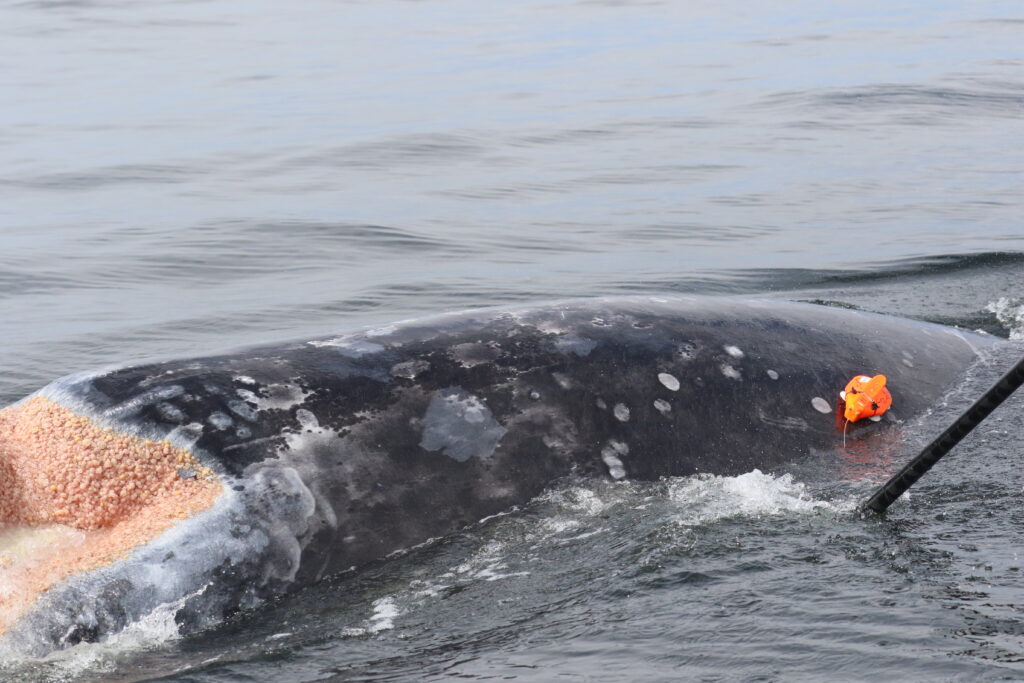
To understand how much energy different PCFG foraging behaviors cost, I am using data from suction cup tags we have temporarily applied on PCFG gray whales (Figure 1). You can read more about the why the GEMM Lab started using these tags in an earlier blog here. What I want to talk about in this blog is how exactly we can use this tag data to estimate energy expenditure of PCFG gray whales.
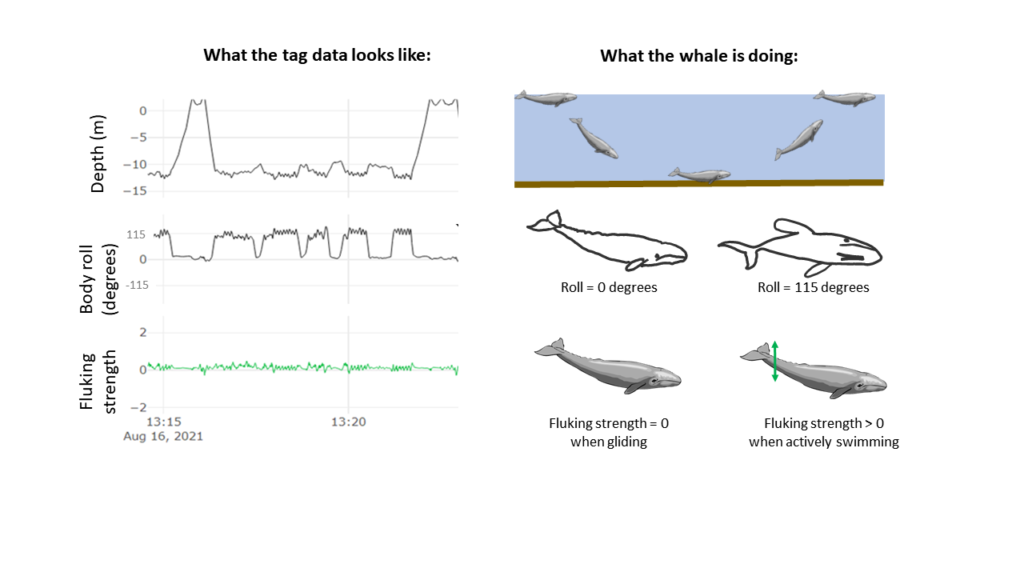
The suction cups tags used in this project have many data sensors that are useful for describing the movement of the tagged whale including accelerometers, magnetometers, gyroscopes, and pressure sensors, and all are sampling at high frequencies. For example, the accelerometer is taking 400 measurements per second! The accelerometer, magnetometer, and gyroscope take measurements in 3 dimensions along the X, Y, and Z-axes. The whale’s movement around the X-axis indicates roll (if the whale is swimming on its side), while movement around the Y-axis indicates pitch (if the whales head is oriented towards the surface or the sea floor). Changes in the whale’s movement around the Z-axis indicates if the whale is changing its swimming direction. Together, all of these sensors can describe the dive profile, body orientation, fluking behavior, and fine-scale body movements of the animal down to the second (Figure 2). This allows for the behavior of the tagged whale to be specifically described for the entirety of the tag deployment.
Although these suction cup tags are a great advancement in collecting fine-scale data, they do not have a sensor that actually measures the whale’s metabolism, or rate of calories burned by the whale. Thus, to use this fine-scale tag data as an estimate for energy expenditure, a summary metric must be calculated from the data and used as a proxy. The most common metric found in the literature is Overall Dynamic Body Acceleration (ODBA) and many papers have been published discussing the pros and cons of using ODBA as a proxy for energy expenditure (Brown et al., 2013; Gleiss et al., 2011; Halsey, 2017; Halsey et al., 2011; Wilson et al., 2020). The theory behind ODBA is that because an animal’s metabolic rate is primarily comprised of movement costs, then measuring the acceleration of the body is an effective way of determining energy expenditure. This theory might seem very abstract, but if you have ever worn a Fitbit or similar fitness tracking device to estimate how many calories you’ve burned during a workout, the same principle applies. Those fitness devices use accelerometers and other sensors, to measure the movement of your limbs and produce estimates of energy used.
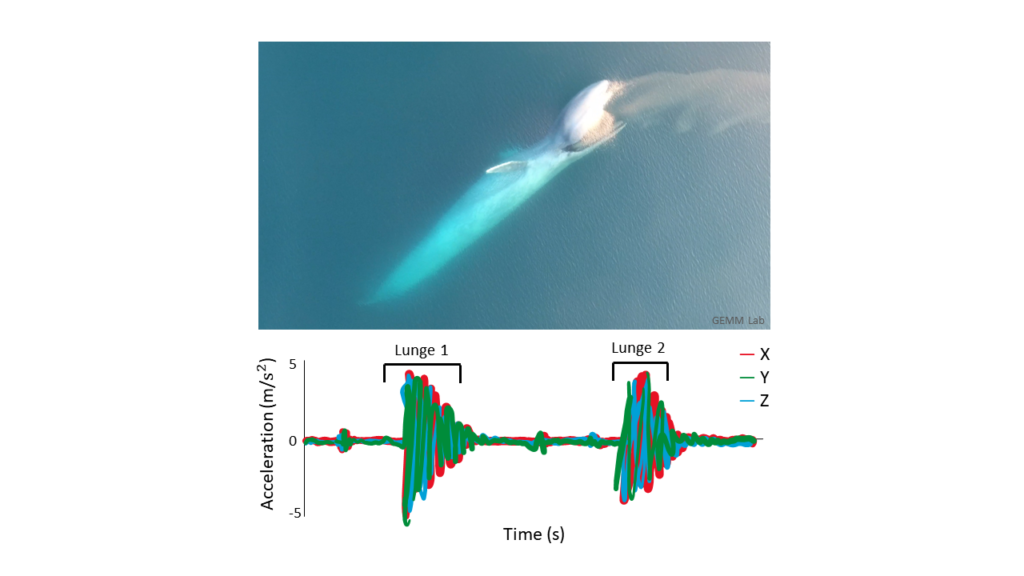
So now that we’ve established that the goal of my research is to essentially use these suction cup tags as Fitbits for PCFG gray whales, let’s look at how accelerometry data has been used to detect foraging behavior in large whales so far. Many accelerometry tagging studies have used rorquals as a focal species (see Shadwick et al. (2019) for a review). Well-known rorqual species include humpback, fin, and blue whales. These species forage by using lunges to bulk feed on dense prey patches in the water column. Foraging lunges are indicated by isolated periods of high acceleration that are easily detectable in the tag data (Figure 3; Cade et al., 2016; Izadi et al., 2022).
However, gray whales feed very differently from rorquals. Gray whales primarily suction feed on the benthos, using their head to dig into the sediment and filter prey out of the mud using their baleen. Yet, PCFG gray whales often perform many other foraging behaviors such as headstanding and side-swimming (Torres et al., 2018). Additionally, PCFG gray whales tend to feed in water depths that are often shallower than their body length. This shallow depth makes it difficult to isolate signals of foraging in the accelerometry data from random variation in the data and separate the tag data into periods of foraging behaviors (Figure 4).
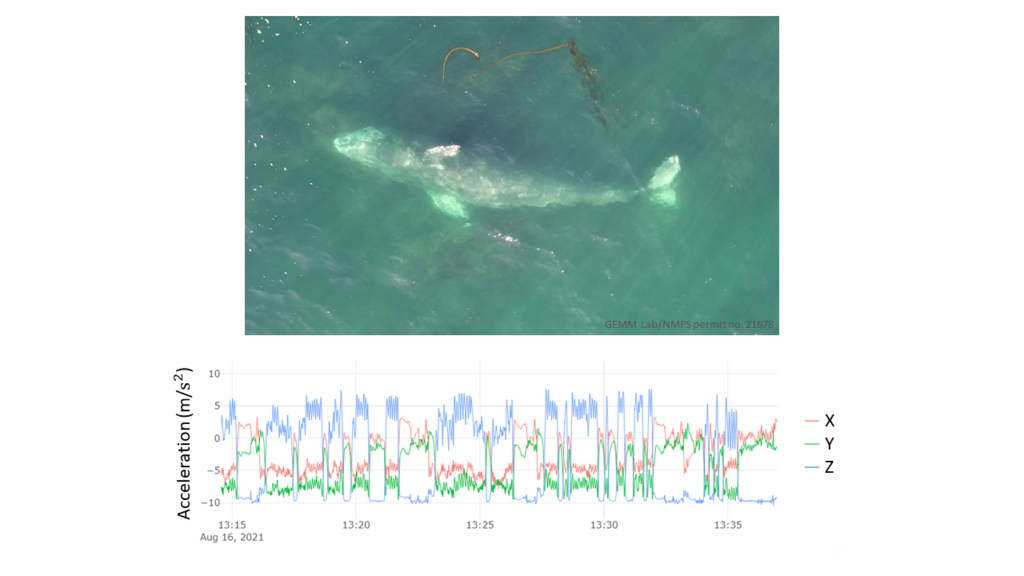
But there is still hope! Thanks to the GEMM Lab’s previous work describing the foraging behavior of the PCFG sub-group using drone footage, and the video footage available from the suction cup tags deployed on PCFG gray whales, the body orientation calculated from the tag data can be a useful indication of foraging. Specifically, high body roll is apparent in many foraging behaviors known to be used by the PCFG, and when the tag data indicates that the PCFG gray whale is rolled onto its sides, lots of sediment (and sometimes even swarms of mysid prey) is seen in the tag video footage. Therefore, I am busy isolating these high roll events in the collected tag data to identify specific foraging events.
My next steps after isolating all the roll events will be to use other variables such as duration of the roll event and body pitch (i.e., if the whales head is angled down), to define different foraging behaviors present in the tag data. Then, I will use the accelerometry data to quantify the energetic cost of performing these behaviors, perhaps using ODBA. Hopefully when I visit the GEMM Lab again next summer, I will be ready to share which foraging behavior leads to PCFG gray whales burning the most calories!
References:
Brown, D. D., Kays, R., Wikelski, M., Wilson, R., & Klimley, A. P. (2013). Observing the unwatchable through acceleration logging of animal behavior. Animal Biotelemetry, 1(1), 1–16. https://doi.org/10.1186/2050-3385-1-20
Cade, D. E., Friedlaender, A. S., Calambokidis, J., & Goldbogen, J. A. (2016). Kinematic diversity in rorqual whale feeding mechanisms. Current Biology, 26(19), 2617–2624. https://doi.org/10.1016/j.cub.2016.07.037
Duley, P. n.d. Fin whales feeding [photograph]. NOAA Northeast Fisheries Science Center Photo Gallery. https://apps-nefsc.fisheries.noaa.gov/rcb/photogallery/finback-whales.html
Gleiss, A. C., Wilson, R. P., & Shepard, E. L. C. (2011). Making overall dynamic body acceleration work: On the theory of acceleration as a proxy for energy expenditure. Methods in Ecology and Evolution, 2(1), 23–33. https://doi.org/10.1111/j.2041-210X.2010.00057.x
Halsey, L. G. (2017). Relationships grow with time: A note of caution about energy expenditure-proxy correlations, focussing on accelerometry as an example. Functional Ecology, 31(6), 1176–1183. https://doi.org/10.1111/1365-2435.12822
Halsey, L. G., Shepard, E. L. C., & Wilson, R. P. (2011). Assessing the development and application of the accelerometry technique for estimating energy expenditure. Comparative Biochemistry and Physiology – A Molecular and Integrative Physiology, 158(3), 305–314. https://doi.org/10.1016/j.cbpa.2010.09.002
Izadi, S., Aguilar de Soto, N., Constantine, R., & Johnson, M. (2022). Feeding tactics of resident Bryde’s whales in New Zealand. Marine Mammal Science, 1–14. https://doi.org/10.1111/mms.12918
Shadwick, R. E., Potvin, J., & Goldbogen, J. A. (2019). Lunge feeding in rorqual whales. Physiology, 34, 409–418. https://doi.org/10.1152/physiol.00010.2019
Torres, L. G., Nieukirk, S. L., Lemos, L., & Chandler, T. E. (2018). Drone up! Quantifying whale behavior from a new perspective improves observational capacity. Frontiers in Marine Science, 5, 1–14. https://doi.org/10.3389/fmars.2018.00319
Wilson, R. P., Börger, L., Holton, M. D., Scantlebury, D. M., Gómez-Laich, A., Quintana, F., Rosell, F., Graf, P. M., Williams, H., Gunner, R., Hopkins, L., Marks, N., Geraldi, N. R., Duarte, C. M., Scott, R., Strano, M. S., Robotka, H., Eizaguirre, C., Fahlman, A., & Shepard, E. L. C. (2020). Estimates for energy expenditure in free-living animals using acceleration proxies: A reappraisal. Journal of Animal Ecology, 89(1), 161–172. https://doi.org/10.1111/1365-2656.13040

