By Abby Tomita, undergraduate student, OSU College of Earth, Ocean, and Atmospheric Sciences
From long days in Newport performing the patience-testing task of bomb calorimetry, to spending hours transfixed by the microscopic world that exists in our oceans, I recently got an amazing glimpse into the world of marine biological research working with PhD student Rachel Kaplan. She has been an amazing teacher to my fellow intern Hadley and I, showing us the basics of the research process and introducing us to so many wonderful people at NOAA and the GEMM Lab. I am in my third year studying oceanography here at OSU and had no real lab experience before this, so I was eager to explore this area of research, and not only learn new information about our oceans, but also to see the research process up close and personal.
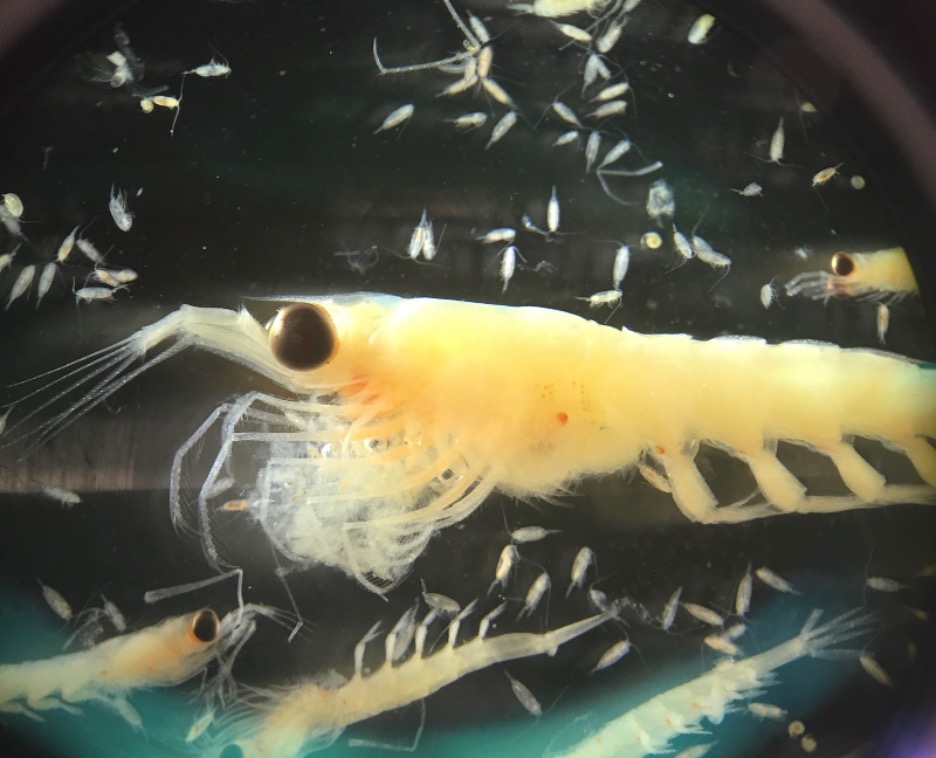
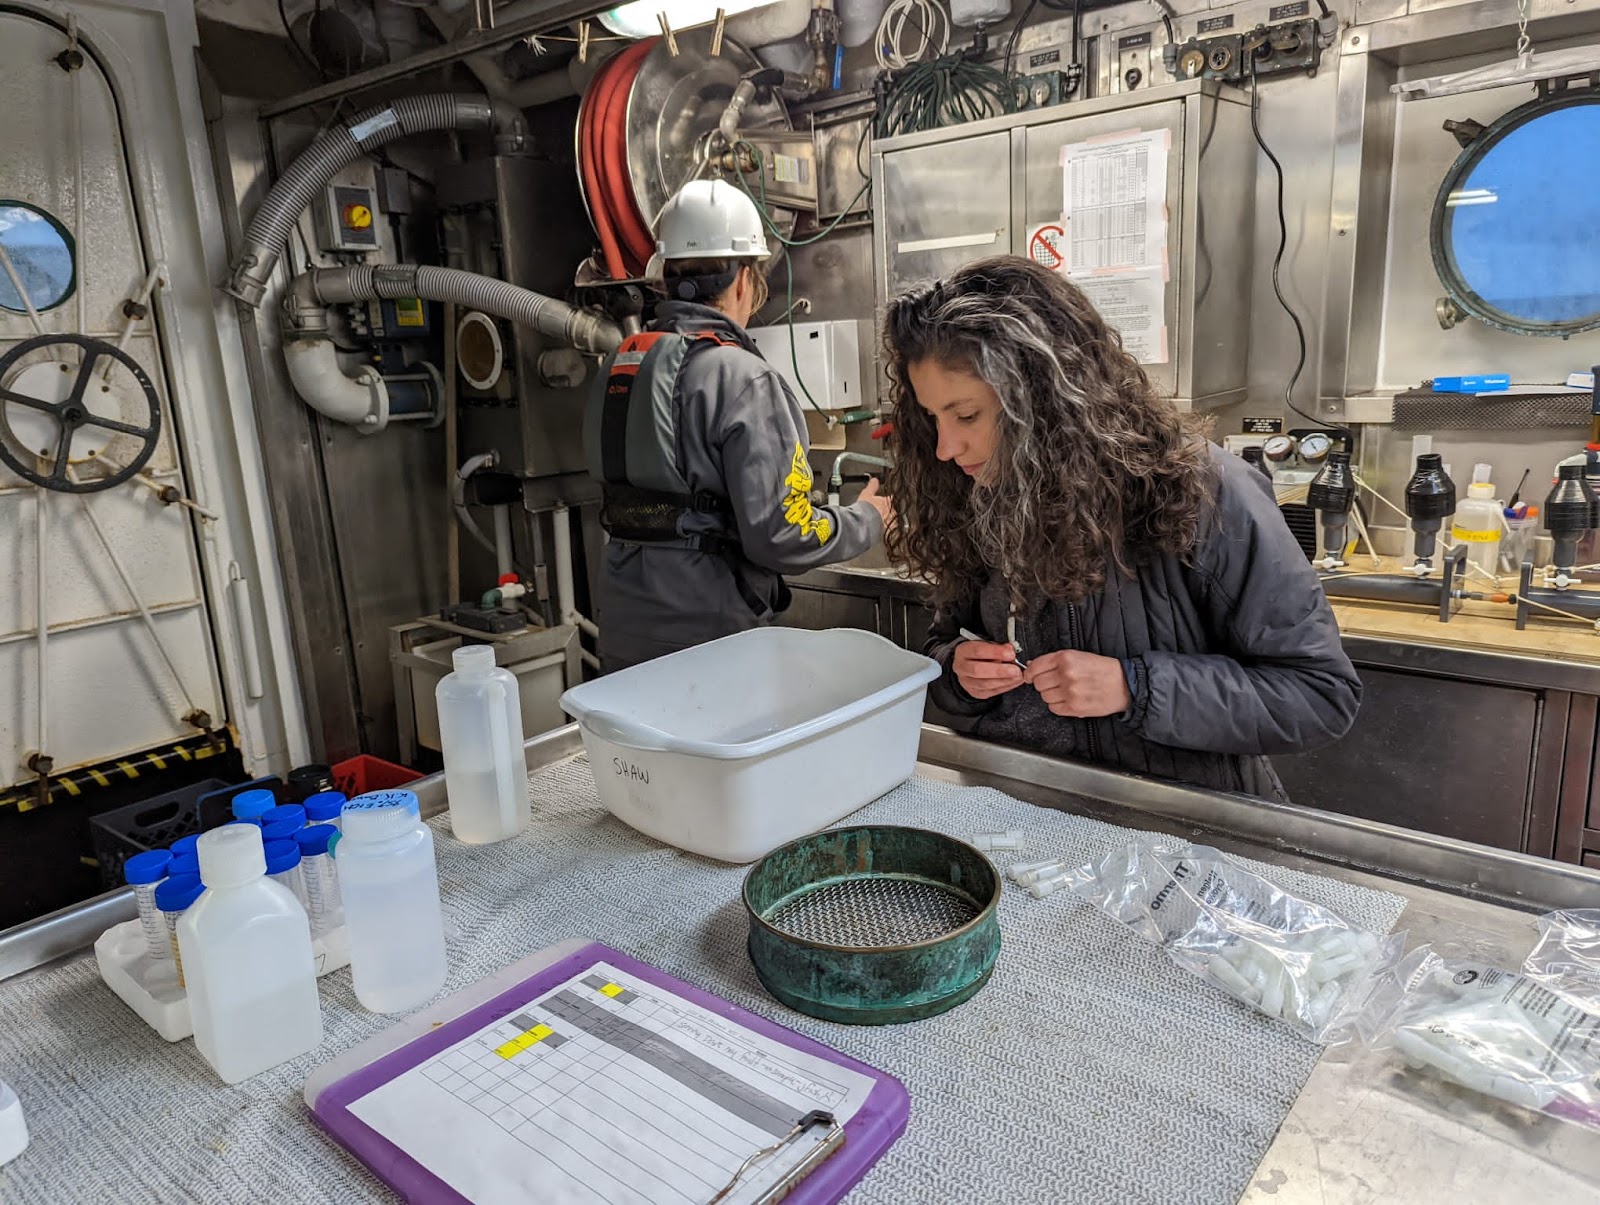
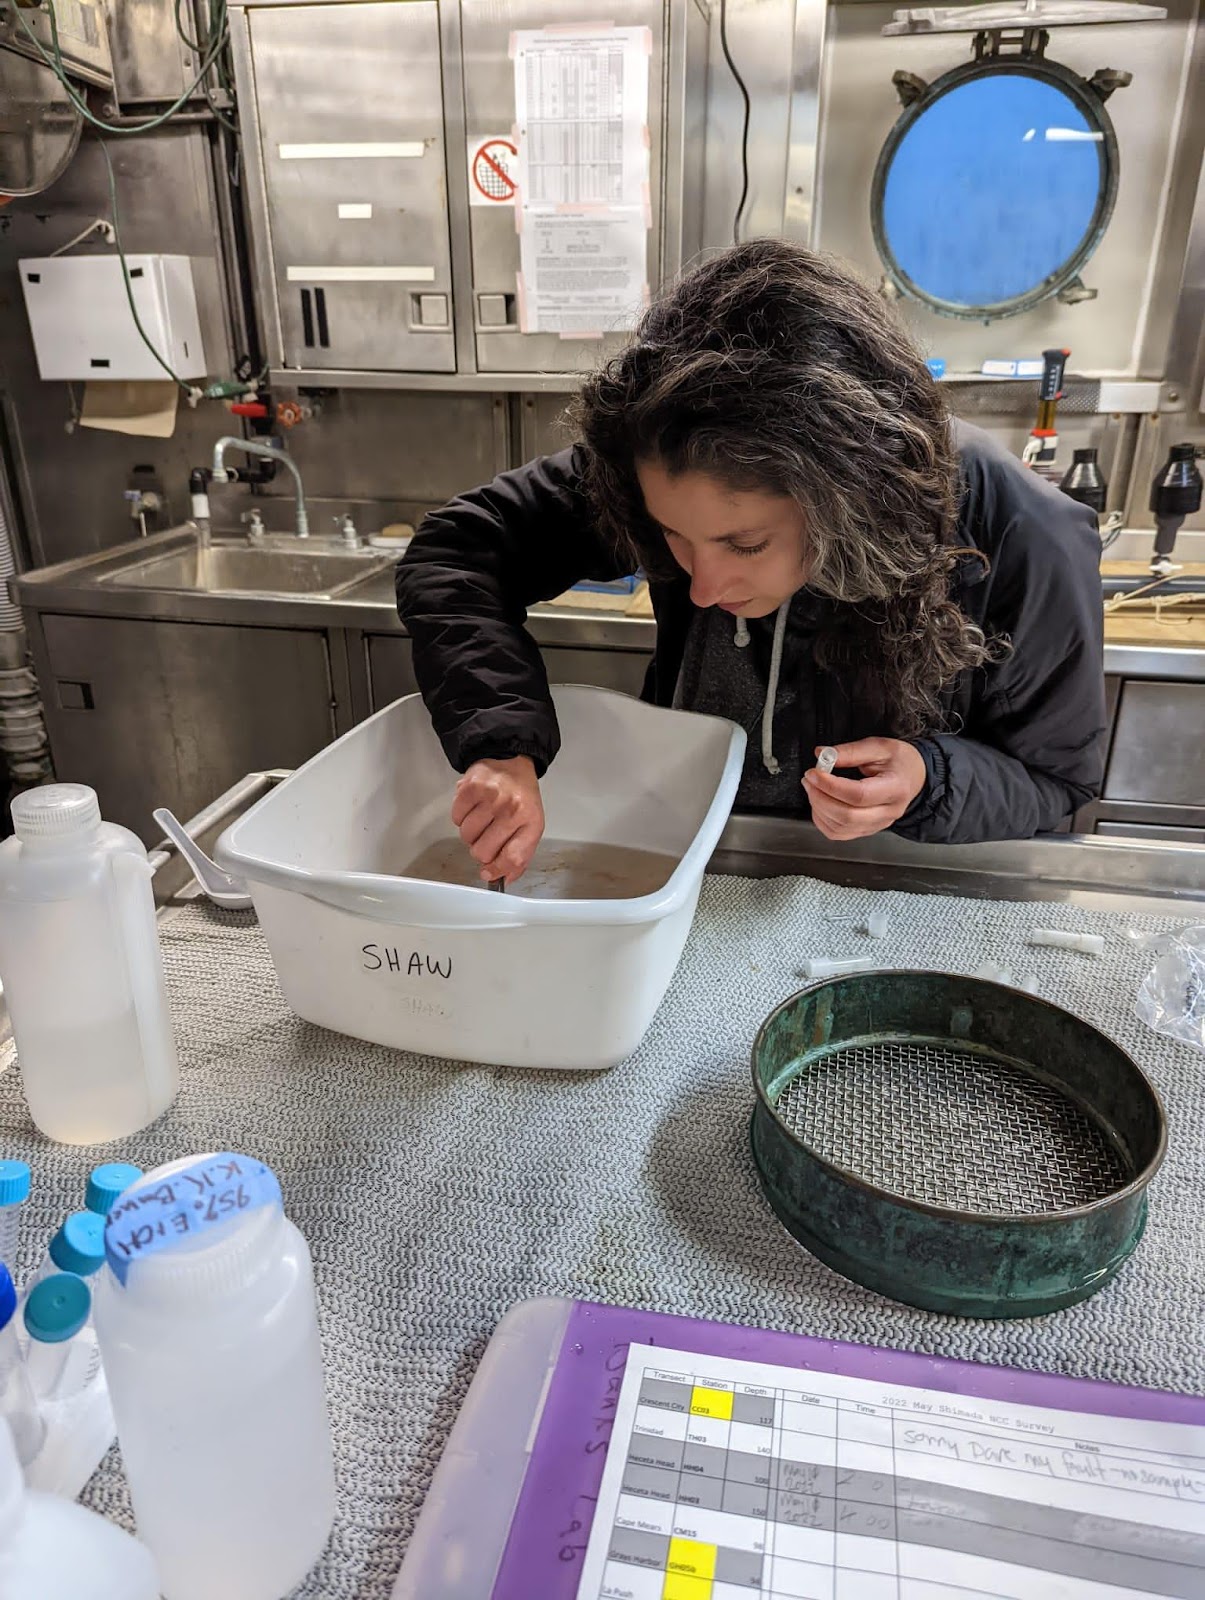
After being trained by Jennifer Fisher, a NOAA Research Fisheries Biologist, I sorted through zooplankton samples collected on the R/V Bell M. Shimada from the Northern California Current region. This data will be used to get an idea of where krill are found throughout the year, and in what abundances. Though my focus was mainly on two species of krill, I also found an assortment of other organisms, such as larval fish, squid, copepods, crabs, and tons of jellies, which were super interesting to see.
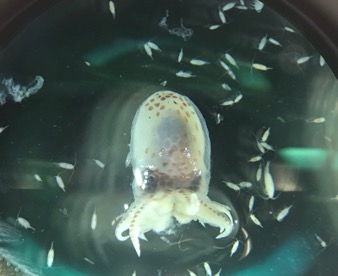
A small group of larval squid and other unknown species (photo by Abby Tomita).
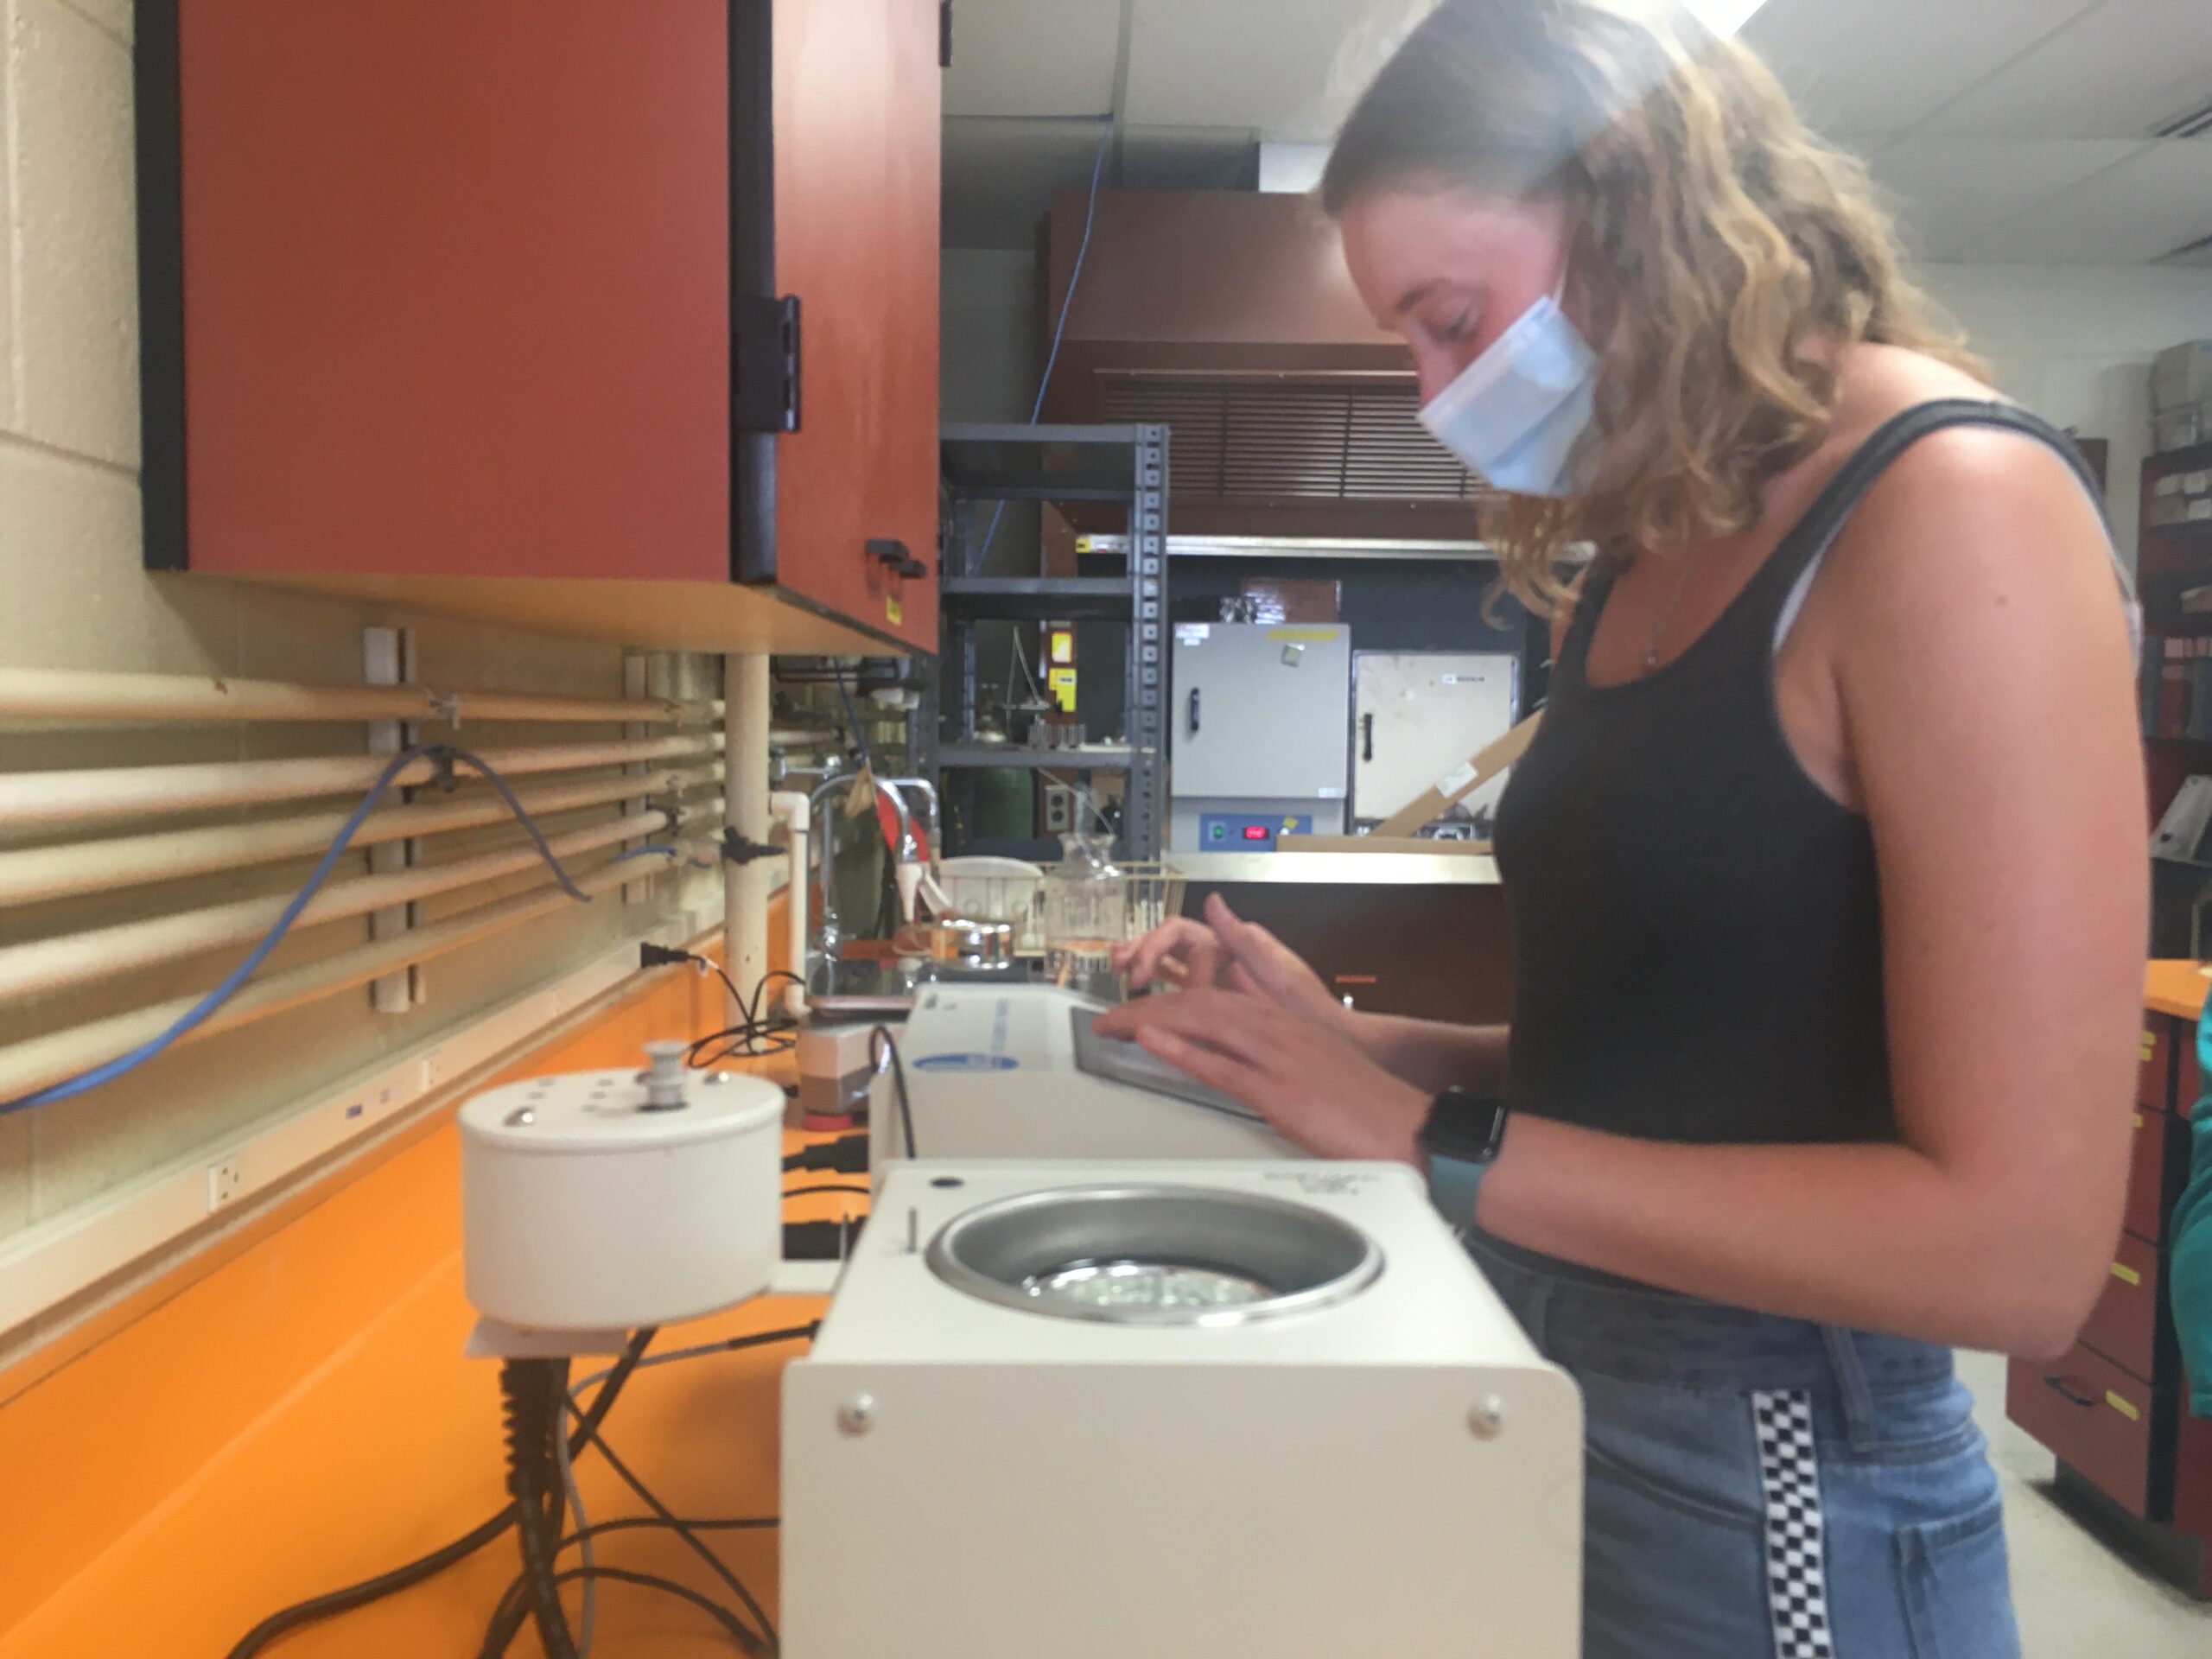
I also studied krill through a technique called bomb calorimetry, which is not for the faint of heart! It takes a tough soul to be able to put these complex little creatures into a mortar and pestle and grind them into a dust that hits your nose like pepper. They then take their final resting place into the bomb calorimetry machine (which can and will find something to fuss over) until it finally manages to ignite and dispose of the krill’s remains. The light that guided me through this dark tunnel was the knowledge that these sacrificial krill were taken in the name of science, with the aim of eventually decreasing whale entanglements.
Abby placing the pellet within the coil for the bomb.
That, and Rachel’s contagious positivity. In the early stages, we would spend the majority of our time troubleshooting after constant “misfires”, in which the machine fails to combust the sample properly. Bomb calorimetry involves many tedious steps, and working with such small quantities of tissue – a single krill could weigh 0.01 grams or even less – poses a plethora of its own challenges. One of my biggest takeaways from this experience was to have patience with this kind of work and know when to take a much-needed dance break. Things often do not work out according to plan, and getting to see first-hand how to adapt to confounding variables and hitches in the procedure was an invaluable lesson.
I also got to see how collaborative the research process is. We received helpful advice from other members of the GEMM Lab at lunch, as well as constant help from our esteemed Resident Bomb Cal Expert, Elizabeth Daly. It was comforting for me to see that even when you are doing independent research, you are not expected to only work alone, and there can be so much community in higher level research.
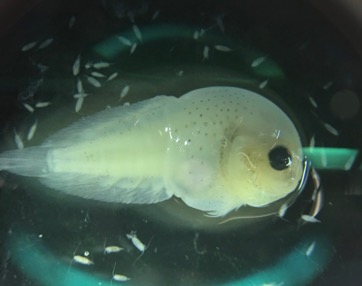
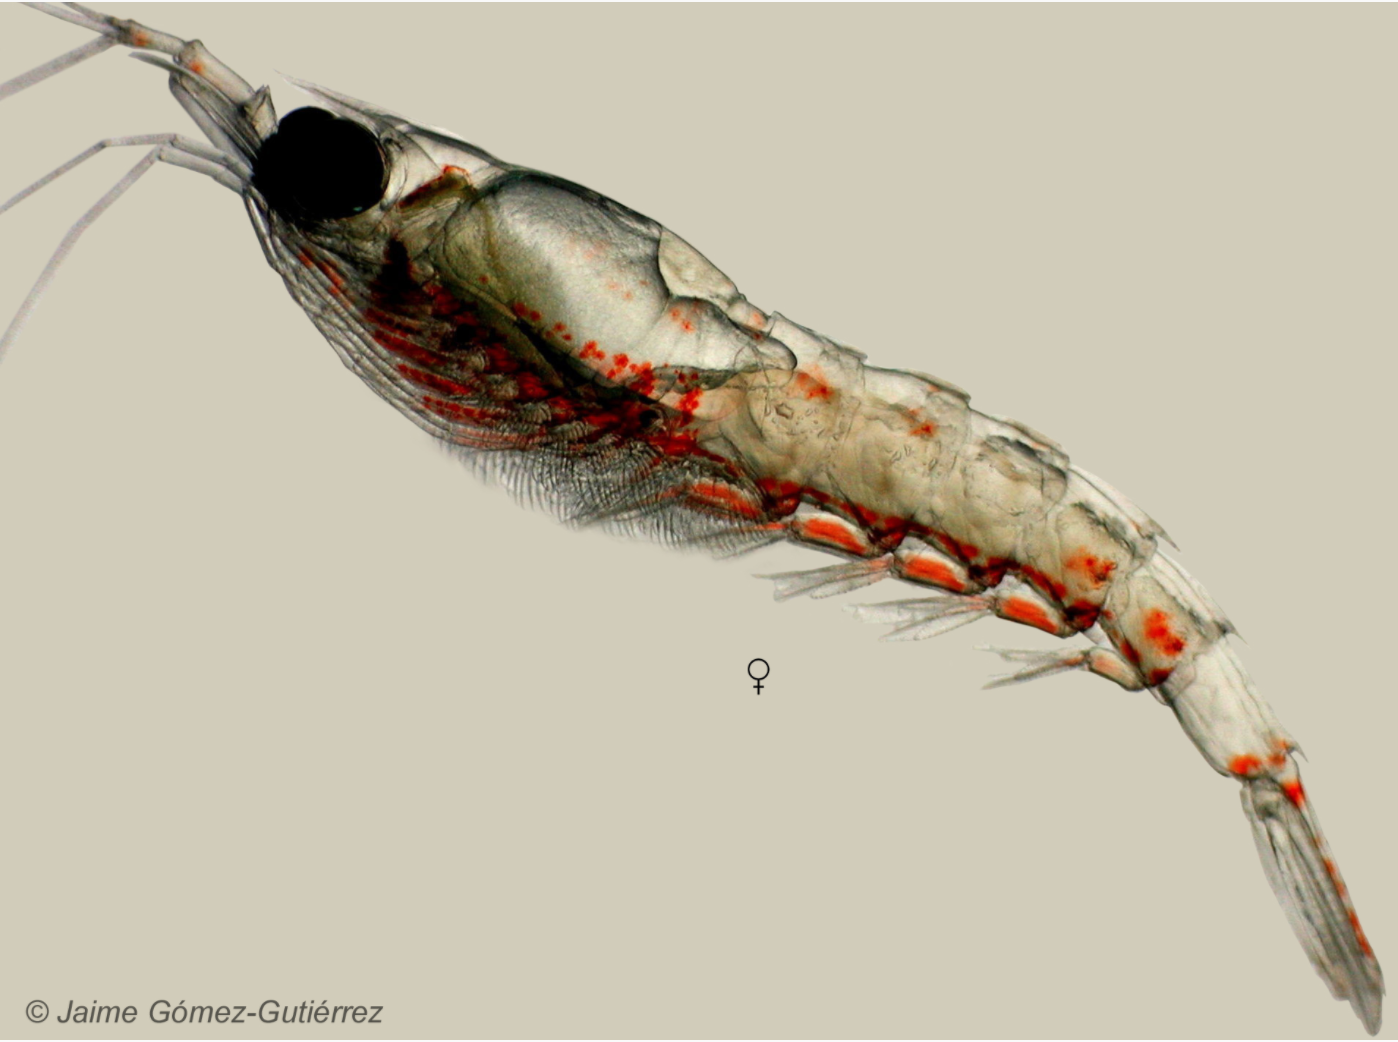
A larval snailfish.A larval fish (sp. unknown) still in its egg.A larval octopus. Female Thysanoessa spinifera krill (photos by Abby Tomita).
Did you enjoy this blog? Want to learn more about marine life, research, and conservation? Subscribe to our blog and get a weekly message when we post a new blog. Just add your name and email into the subscribe box below.
ByRachel Kaplan, PhD student, OSU College of Earth, Ocean and Atmospheric Sciences and Department of Fisheries, Wildlife, & Conservation Sciences, Geospatial Ecology of Marine Megafauna Lab
By Renee Albertson, Senior Instructor and Research Associate, OSU Department of Fisheries, Wildlife, & Conservation Sciences, Marine Mammal Institute
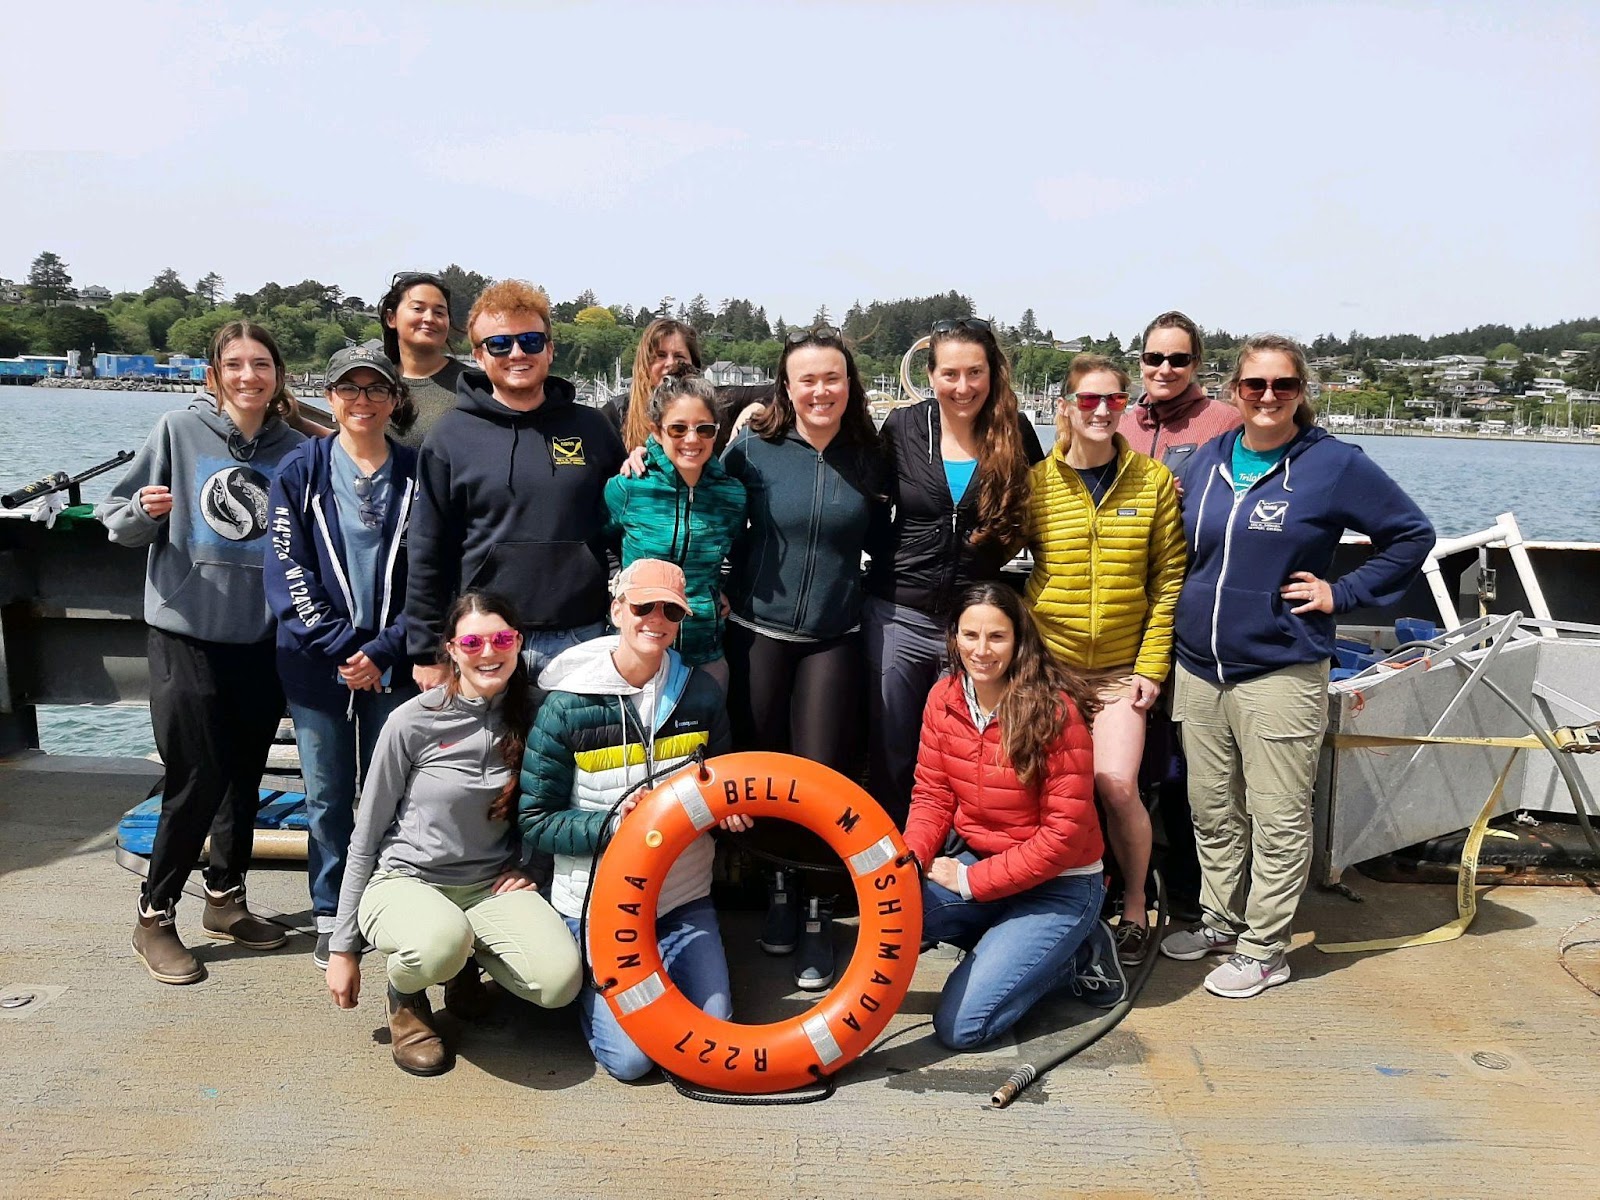
Going to sea is always full of surprises, and the most recent Northern California Current (NCC) cruise was no different. We had surprises both logistical and scientific, disappointing and delightful. By the end, what stood out clearly is that with a great team of people like the one aboard the R/VBell M. Shimada, any challenging situation is made the best of, and any exciting moment is only more so.
Our great science party enjoys the Seattle skyline at the end of the September 2022 NCC cruise.
A few days into the cruise, engine trouble caused the Commanding Officer to decide that we needed to cut the trip short, halt instrument deployment operations, and head in to port. Lucky for us, this new plan included 30 hours of transit to Seattle, and long transits are exactly when we collect marine mammal observations. We were able to keep surveying as we moved up the coast and through the Strait of Juan de Fuca into Seattle. There were many surprises here too – we did not find whales in areas where we have previously sighted many, and overall made fewer sightings than is typical.
For example, we expected to see many whales on the Heceta Head Line (south of Newport), whose shallow depth makes the region a rich underwater garden that supports prey and attracts whales. Instead, we saw hardly any whales in this area. Perhaps they simply weren’t present, or perhaps we missed spotting some whales due to the heavy fog, which makes sighting animals that are not near the ship difficult to impossible. This dearth of animals led us to have to interesting conversations with other researchers as we speculated about what might be going on. The scientists on board these NCC cruises collectively research a wide range of oceanographic fields, including ocean chemistry, phytoplankton, zooplankton, fish, seabirds, and marine mammals. Bringing these data together can provide a better understanding of how the ecosystem is changing over time and help contextualize observations in the moment.
Though we often think about how the distributions of prey structure those of foraging whales, we started to wonder whether a lower trophic level could be at play here. Interestingly, in situ phytoplankton analyses showed a type of diatom called Pseudo-nitzchia along much of our cruise track, with the highest concentration off Cape Meares. In stressful conditions, these diatoms sometimes produce the toxin domoic acid, and we wondered whether this could possibly be related to the low whale counts.
Cells of Pseudo-nitzschia, a genus of microalgae that includes several species that make the neurotoxin domoic acid. NOAA photo courtesy of Vera Trainer.
Along the northern Oregon coast and near the Columbia River, the number of whales we observed increased dramatically. The vast majority were humpbacks, some of which were quite active, breaching and tail slapping the surface of the water. On our best day, we turned into the Strait of Juan de Fuca and sighted about 20 whales in quick succession, as well as a sea otter, and both Steller and California sea lions.
Simultaneously as we surveyed for whales, we were able to continue collecting concurrent echosounder data, which reveals the presence of nearby prey like krill and forage fish. Early in the trip, other researchers also collected krill samples that we could bring back to shore and analyze for their caloric content. Even with a shorter time at sea, we felt lucky to be able to fulfill these scientific goals.
Research cruises always center around two things: science and people. Discussing the scientific surprises we observed with other researchers aboard was inspirational, and left us with interesting questions to pursue. Navigating changes to the cruise plan highlighted the importance of the people aboard even more. Everyone worked together to refine our plans with cooperation and positivity, and we all marveled at what a great group it was, often saying, “Good thing we like each other!”
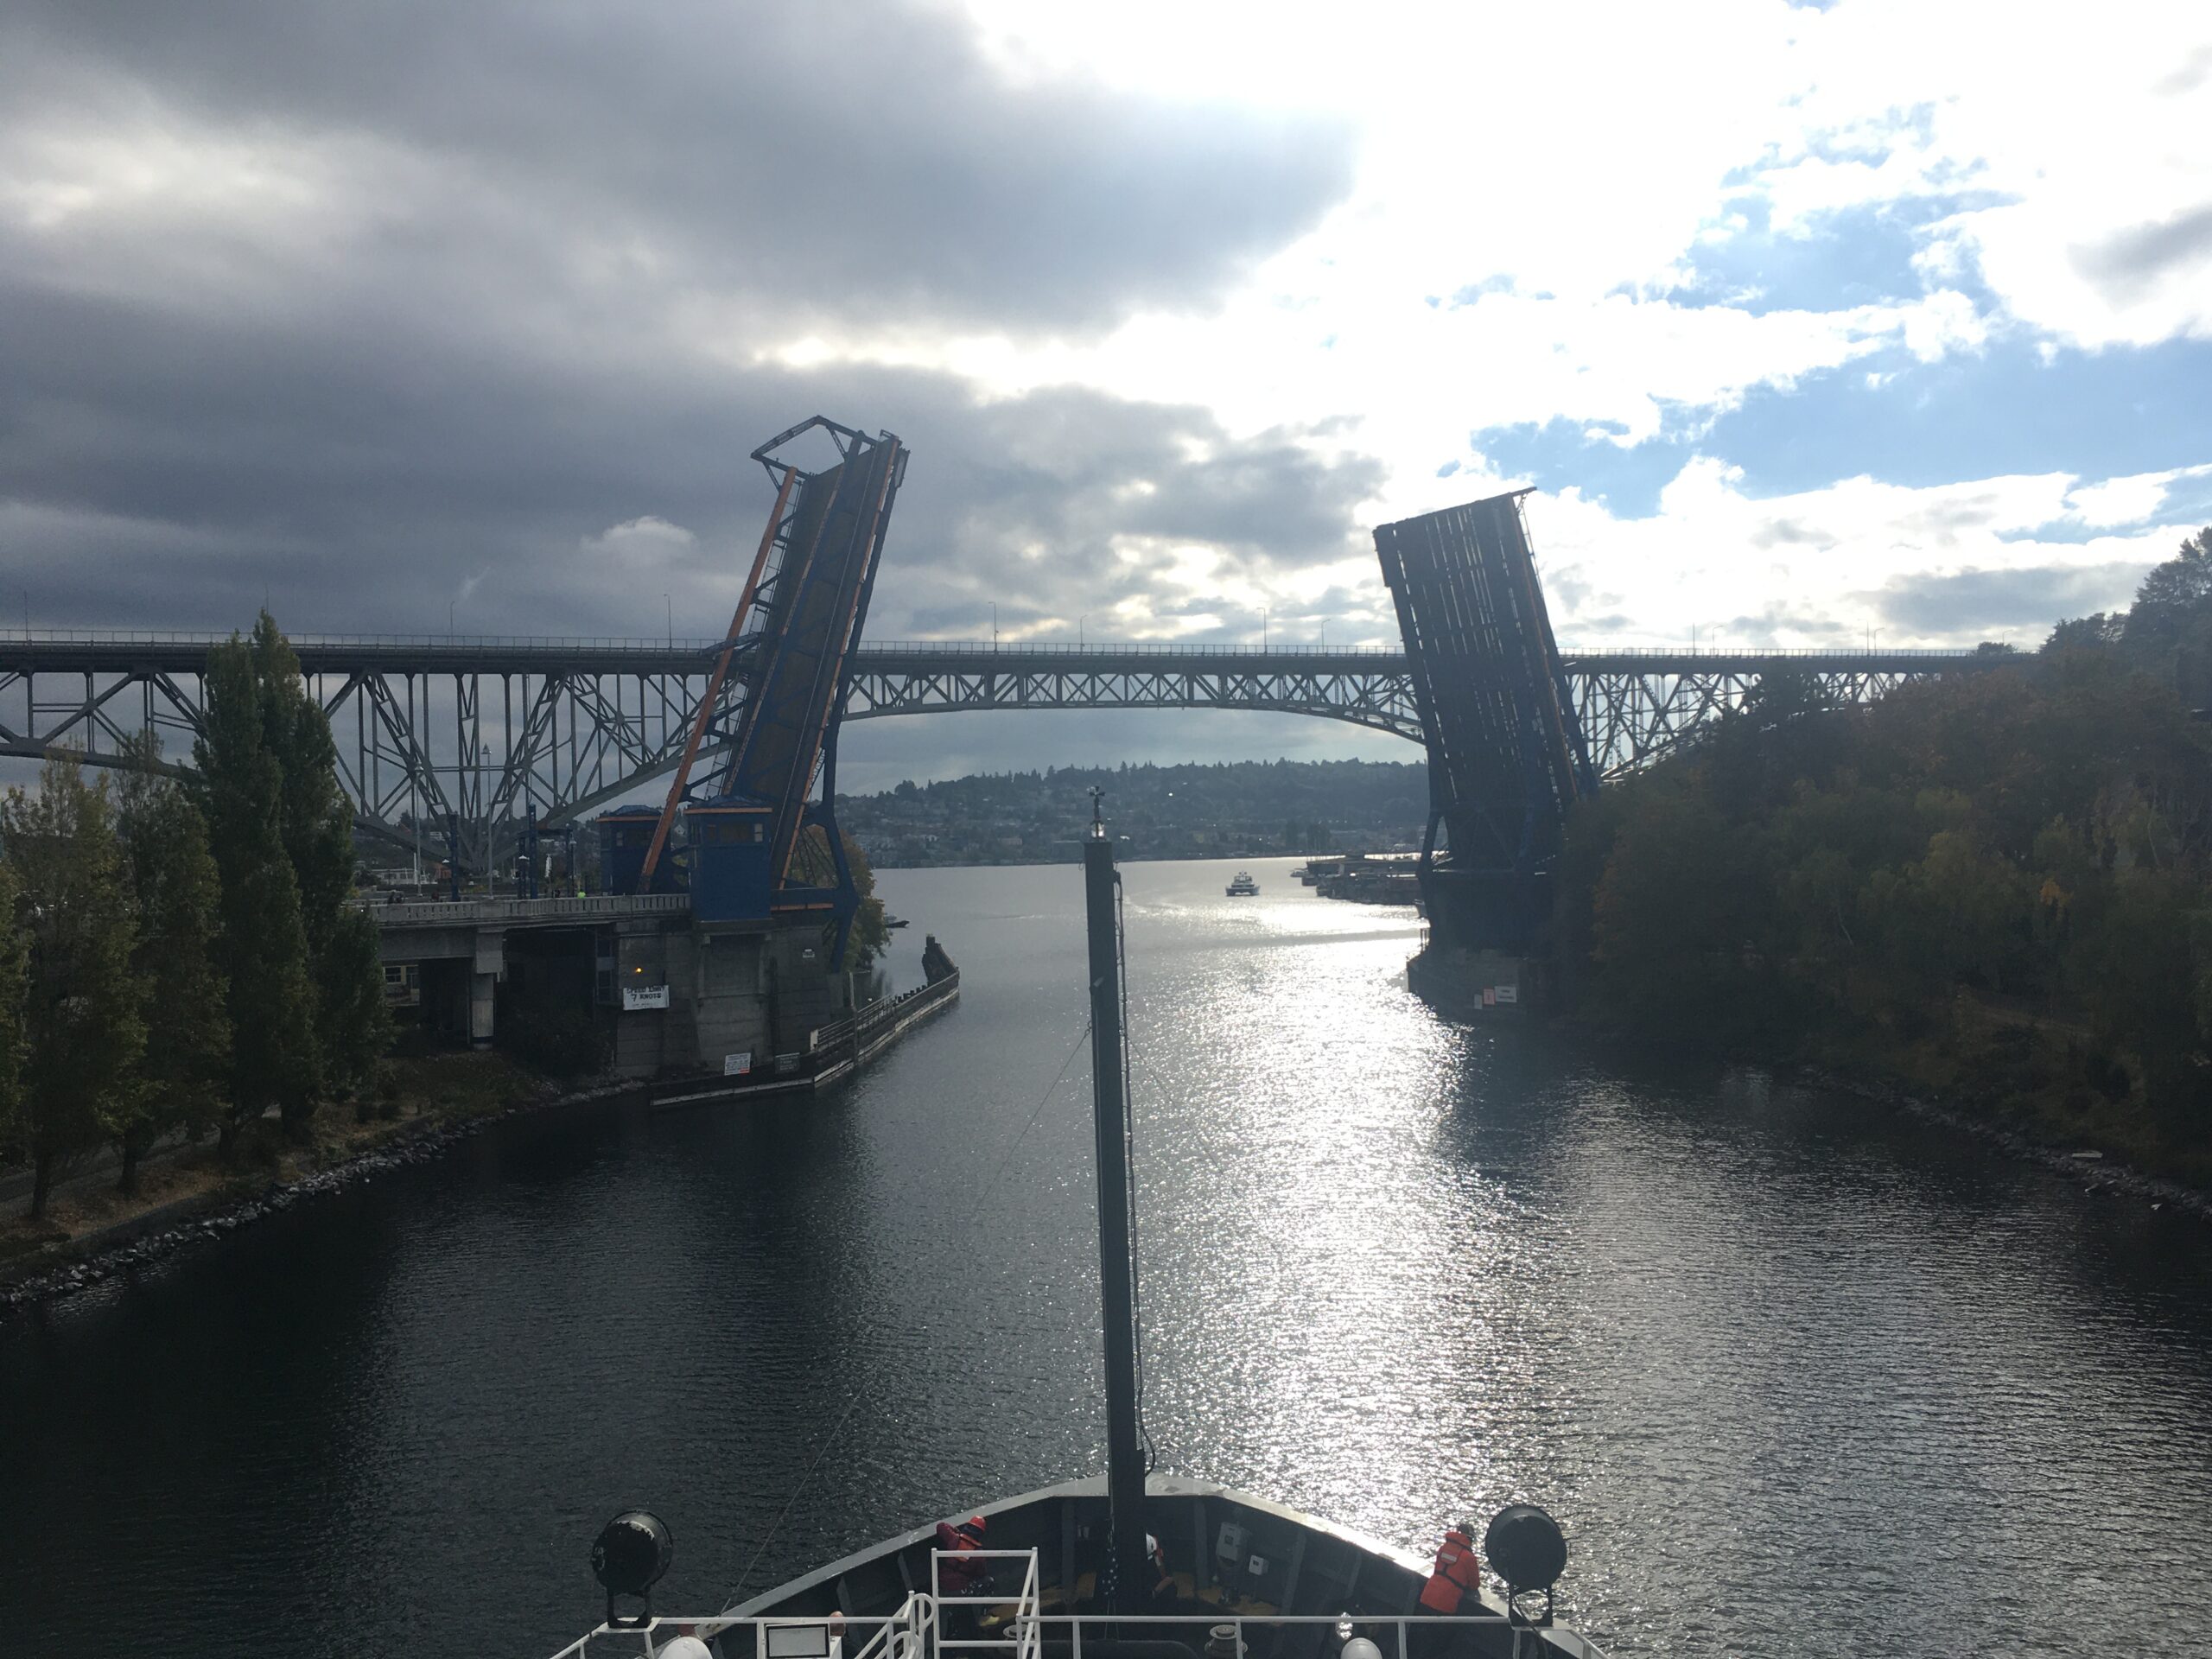
The cruise ended by transiting under the Fremont Bridge into Lake Union.
On the last day of the cruise, we transited into Seattle, moving through the Ballard Locks and into Lake Union. It was an incredible experience to see the city from the water, and an amazing way to cap off the trip. With the next NCC cruise ahead in a few months, we are excited to get back out to sea together soon and tackle whatever surprises come our way.
Did you enjoy this blog? Want to learn more about marine life, research, and conservation? Subscribe to our blog and get a weekly message when we post a new blog. Just add your name and email into the subscribe box below.
By Hadley Robinson, undergraduate student, OSU College of Earth, Ocean, and Atmospheric Sciences and School of Language, Culture, and Society
My name is Hadley Robinson and I am a sophomore undergraduate at OSU, double majoring in Environmental Science and Spanish. This summer, I had the privilege of working with Rachel on her PhD research project involving bomb calorimetry, a technique that allows you to quantify the caloric content of organisms like the zooplankton krill.
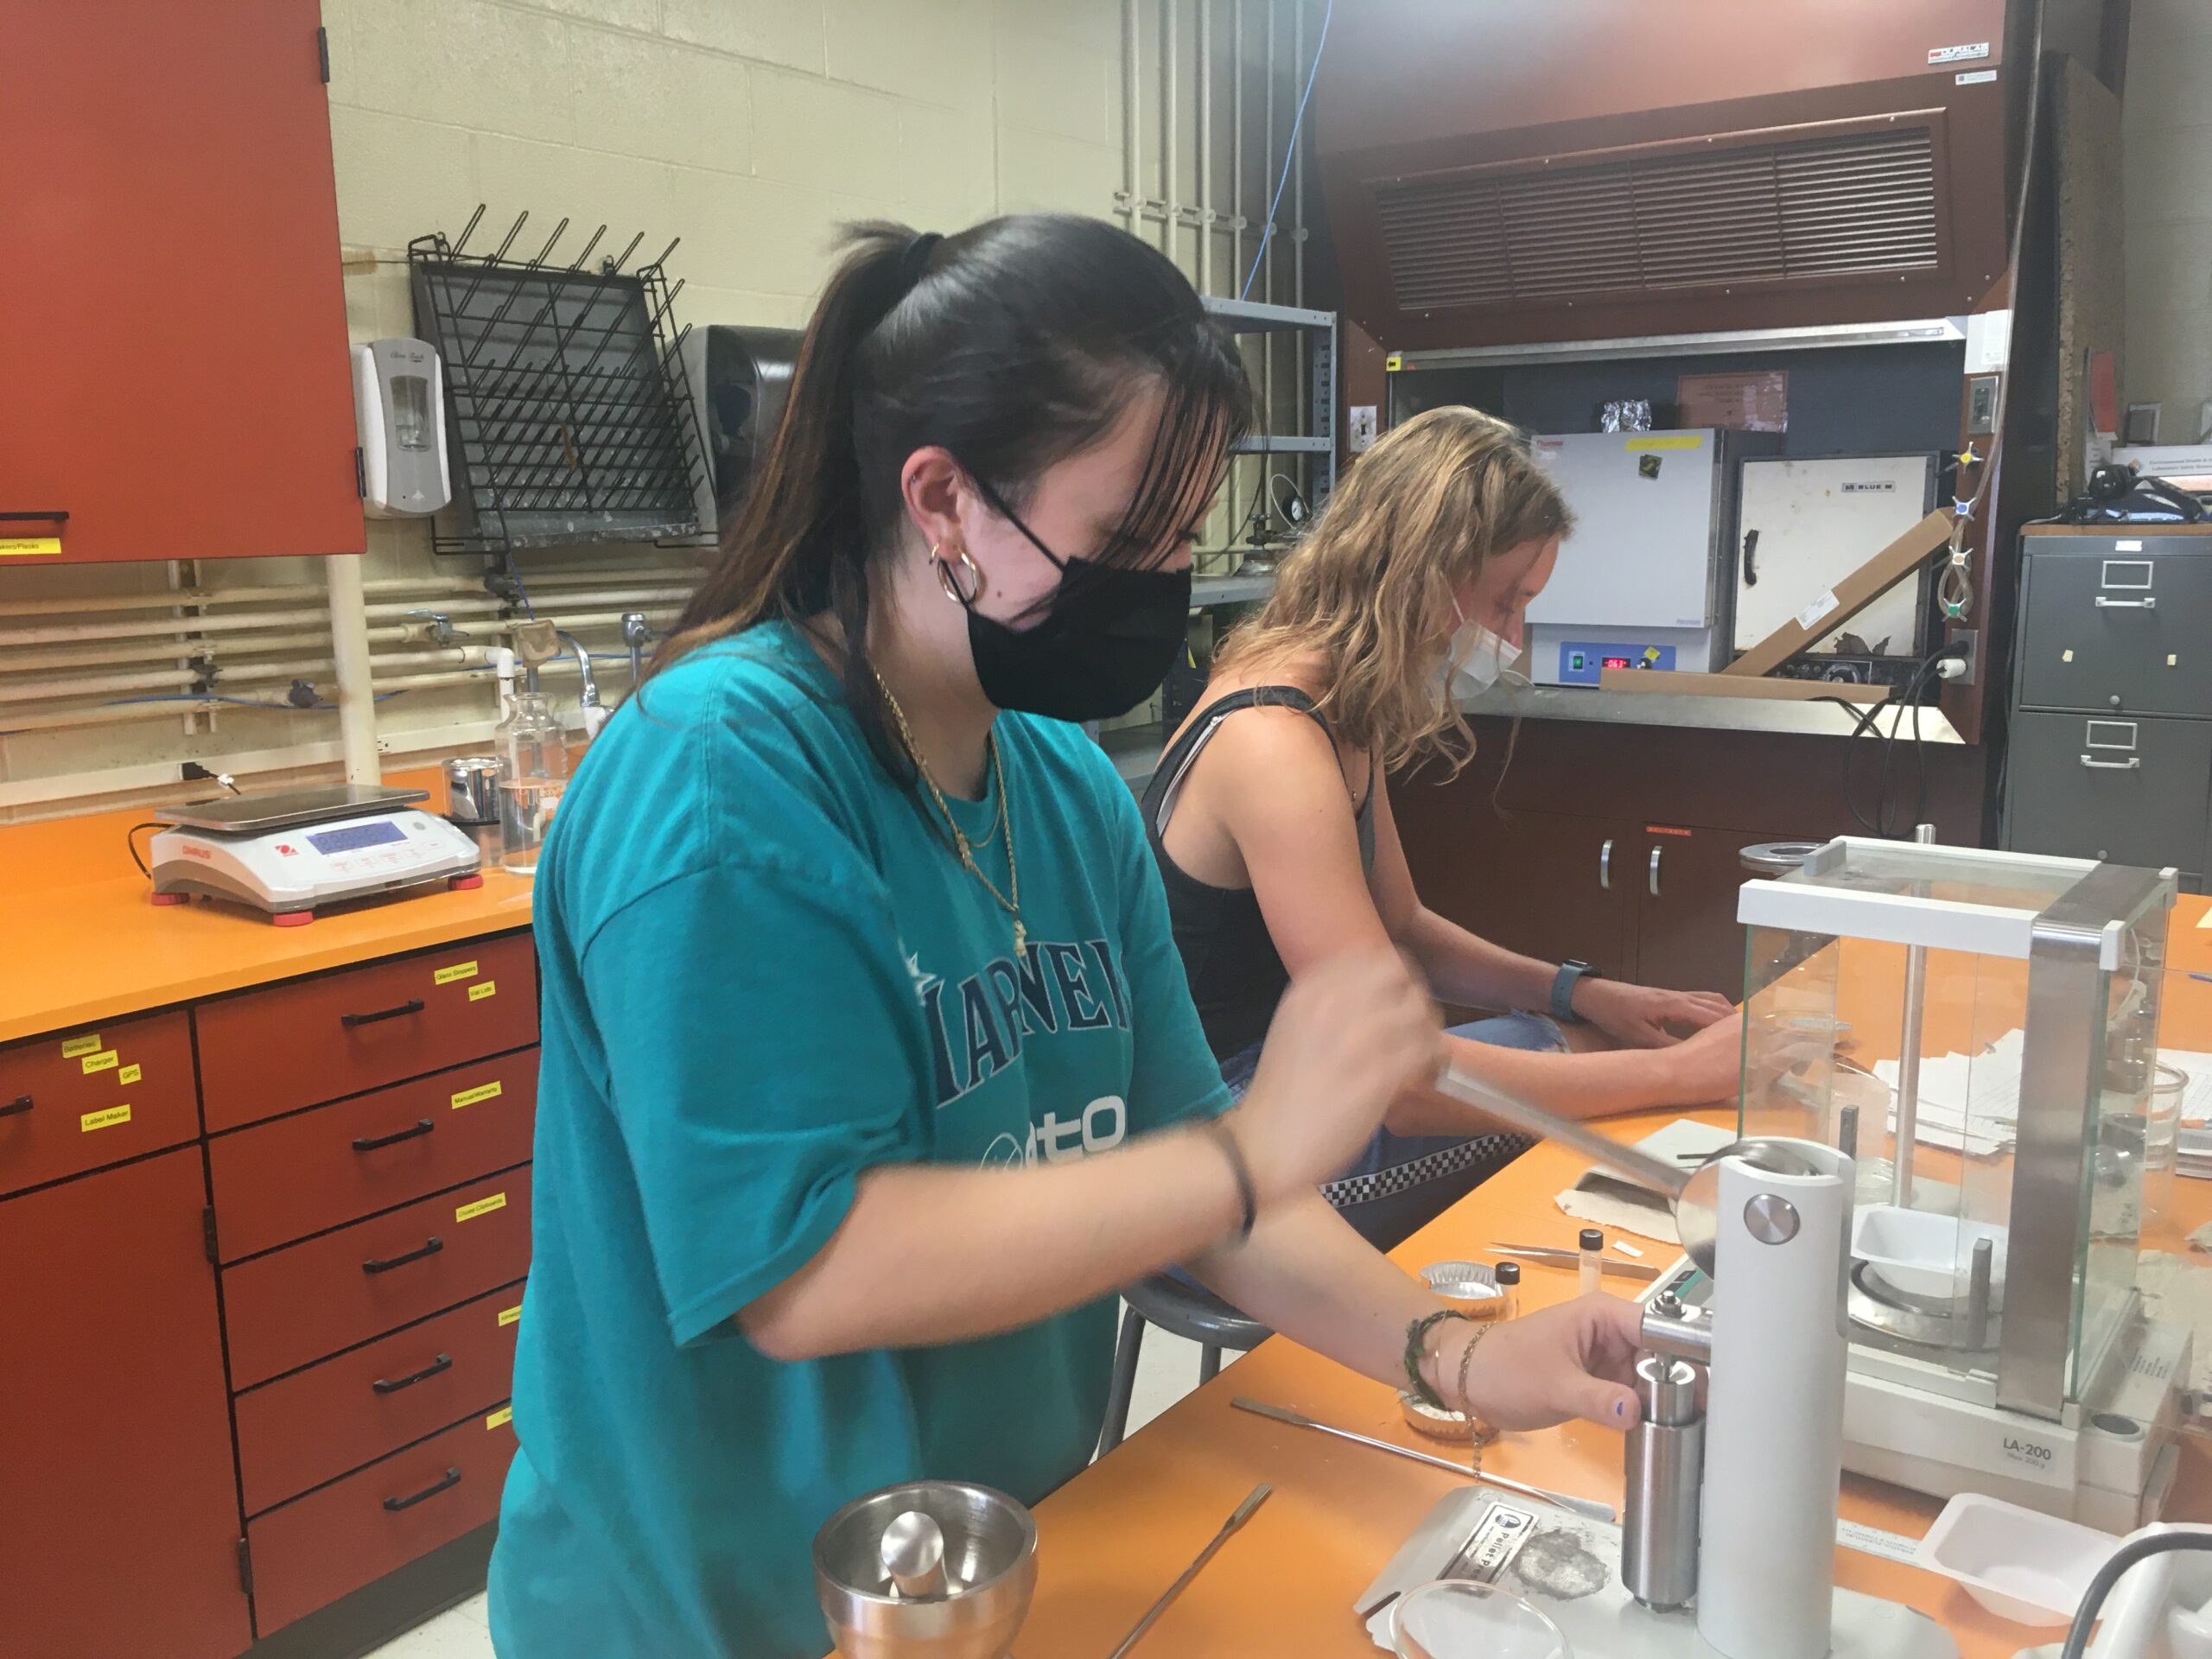
Hadley preparing the bomb calorimetry machine to run a sample (photo by Rachel Kaplan).
Prior to this internship, I had never worked in a lab before, and as an environmental science major, I had no previous exposure to oceanography. The connection that Rachel made between our labwork and the broader goal of helping decrease whale entanglement events sparked my interest in this project. Our work this summer aimed to process a set of krill samples collected off the coast of Oregon and Washington, so that we could find the number of calories in single krill, and then look at patterns in krill caloric content based on their species, sex, and other characteristics.
We first identified the krill by species and sex (this was my favorite part of the experiment!). I not only loved looking at them under the microscope, but I also loved how it became a collaborative process. We quickly began getting each other’s opinions on whether or not a krill was Euphausia pacifica, Thysanoessa spinifera, male, female, sexless, gravid (carrying eggs), and much more.
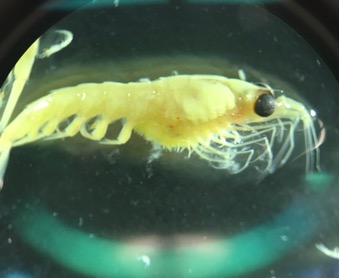
Female Thysanoessa spinifera krill (photo by Abby Tomita).
After identification, we weighed and dried the krill, and finally turned them into small pellets that could fit in an instrument called a bomb calorimeter. These pellets were placed individually into in a “bomb cell” that could then be filled with oxygen and receive a shock from a metal wire. When the machine sent an electric pulse through the wire and combusted the krill pellet, the water surrounding the bomb cell warmed very slightly. The instrument measures this minute temperature change and uses it to calculate the amount of energy in the combusted material. With this information, we were able to quantify how many calories each krill sample contained. Eventually, this data could be used to create a seasonal caloric map of the ocean. Assuming that foraging whales seek out regions with calorically dense prey, such a map could play a crucial role in predicting whale distributions.
Working with Rachel taught me how dynamic the world of research really is. There were many variables that we had to control and factor into our process, such as the possibility of high-calorie lipids being lost if the samples became too warm during the identification process, the risk of a dried krill becoming rehumidified if it sat out in the open air, and even the tiny amount of krill powder inevitably lost in the pelletization process. This made me realize that we cannot control everything! Grappling with these realities taught me to think quickly, adapt, and most importantly, realize that it is okay to refine the process of research as it is being conducted.
Intern Abby (left) pressing the krill powder into a pellet and Hadley (right) prepping the bomb (photo by Rachel Kaplan).
Did you enjoy this blog? Want to learn more about marine life, research, and conservation? Subscribe to our blog and get a weekly message when we post a new blog. Just add your name and email into the subscribe box below.
Marissa Garcia, PhD Student, Cornell University, Department of Natural Resources and the Environment, K. Lisa Yang Center for Conservation Bioacoustics
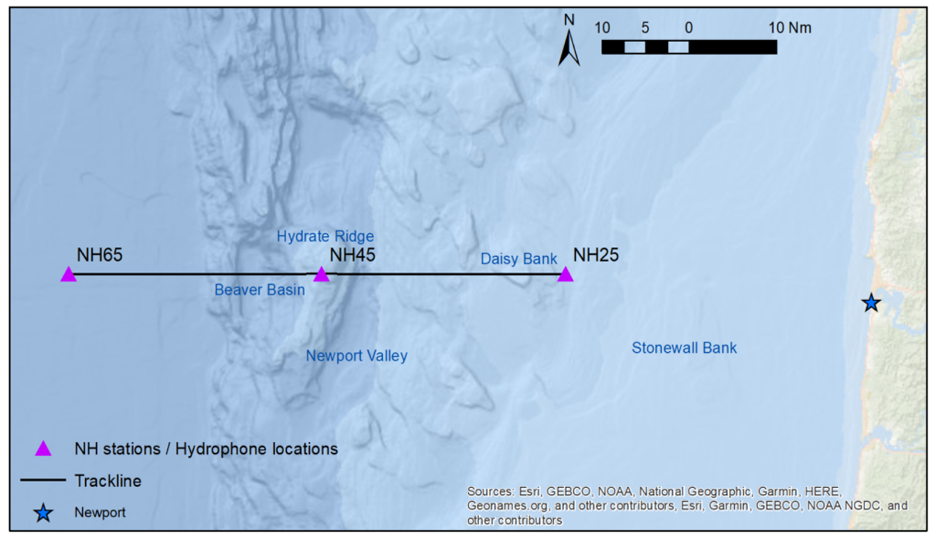
It was a June morning on the Pacific Ocean, and the R/V Pacific Storm had come to a halt on its journey back to shore. The night before, the Holistic Assessment of Living marine resources off Oregon (HALO) project team had disembarked from Newport and began the long transit to NH 65, a site 65 nautical miles offshore along the Newport Hydrographic line (NH line). Ever since the 1960s, researchers have been conducting oceanographic studies along the NH line; the HALO project seeks to add the biological dimension to these historical data collections.
We were on a mission to recover our first set of Rockhoppers that we had deployed in October 2021, just nine months earlier. The Rockhopper is an underwater passive acoustic recording unit developed by K. Lisa Yang Center for Conservation Bioacoustics at Cornell University. Earlier versions of underwater recorders were optimized to record baleen whales. By contrast, the Rockhopper is designed to record both baleen whales and dolphins on longer and deeper deployments, making it apt for research endeavors such as the HALO project. Three units, deployed at NH 25, 45, and 65, continuously recorded the soundscape of the Oregon waters for six months.In June, we were headed out to sea to recover these three units, collect the acoustic data, and deploy three new units.
Figure 1: The HALO project routinely surveys the trackline spanning between NH 25 and NH 65 on the NH line. Credit: Leigh Torres.
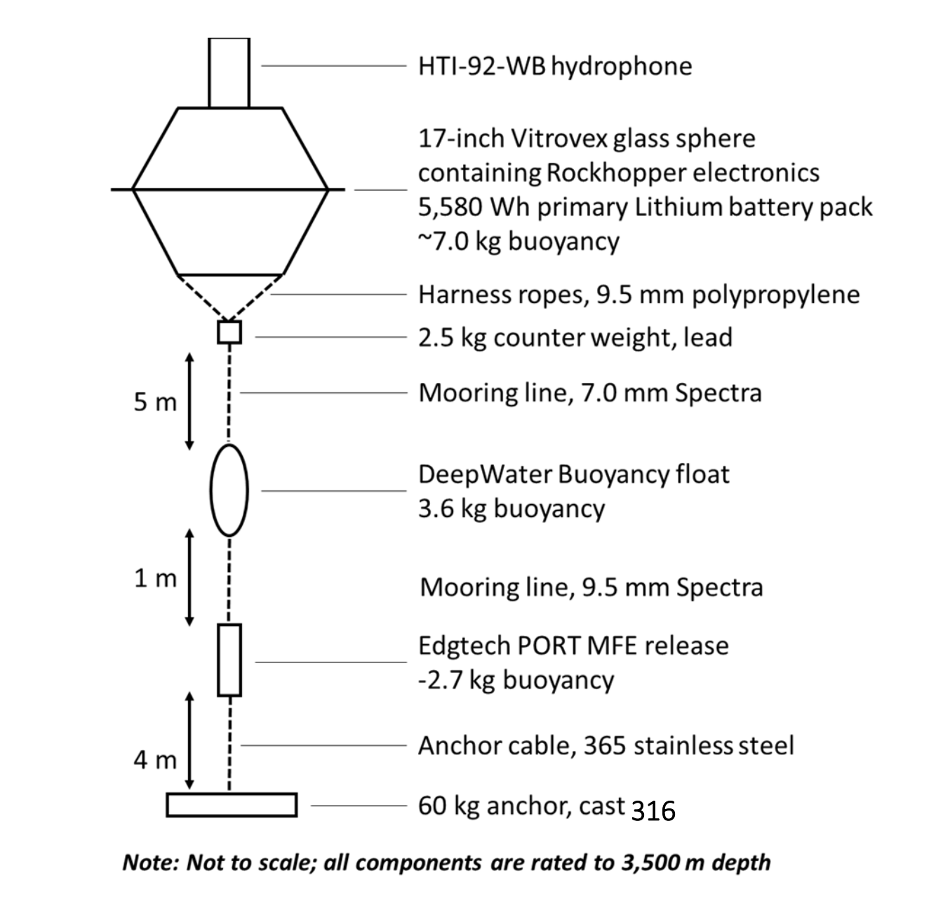
With the ship paused, our first task was to recover the Rockhopper we had deployed at NH 65. This Rockhopper deployment at NH 65 was our deepest successful deployment to date, moored at nearly 3,000 m.
So, how does one recover an underwater recording unit that is nearly 3,000 m below the surface? When the Rockhopper was deployed, it was anchored to the seafloor with a 60 kg cast iron anchor. It seems improbable that an underwater recording unit — anchored by such heavy weights — can eventually rise to the surface, but this capability is made possible through a piece of attached equipment called the acoustic release. By sending a signal of a numbered code from a box on the boat deck through the water column to the Rockhopper, the bottom of the acoustic release will begin to spin and detach from the weights. The weights are then left on the seafloor, as the Rockhopper slowly rises to the surface, now unhindered by the weights. Since these weights are composed of iron, they will naturally erode, without additional pollution contributed to the ecosystem. At NH 65, it took approximately an hour for the Rockhopper to reach the surface.
Figure 2: A diagram of the Rockhopper mooring. Of particular importance to this blog post is the acoustic release (Edgtech PORT MFE release) and the 60 kg anchor (Source: Klinck et al., 2020).
The next challenge is finding the Rockhopper bobbing amongst the waves in the vast ocean — much like searching for a needle in a haystack. The color of the Rockhopper helps aid in this quest. It’s imperative anyone out on the boat deck wears a life jacket; if someone goes overboard while wearing a life-jacket, on-board passengers can more easily spot a bright orange spot in an otherwise blue-green ocean with white caps. The design of the Rockhopper functions similarly; the unit is contained in a bright orange hard hat, helping researchers on-board to more easily spot the device, especially in an ocean often characterized by high sea state.
We also use a Yagi antenna to listen for the VHF (Very High Frequency) signal of the recovery gear, a signal the Rockhopper emits once it’s surfaced above the waterline. Pointing the antenna toward the ocean, we can detect the signal, which will become stronger when we point antenna in the direction of the Rockhopper; once we hear that strong signal, we can recommend to the boat captain to start moving the vessel in that direction.
Figure 3: Derek Jaskula, a member of the field operations team at the K. Lisa Yang Center for Conservation Bioacoustics, points the Yagi antenna to detect the signal from the surfaced Rockhopper. Credit: Marissa Garcia.
At that point, all eyes are on the water, binoculars scanning the horizon for the orange. All ears are eager for the exciting news: “I see the Rockhopper!”
Once that announcement is made, the vessel carefully inches toward the Rockhopper until it is just next to the vessel’s side. Using a hook, the Rockhopper is pulled upward and back onto the deck.
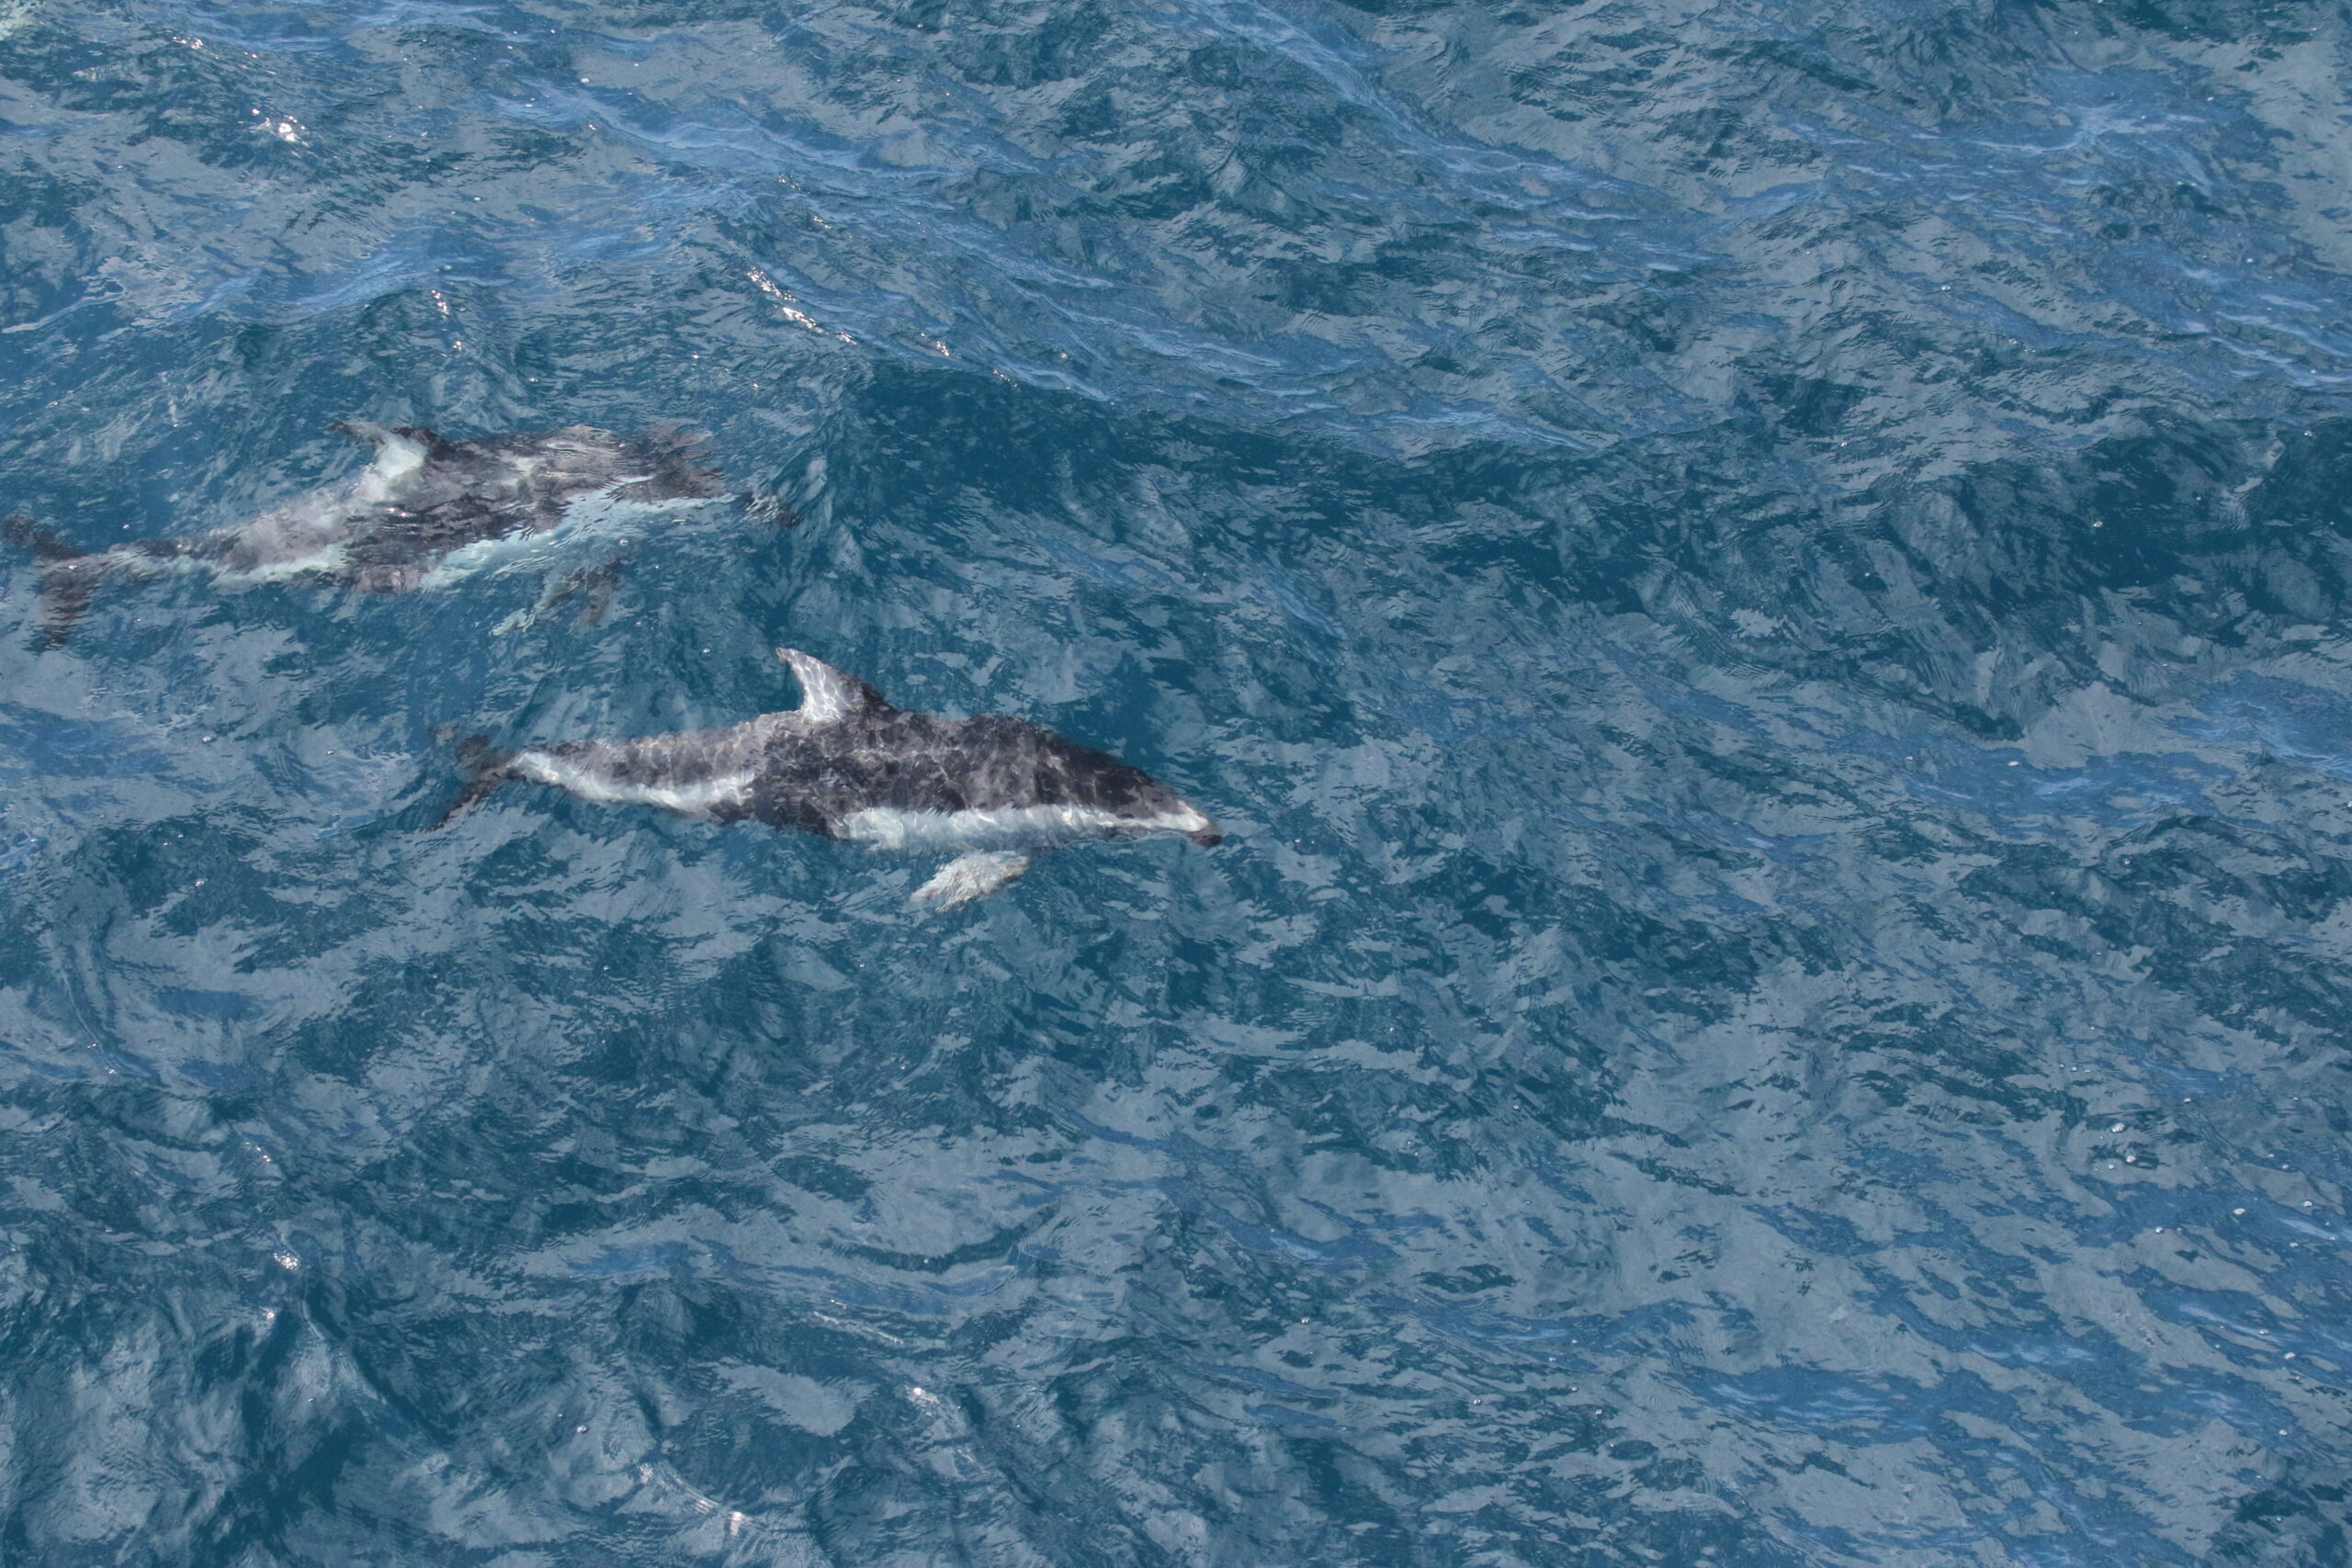
What we weren’t expecting, however, during this recovery was to have our boat surrounded by two dolphin species: Pacific white-sided dolphins (Lagenorhynchus obliquidens) and Northern right whale dolphins (Lissodelphis borealis).
One HALO team member shouted, “I see Northern right whale dolphins!”
Charged with excitement, I quickly climbed up the crow’s nest to get a birds-eye look at the ocean bubbling around us with surfacing dolphins. Surely enough, I spotted the characteristic stripe of the Pacific-white sided dolphins zooming beneath the surface, in streaks of white. But what I was even more eager to see were the Northern right whale dolphins, flipping themselves out of the water, unveiling their bright white undersides. Because they lack dorsal fins, we on-board colloquially refer to Northern right whale dolphins as “sea slugs” to describe their appearance as they surface.
Figure 4: The Northern right whale dolphin (Lissodelphis borealis) surfaces during a HALO cruise. Source: HALO Project Team Member. Permit: NOAA/NMFS permit #21678.
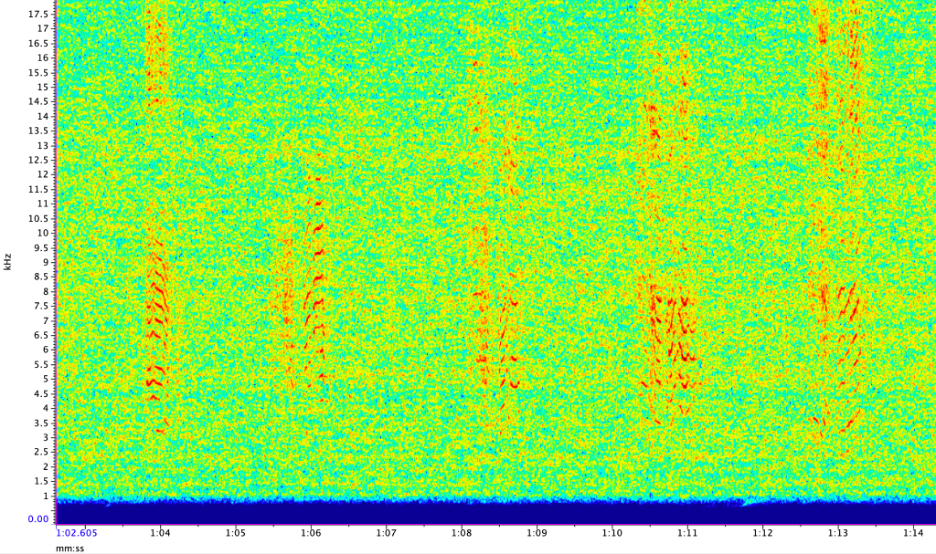
In my analysis of the HALO project data for my PhD, I am interested in using acoustics to describe how the distribution of dolphins and toothed whales in Oregon waters varies across space and time. One species I am especially fascinated to study in-depth is the Northern right whale dolphin. To my knowledge, only three papers to date have attempted to describe their acoustics — two of which were published in the 1970s, and the most recent of which was published fifteen years ago (Fish & Turl, 1976; Leatherwood & Walker, 1979; Rankin et al., 2007).
Leatherwood & Walker (1979) proposed that Northern right whale dolphins produced two categories of whistles: a high frequency whistle that turned into burst-pulse vocalizations, and low frequency whistles. However, Rankin et al. (2007) proposed that Northern right whale dolphins may not actually produce whistles, based on two lines of evidence. First, Rankin et al. (2007) combined visual and acoustic survey, and all vocalizations recorded were localized via beamforming methods to verify that recorded vocalizations were produced by the visually observed dolphins. The visual surveying component is key to validating the vocalizations of the species, which also hints that the HALO project’s multi-surveying approach (acoustic and visual) could help arrive at similar results. Second, the Rankin et al. (2007) explored the taxonomy of the Northern right whale dolphin to verify which vocalizations the species is likely to produce based on the vocal repertoire of its close relatives. The right whale dolphin is closely related to dolphins in the genus Lagenorhynchus — which includes white-sided dolphins — and Cephalorhynchus — which includes Hector’s dolphin. The vocal repertoire of these relatives don’t produce whistles, and instead predominantly produced pulsed sounds or clicks (Dawson, 1991; Herman & Tavolga, 1980). Northern right whale dolphins primarily produce echolocation clicks trains and burst-pulses. Although Rankin et al. (2007) claims that the Northern right whale dolphin does not produce whistles, stereotyped burst-pulse series may be unique to individuals, just as dolphin species use stereotyped signature whistles, or they may be relationally shared just as discrete calls of killer whales are.
Figure 5: The Northern right whale dolphin (Lissodelphis borealis) produces burst-pulses. There exists variation in series of burst-pulses. The units marked by (a) and (b) ultimately get replaced by the unit marked by (c). (Source: Rankin et al., 2007).
We have just finished processing the first round of acoustic data for the HALO project, and it is ready now for analysis. Already previewing an hour of data on the Rockhopper by NH 25, we identified potential Northern right whale dolphin recordings . So far, we have only visually observed Northern right whale dolphins nearby Rockhopper units placed at sites NH 65 and NH 45, so it was surprising to acoustically detect this species on the most inshore unit at NH 25. I look forward to demystifying the mystery of Northern right whale dolphin vocalizations as our research on the HALO project continues!
Figure6: Potential Northern right whale dolphin vocalizations recorded at the Rockhopper deployed at NH 25.
Did you enjoy this blog? Want to learn more about marine life, research and conservation? Subscribe to our blog and get weekly updates and more! Just add your name into the subscribe box below!
Fish, J. F. & Turl, C. W. (1976). Acoustic Source Levels of Four Species of Small Whales.
Herman, L. M., and Tavolga, W. N. (1980). “The communication systems of cetaceans,” in Cetacean behavior: Mechanisms and functions, edited by L. M. Herman (Wiley, New York), 149–209.
Klinck, H., Winiarski, D., Mack, R. C., Tessaglia-Hymes, C. T., Ponirakis, D. W., Dugan, P. J., Jones, C., & Matsumoto, H. (2020). The Rockhopper: a compact and extensible marine autonomous passive acoustic recording system. Global Oceans 2020: Singapore – U.S. Gulf Coast, 1–7. https://doi.org/10.1109/IEEECONF38699.2020.9388970
Leatherwood, S., and Walker, W. A. (1979). “The northern right whale dolphin Lissodelphis borealis Peale in the eastern North Pacific,” in Behavior of marine animals, Vol. 3: Cetaceans, edited by H. E. Winn and B. L. Olla (Plenum, New York), 85–141.
Rankin, S., Oswald, J., Barlow, J., & Lammers, M. (2007). Patterned burst-pulse vocalizations of the northern right whale dolphin, Lissodelphis borealis. The Journal of the Acoustical Society of America, 121(2), 1213–1218. https://doi.org/10.1121/1.2404919
I always have a small crisis before heading into the field, whether for a daytrip or a several-month stint. I’m always dying to go – up until the moment when it is actually time to leave, and I decide I’d rather stay home, keep working on whatever has my current focus, and not break my comfortable little routine.
Preparing to leave on the most recent Northern California Current (NCC) cruise was no different. And just as always, a few days into the cruise, I forgot about the rest of my life and normal routines, and became totally immersed in the world of the ship and the places we went. I learned an exponential amount while away. Being physically in the ecosystem that I’m studying immediately had me asking more, and better, questions to explore at sea and also bring back to land.
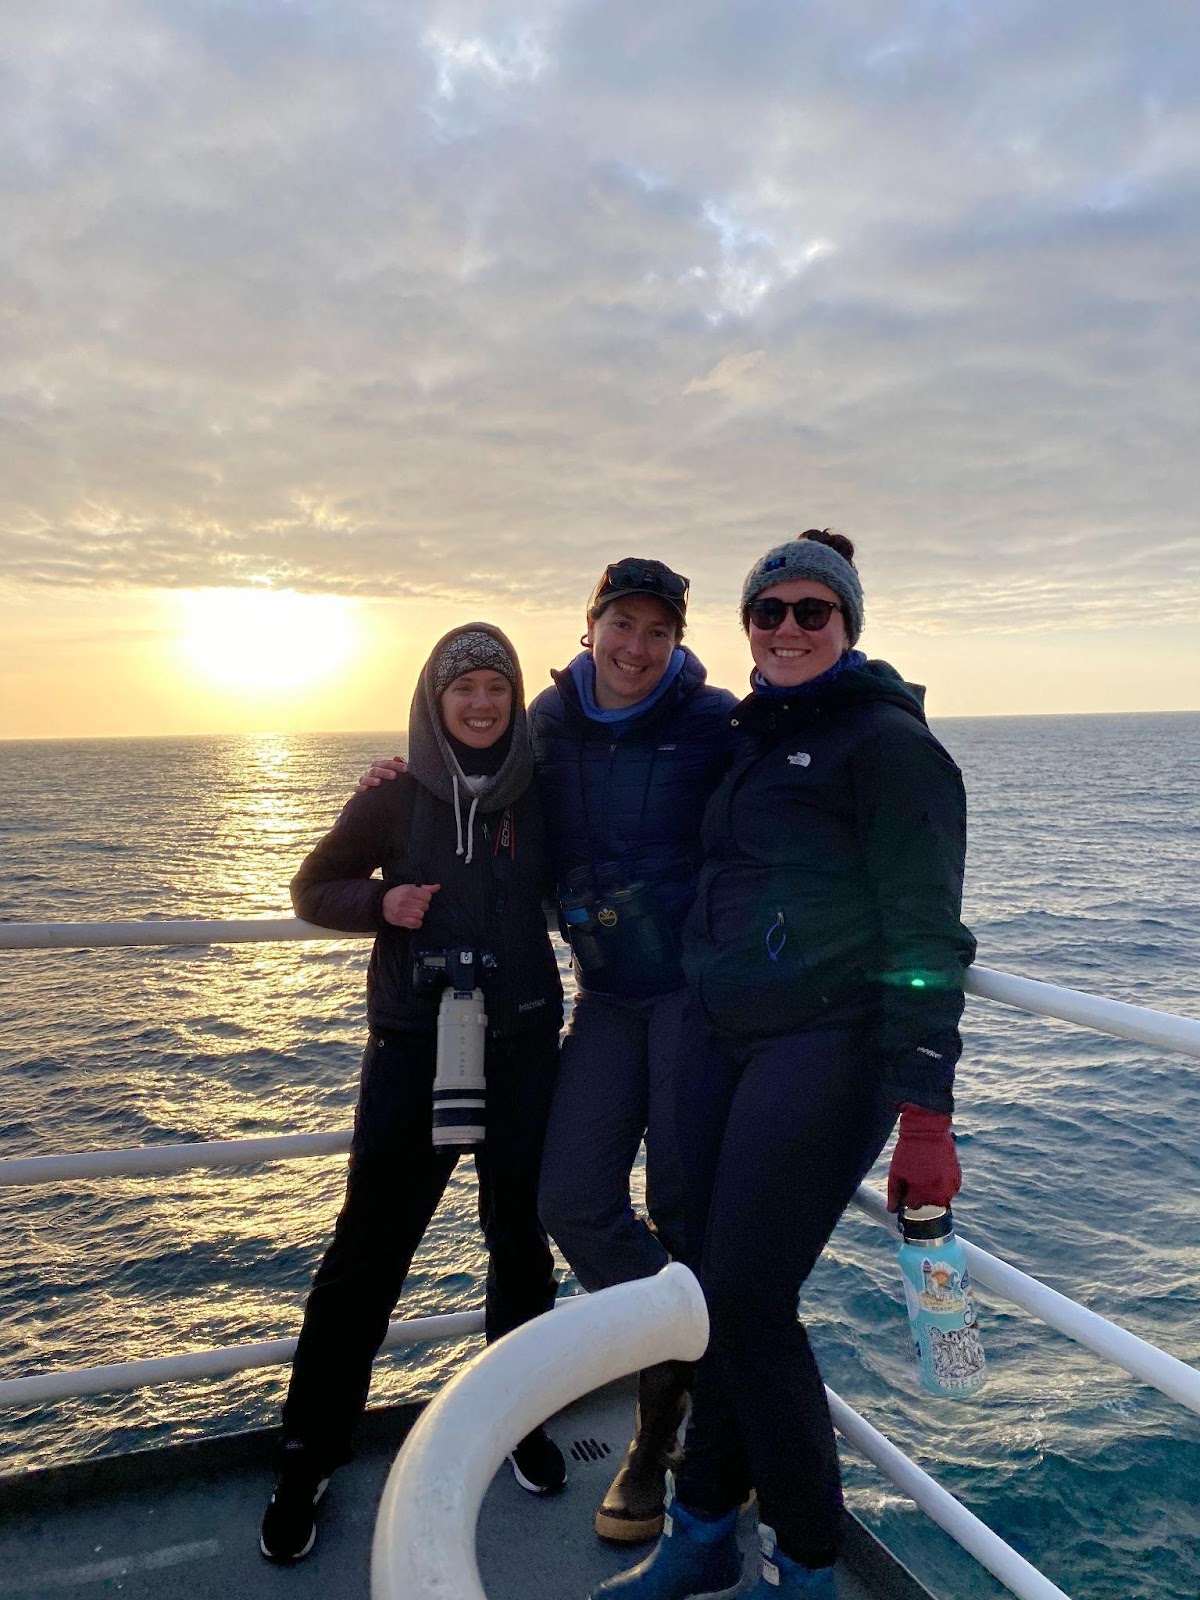
Many of these questions and realizations centered on predator-prey relationships between krill and whales at fine spatial scales. We know that distributions of prey species are a big factor in structuring whale distributions in the ocean, and one of our goals on this cruise was to observe these relationships more closely. The cruise offered an incredible opportunity to experience these relationships in real time: while my labmates Dawn and Clara were up on the flying bridge looking for whales, I was down in the acoustics lab, watching incoming echosounder data in order to identify krill aggregations.
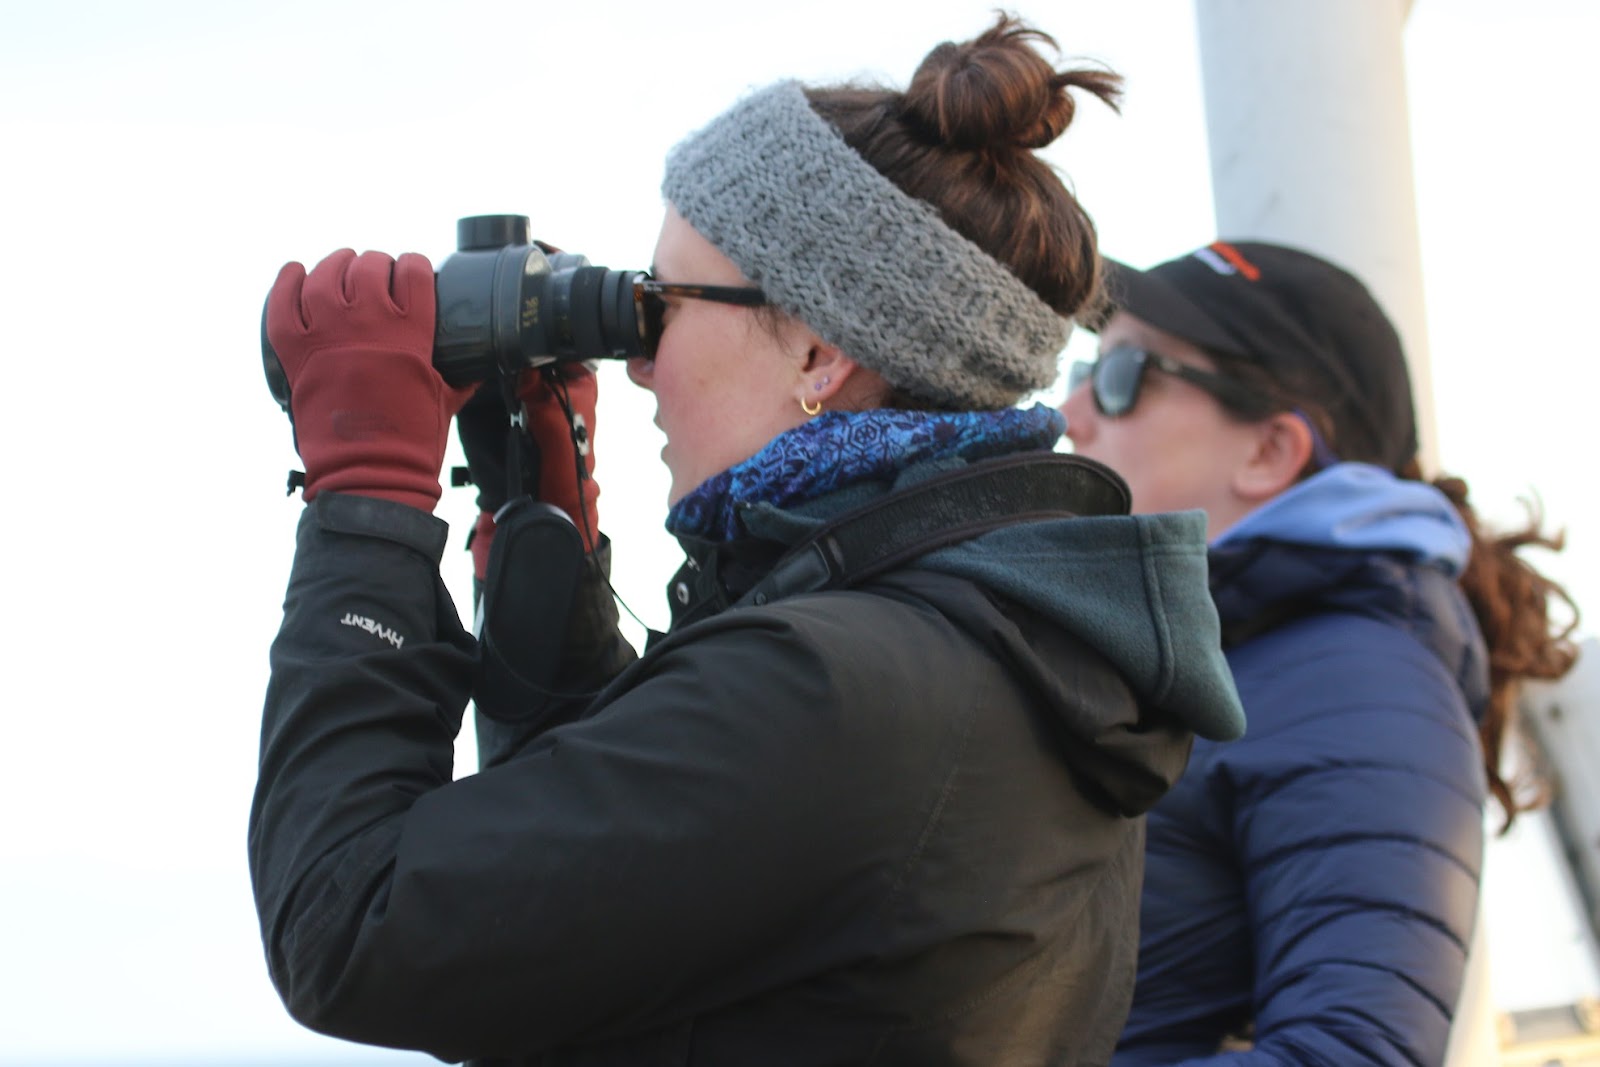
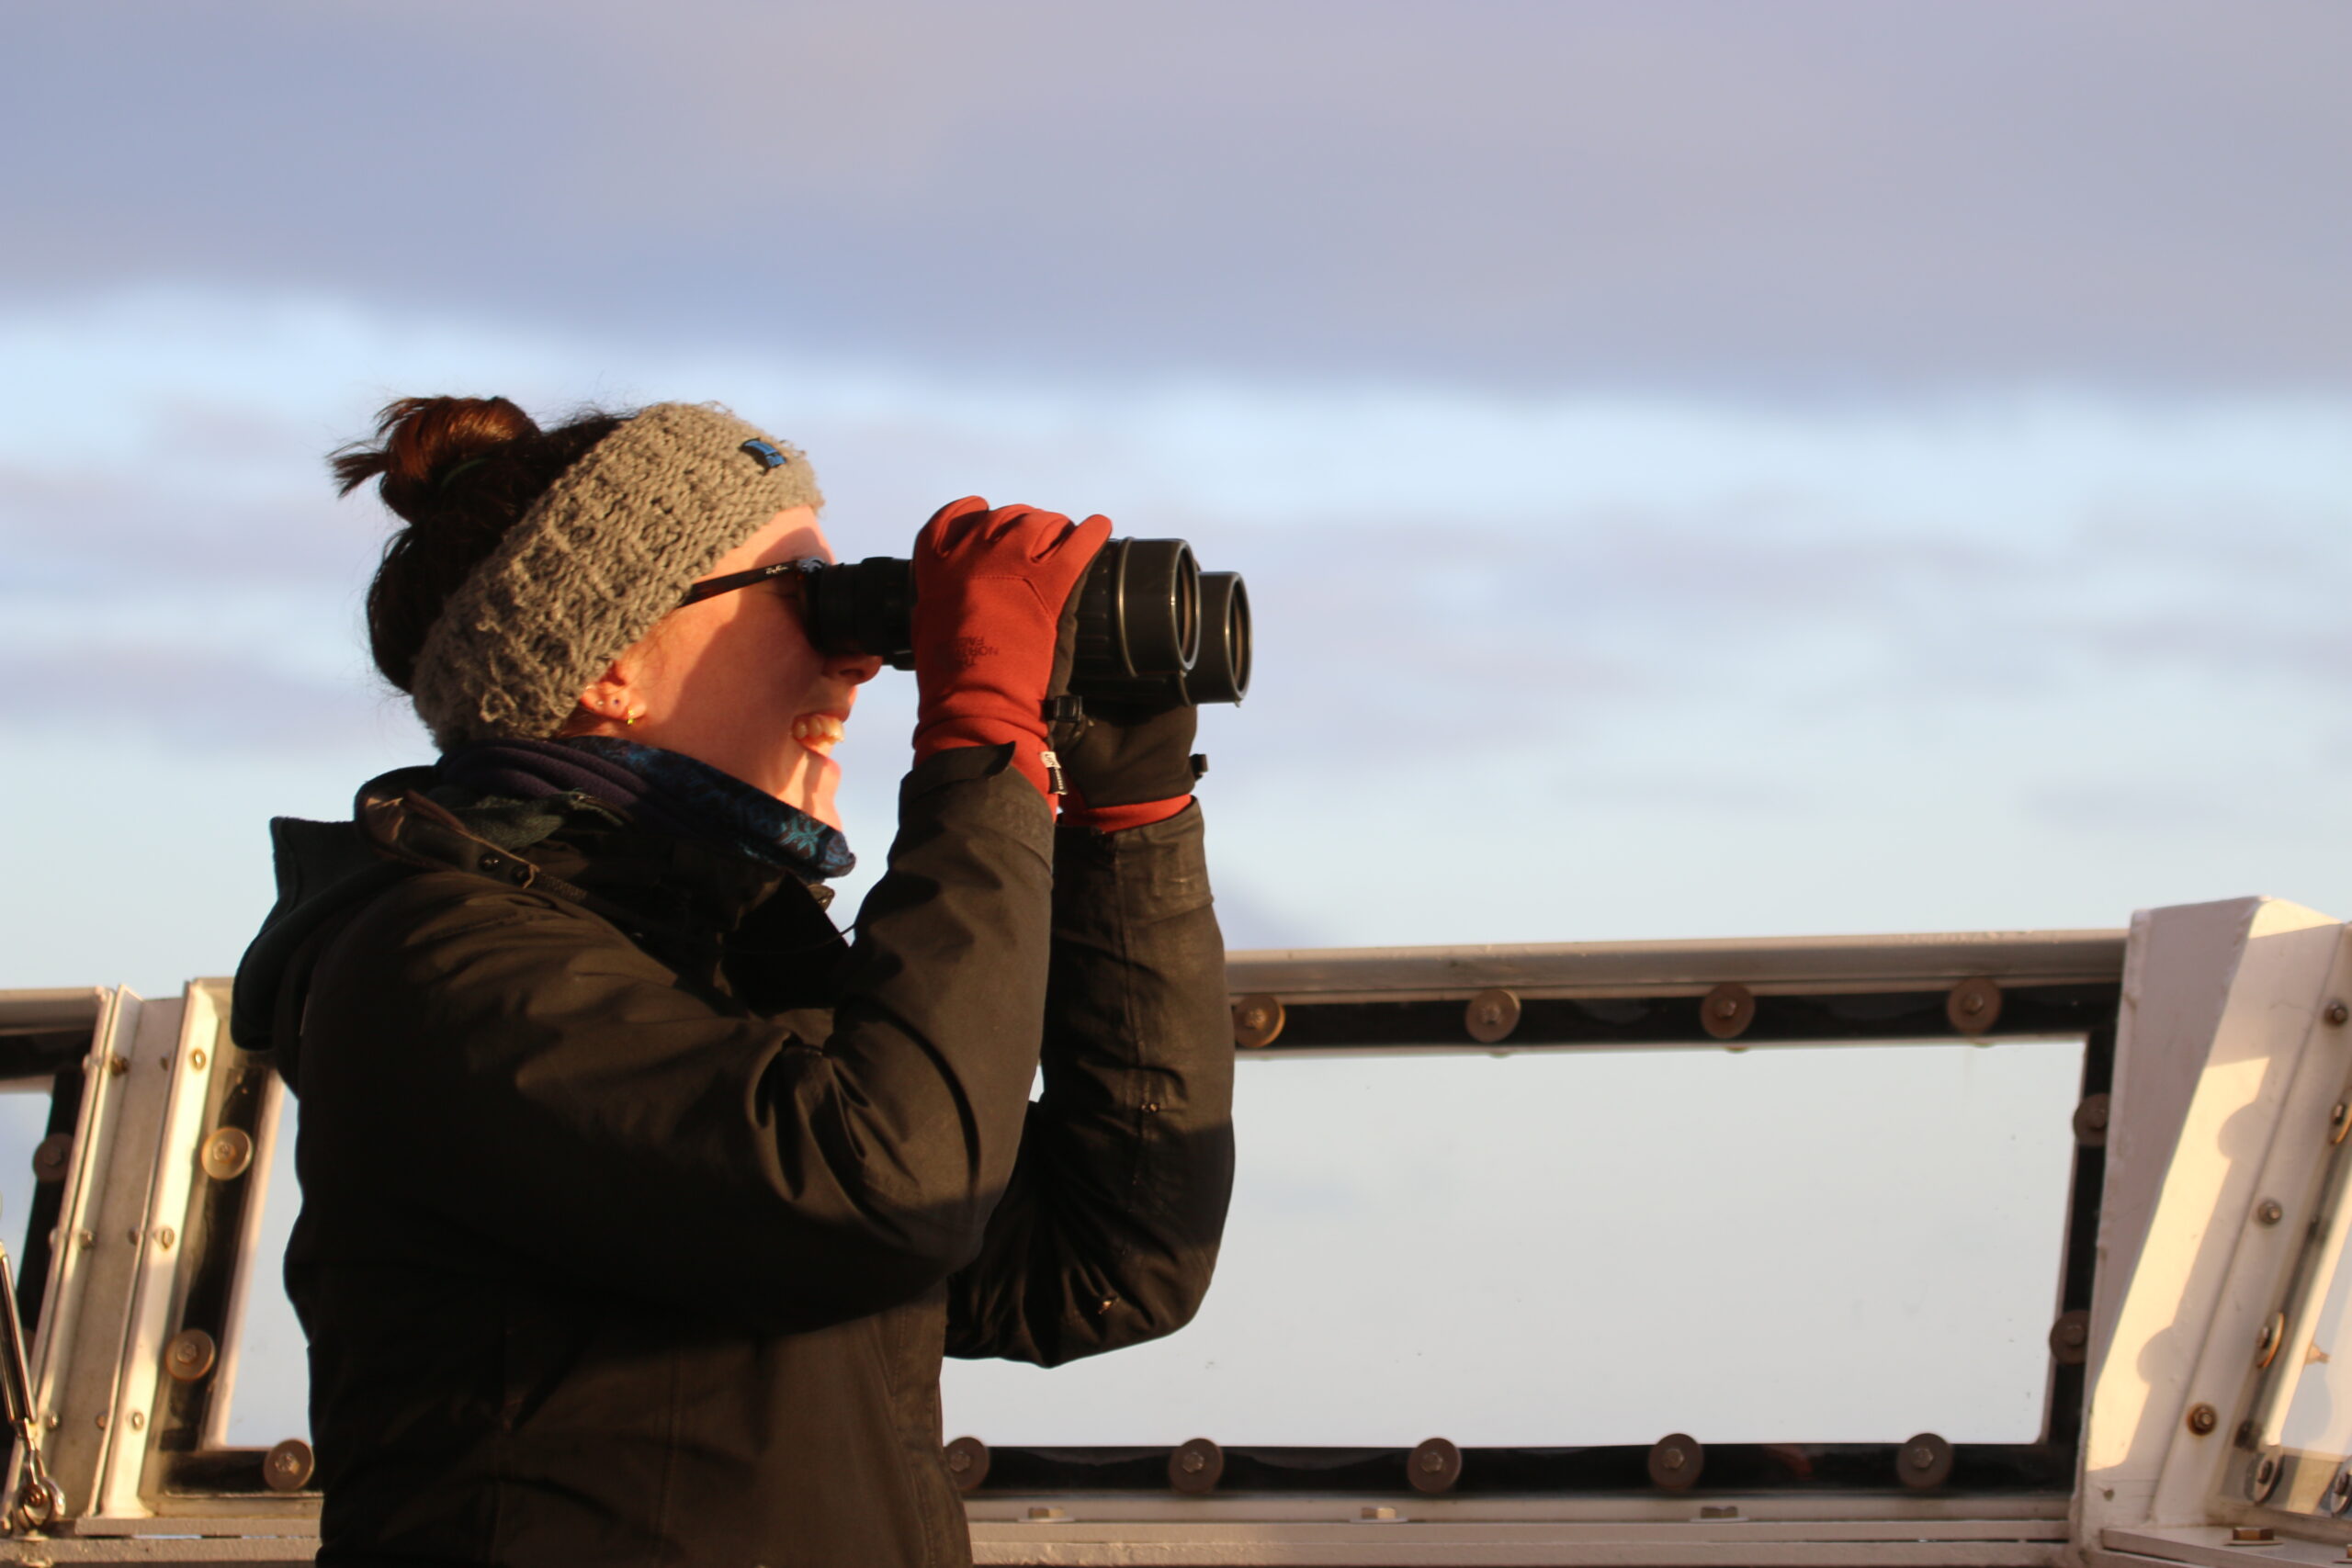
From left, Clara and Dawn survey for marine mammals on the flying bridge.
We used radios to stay in touch with what we were each seeing in real time, and learned quickly that we tended to spot whales and krill almost simultaneously. Experiencing this coherence between predator and prey distributions felt like a physical manifestation of my PhD. It also affirmed my faith in one of our most basic modeling assumptions: that the backscatter signals captured in our active acoustic data are representative of the preyscape that nearby whales are experiencing.
Being at sea with my labmates also catalyzed an incredible synthesis of our different types of knowledge. Because of the way that I think about whale distributions, I usually just focus on whether a certain type of whale is present or not while surveying. But Clara, with her focus on cetacean behavior, thinks in a completely different way from me. She timed the length of dives and commented on the specific behaviors she noticed, bringing a new level of context to our observations. Dawn, who has been joining these cruises for five years now, shared her depth of knowledge built through returning to these places again and again, helping us understand how the system varies through time.
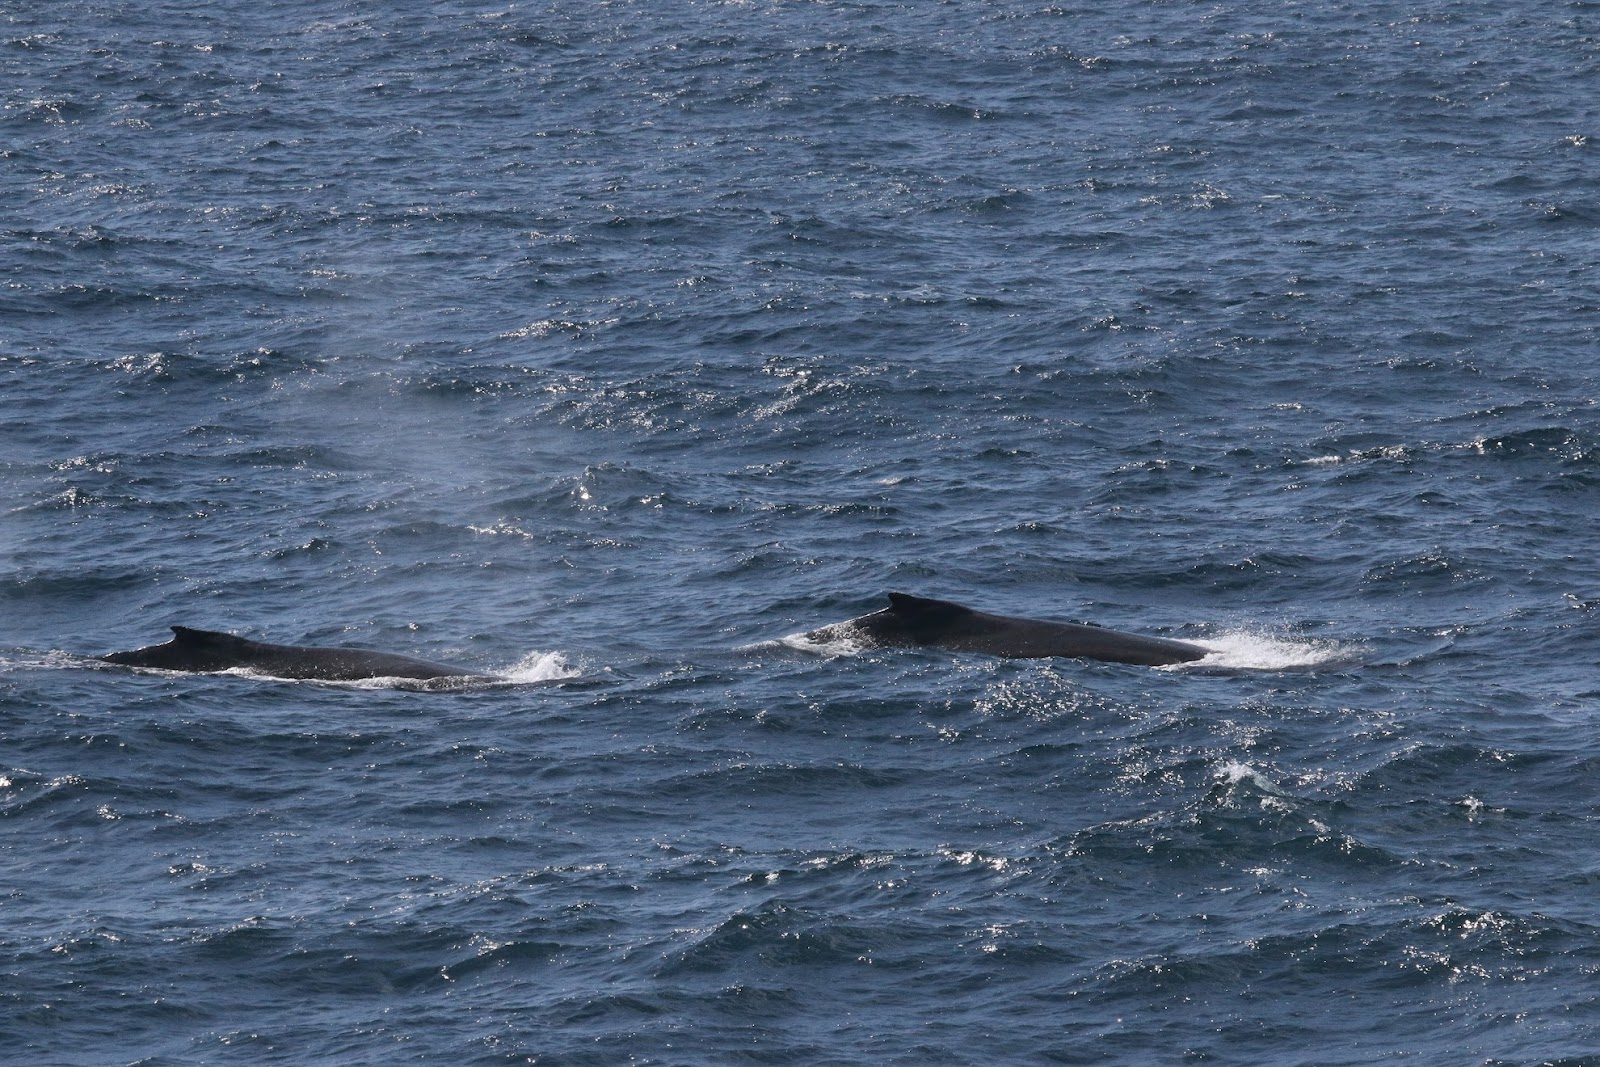
Observing whale behavior, such as for these humpbacks, provides valuable information on how they are using a given area.
One of the best experiences of the cruise for me was when we conducted a targeted net tow in an area of foraging humpbacks on the Heceta Head Line off the central Oregon coast. The combination of the krill signature I was seeing on the acoustics display, and the radio reports from Dawn and Clara of foraging dives, convinced me that this was an opportunity for a net tow, if possible, to see exactly what zooplankton was in the water near the whales. Our chief scientist, Jennifer Fisher, and the ship’s officers worked together to quickly turn the ship around and get a net in the water, in an effort to catch krill from the aggregation I had seen.
This unique opportunity gave me a chance to test my own interpretation of the acoustics data, and compare what we captured in the net with what I expected from the backscatter signal. It also prompted me to think more about the synchrony and differences between what is captured by net tows and echosounder data, two primary ways for looking at whale prey.
Collecting tiny yet precious krill samples associated with foraging humpbacks!
Throughout the entire cruise, the opportunity to build my intuition and notice ecological patterns was invaluable. Ecosystem modeling gives us the opportunity to untangle incredible complexity and put dynamic relationships in mathematical terms, but being out on the ocean provides the chance to develop a feel for these relationships. I’m so glad to bring this new perspective to my next round of models, and excited to continue trying to tease apart fine-scale dynamics between whales and krill.
Did you enjoy this blog? Want to learn more about marine life, research, and conservation? Subscribe to our blog and get a weekly message when we post a new blog. Just add your nameand email into the subscribe box below.
1PhD student, Oregon State University College of Earth, Ocean, and Atmospheric Sciences and Department of Fisheries, Wildlife, and Conservation Sciences, Geospatial Ecology of Marine Megafauna Lab
What do peanut butter m&ms, killer whales, affogatos, tired eyes, and puffins all have in common? They were all major features of the recent Northern California Current (NCC) ecosystem survey cruise.
The science party of the May 2022 Northern California Current ecosystem cruise.
We spent May 6–17 aboard the NOAA vessel Bell M. Shimada in northern California, Oregon, and Washington waters. This fabulously interdisciplinary cruise studies multiple aspects of the NCC ecosystem three times per year, and the GEMM lab has put marine mammal observers aboard since 2018.
This cruise was a bit different than usual for the GEMM lab: we had eyes on both the whales and their prey. While Dawn Barlow and Clara Bird observed from sunrise to sunset to sight and identify whales, Rachel Kaplan collected krill data via an echosounder and samples from net tows in order to learn about the preyscape the whales were experiencing.
From left, Rachel, Dawn, and Clara after enjoying some beautiful sunset sightings.
We sailed out of Richmond, California and went north, sampling as far north as La Push, Washington and up to 200 miles offshore. Despite several days of challenging conditions due to wind, rain, fog, and swell, the team conducted a successful marine mammal survey. When poor weather prevented work, we turned to our favorite hobbies of coding and snacking.
Rachel attends “Clara’s Beanbag Coding Academy”.
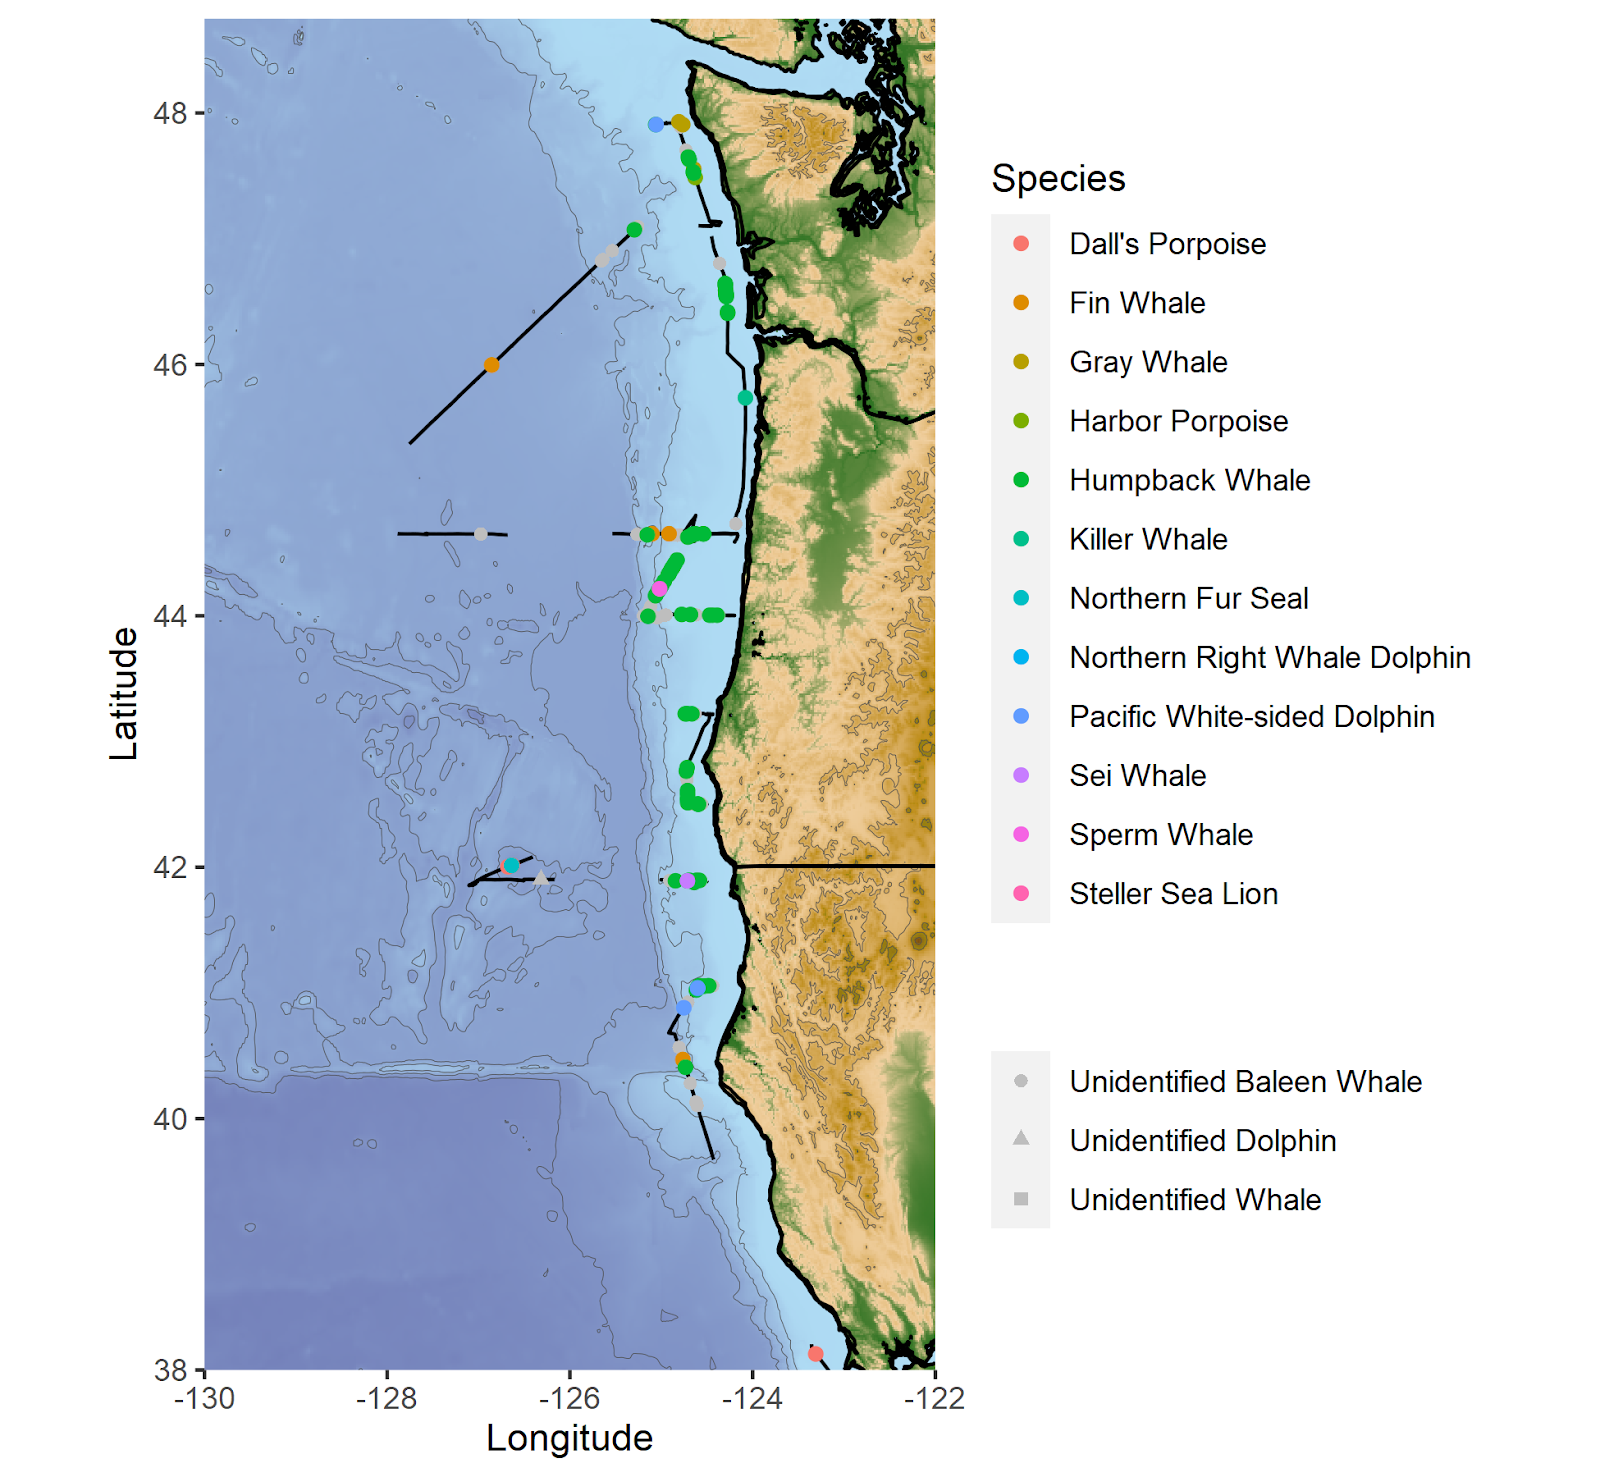
Cruise highlights included several fin whales, sperm whales, killer whales, foraging gray whales, fluke slapping and breaching humpbacks, and a visit by 60 pacific white-sided dolphins. While being stopped at an oceanographic sampling station typically means that we take a break from observing, having more time to watch the whales around us turned out to be quite fortunate on this cruise. We were able to identify two unidentified whales as sei whales after watching them swim near us while paused on station.
Marine mammal observation segments (black lines) and the sighting locations of marine mammal species observed during the cruise.
On one of our first survey days we also observed humpbacks surface lunge feeding close to the ship, which provided a valuable opportunity for our team to think about how to best collect concurrent prey and whale data. The opportunity to hone in on this predator-prey relationship presented itself in a new way when Dawn and Clara observed many apparently foraging humpbacks on the edge of Heceta Bank. At the same time, Rachel started observing concurrent prey aggregations on the echosounder. After a quick conversation with the chief scientist and the officers on the bridge, the ship turned around so that we could conduct a net tow in order to get a closer look at what exactly the whales were eating.
Success! Rachel collects krill samples collected in an area of foraging humpback whales.
This cruise captured an interesting moment in time: southerly winds were surprisingly common for this time of year, and the composition of the phytoplankton and zooplankton communities indicated that the seasonal process of upwelling had not yet been initiated. Upwelling brings deep, cold, nutrient-rich waters to the surface, generating a jolt of productivity that brings the ecosystem from winter into spring. It was fascinating to talk to all the other researchers on the ship about what they were seeing, and learn about the ways in which it was different from what they expected to see in May.
Experiencing these different conditions in the Northern California Current has given us a new perspective on an ecosystem that we’ve been observing and studying for years. We’re looking forward to digging into the data and seeing how it can help us understand this ecosystem more deeply, especially during a period of continued climate change.
The total number of each marine mammal species observed during the cruise.
Did you enjoy this blog? Want to learn more about marine life, research, and conservation? Subscribe to our blog and get a weekly message when we post a new blog. Just add your nameand email into the subscribe box below.
In September 2020, I was hired as a postdoc in the GEMM Lab and was tasked to conduct the analyses necessary for the OPAL project. This research project has the ambitious, yet essential, goal to fill a knowledge gap hindering whale conservation efforts locally: where and when do whales occur off the Oregon coast? Understanding and predicting whale distribution based on changing environmental conditions is a key strategy to assess and reduce spatial conflicts with human activities, specifically the risk of entanglement in fixed fishing gear.
Starting a new project is always a little daunting. Learning about a new region and new species, in an alien research and conservation context, is a challenge. As I have specialized in data science over the last couple of years, I have been confronted many times with the prospect of working with massive datasets collected by others, from which I was asked to tease apart the biases and the ecological patterns. In fact, I have come to love that part of my job: diving down the data rabbit hole and making my way through it by collaborating with others. Craig Hayslip, faculty research assistant in MMI, was the observer who conducted the majority of the 102 helicopter surveys that were used for this study. During the analysis stage, his help was crucial to understand the data that had been collected and get a better grasp of the field work biases that I would later have to account for in my models. Similarly, it took hours of zoom discussions with Dawn Barlow, the GEMM lab’s latest Dr, to be able to clean and process the 75 days of survey effort conducted at sea, aboard the R/V Shimada and Oceanus.
Once the data is “clean”, then comes the time for modeling. Running hundreds of models, with different statistical approaches, different environmental predictors, different parameters etc. etc. That is when you realize what a blessing it is to work with a supervisor like Leigh Torres, head of the GEMM Lab. As an early career researcher, I really appreciate working with people who help me take a step back and see the bigger picture within which the whole data wrangling work is included. It is so important to have someone help you stay focused on your goals and the ecological questions you are trying to answer, as these may easily get pushed back to the background during the data analysis process.
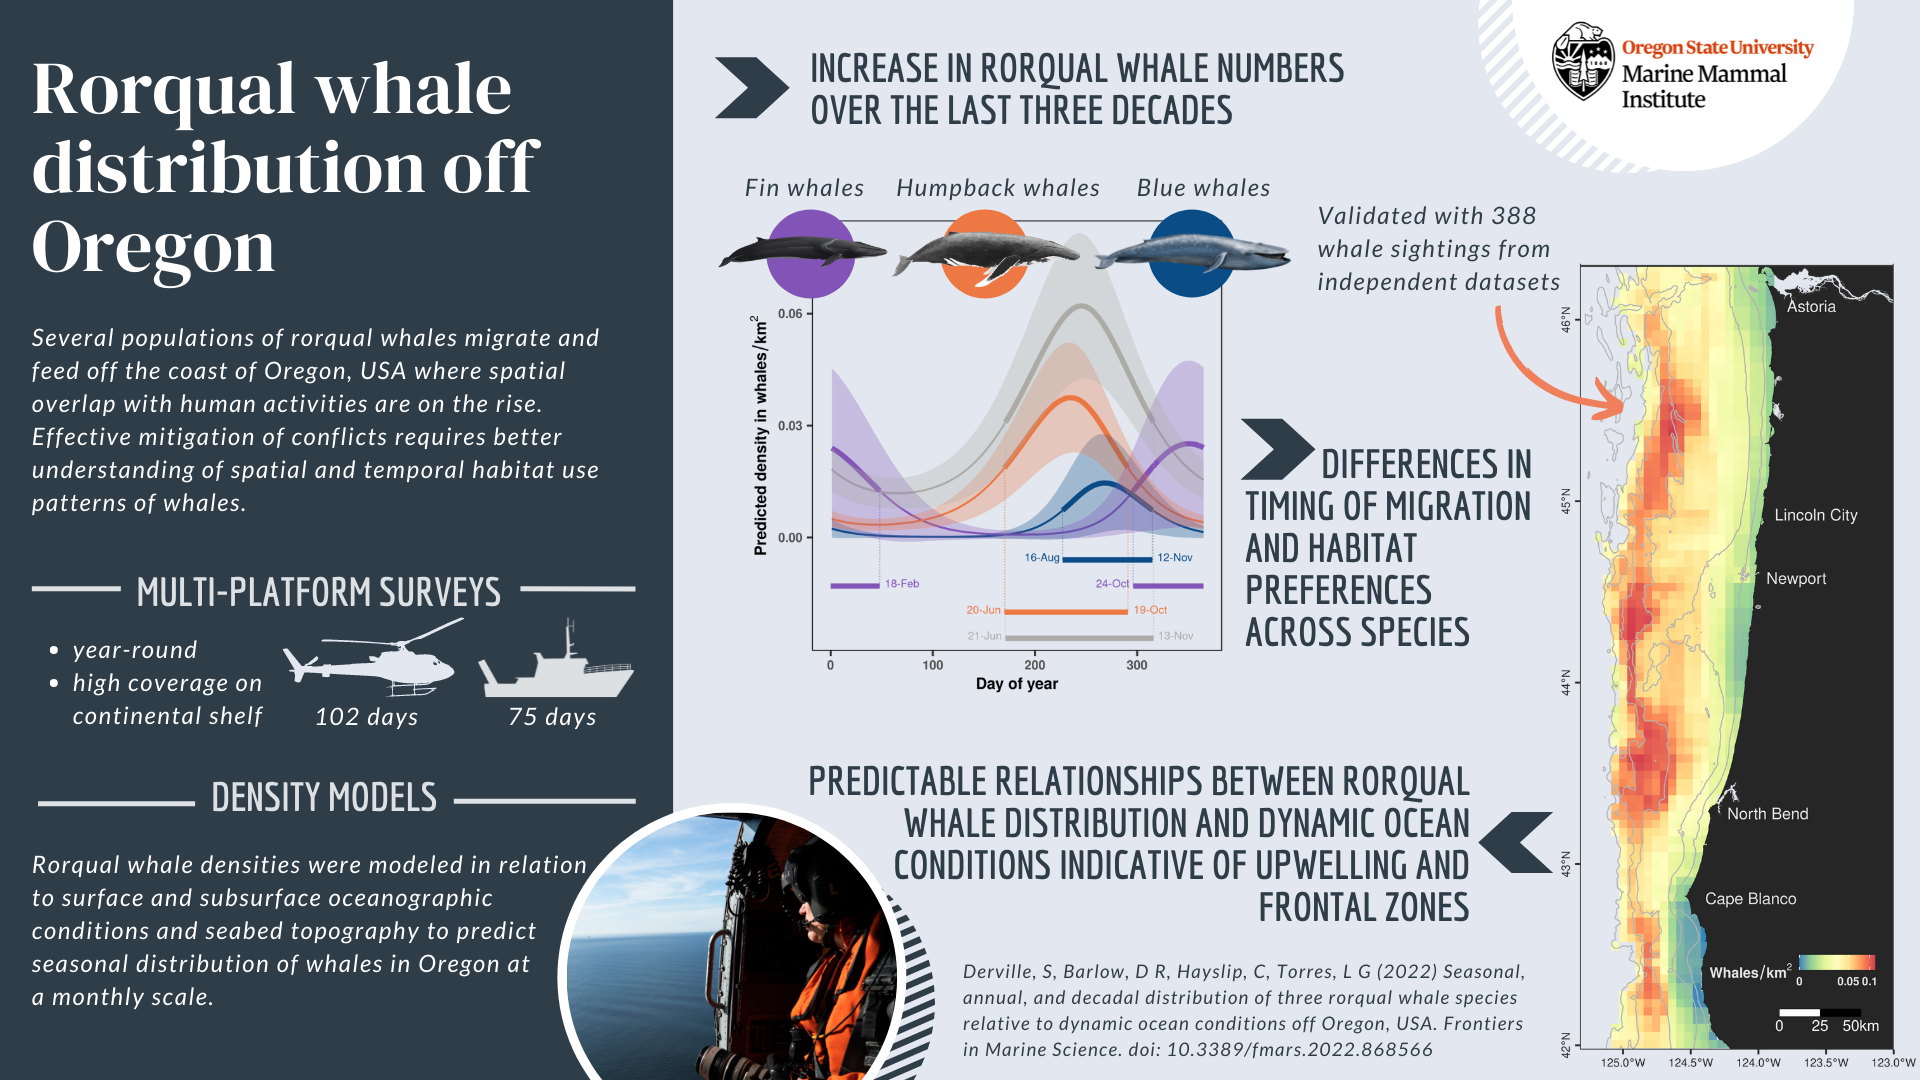
And here we are today, with the first scientific publication from the OPAL project published, a little more than three years after Leigh and Craig started collecting data onboard the United States Coast Guard helicopters off the coast of Oregon in February 2019. Entitled “Seasonal, annual, and decadal distribution of three rorqual whale species relative to dynamic ocean conditions off Oregon, USA”, our study published in Frontiers in Marine Science presents modern and fine-scale predictions of rorqual whale distribution off Oregon, as well as a description of their phenology and a comparison to whale numbers observed across three decades in the region (Figure 1). This research focuses on three rorqual species sharing some ecological and biological traits, as well as similar conservation status: humpback whales (Megaptera novaeangliae), blue whales (Balaenoptera musculus musculus), and fin whales (Balaenoptera physallus); all of which migrate and feed over the US West coast (see a previous blog to learn more about these species here).
Figure 1: Graphical abstract of our latest paper published in Frontiers in Marine Science.
We demonstrate (1) an increase in rorqual numbers over the last three decades in Oregon waters, (2) differences in timing of migration and habitat preferences between humpback, blue, and fin whales, and (3) predictable relationships of rorqual whale distribution based on dynamic ocean conditions indicative of upwellings and frontal zones. Indeed, these ocean conditions are likely to provide suitable biological conditions triggering increased prey abundance. Three seasonal models covering the months of December-March (winter model), April-July (spring) and August-November (summer-fall) were generated to predict rorqual whale densities over the Oregon continental shelf (in waters up to 1,500 m deep). As a result, maps of whale densities can be produced on a weekly basis at a resolution of 5 km, which is a scale that will facilitate targeted management of human activities in Oregon. In addition, species-specific models were also produced over the period of high occurrence in the region; that is humpback and blue whales between April and November, and fin whales between August and March.
As we outline in our concluding remarks, this work is not to be considered an end-point, but rather a stepping stone to improve ecological knowledge and produce operational outputs that can be used effectively by managers and stakeholders to prevent spatial conflict between whales and human activities. As of today, the models of fin and blue whale densities are limited by the small number of observations of these two species over the Oregon continental shelf. Yet, we hope that continued data collection via fruitful research partnerships will allow us to improve the robustness of these species-specific predictions in the future. On the other hand, the rorqual models are considered sufficiently robust to continue into the next phase of the OPAL project that aims to assess overlap between whale distribution and Dungeness crab fishing gear to estimate entanglement risk.
The curse (or perhaps the beauty?) of species distribution modeling is that it never ends. There are always new data to be added, new statistical approaches to be tested, and new predictions to be made. The OPAL models are no exception to this rule. They are meant to be improved in future years, thanks to continued helicopter and ship-based survey efforts, and to the addition of new environmental variables meant to better predict whale habitat selection. For instance, Rachel Kaplan’s PhD research specifically aims at understanding the distribution of whales in relation to krill. Her results will feed into the more general efforts to model and predict whale distribution to inform management in Oregon.
This first publication therefore paves the way for more exciting and impactful research!
Did you enjoy this blog? Want to learn more about marine life, research, and conservation? Subscribe to our blog and get a weekly message when we post a new blog. Just add your name and email into the subscribe box below.
Reference
Derville, S., Barlow, D. R., Hayslip, C. E., and Torres, L. G. (2022). Seasonal, Annual, and Decadal Distribution of Three Rorqual Whale Species Relative to Dynamic Ocean Conditions Off Oregon, USA. Front. Mar. Sci. 9, 1–19. doi:10.3389/fmars.2022.868566.
Acknowledgments
We gratefully acknowledge the immense contribution of the United State Coast Guard sectors North Bend and Columbia River who facilitated and piloted our helicopter surveys. We would like to also thank NOAA Northwest Fisheries Science Center for the ship time aboard the R/V Bell M. Shimada. We thank the R/V Bell M. Shimada (chief scientists J. Fisher and S. Zeman) and R/V Oceanus crews, as well as the marine mammal observers F. Sullivan, C. Bird and R. Kaplan. We give special recognition and thanks to the late Alexa Kownacki who contributed so much in the field and to our lives. We also thank T. Buell and K. Corbett (ODFW) for their partnership over the OPAL project. We thank G. Green and J. Brueggeman (Minerals Management Service), J. Adams (US Geological Survey), J. Jahncke (Point blue Conservation), S. Benson (NOAA-South West Fisheries Science Center), and L. Ballance (Oregon State University) for sharing validation data. We thank J. Calambokidis (Cascadia Research Collective) for sharing validation data and for logistical support of the project. We thank A. Virgili for sharing advice and custom codes to produce detection functions.
This year in late February is the 2022 Ocean Sciences Meeting, an interdisciplinary bonanza of ocean scientists from all over the world. The conference will be held online this year as a precaution against Covid-19, and a week of virtual talks and poster sessions will cover new research in diverse topics from microbial ecology to ocean technology to whale vocalizations.
The meeting will also include my first poster presentation at a major conference, and so I have the typical grad student jitters that accompany each new thing I do (read more about the common experience of “imposter syndrome” here). This poster is the first time since starting graduate school and joining Project OPAL that I’m trying to craft a full science story that connects whales, their prey, and oceanographic conditions.
Learning how to do the analyses to assess and quantify these connections has involved plenty of head-scratching and periodic frustration on my part, but it has also offered a surprisingly joyful and even moving experience. In my efforts to troubleshoot a problem with my prey analysis, I’ve reached out to nearly everyone who works with krill acoustic data on the West Coast. Every single person has been incredibly welcoming and ready to help me, and excited to learn about my work in return. This experience has made me realize how many people I have on my team, and that even strangers are willing to support me on the whacky journey that is a PhD.
Through these collaborations, I am learning to analyze the acoustic signal of krill, small animals that are important food for whales foraging off the coast of Oregon and beyond. As part of Project OPAL, we plan to compare krill swarms with whale survey data to learn about the types of aggregations that whales are drawn to. From the perspective of a hungry whale, not all krill are created equal.
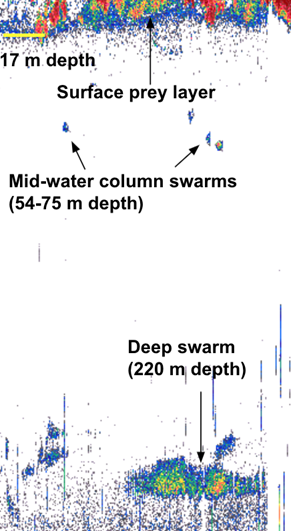
Analysis of a layer of krill in the upper ocean. The blue color in the top panel indicates scattering of acoustic signal by the krill, and the outline in the bottom panel shows the results of an algorithm programmed to detect krill aggregations.
In addition to developing great remote relationships through this work, the ability to meet in person as we continue adapting to life during the pandemic has absolutely not lost its thrill. After over a year of meetings and collaborating on Zoom, I was delighted to meet GEMM Lab postdoc Solène Derville this January, after she journeyed from her home in New Caledonia to Oregon. It was so exciting to see her in real life (we’re more similar in height than I knew!) and a few minutes into our first lunch together she was already helping me refine my analysis plans and think of new approaches.
Our interaction also made me think about how impressive the GEMM Lab is. The first two people Solène saw upon her arrival in Oregon were me and fellow GEMM Lab student Allison Dawn, two newer members who joined the lab after her last trip to Oregon. Without a moment of hesitation, Allison stepped up to give Solène a ride to Newport from Corvallis to finish her long journey. The connection our lab has developed and maintained during a pandemic, across borders and time zones, is special.
Hiking on gorgeous days is just one of the many benefits of being in the same place! This adventure included spotting a whale blow off the coast and a lot of GEMM excitement.
As I look out at the next few weeks until the Ocean Sciences meeting, and out towards the rest of my PhD, I inevitably feel worried about all I need to accomplish. But, I know that the dynamics in our lab and the other collaborative relationships I’m forming are what will carry me through. Every meeting and new connection reminds me that I’m not doing this alone. I’m grateful that there’s a team of people who are ready and willing to help me muddle my way through my first Principal Components Analysis, puzzle over algorithm errors, and celebrate with me as we make progress.
Part of what makes being a graduate student so exciting is the way that learning can flip the world around: you learn a new framework or method, and suddenly everything looks a little different. I am experiencing this fabulous phenomenon lately as I learn to collect and process active acoustic data, which can reveal the distribution and biomass of animals in the ocean – including those favored by foraging whales off of Oregon, like the tiny shrimp-like krill.
We know that whales seek out the dense, energy-rich swarms that krill form, and that knowing where to expect krill can give us a leg up in anticipating whale distributions. Project OPAL (Overlap Predictions About Large whales) seeks to model and provide robust predictions of whale distributions off the coast of Oregon, so that managers can make spatially discrete decisions about potential fishery closures, minimizing burdens to fishermen while also maximizing protection of whales. We hope that including prey in our ecosystem models will help this effort, and working on this aim is one of the big tasks of my PhD.
So, how do we know where to expect krill to be off the coast of Oregon? Acoustic tools give us the opportunity to flip the world upside down: we use a tool called an echosounder to eavesdrop on the ocean, yielding visual outputs like the ones below that let us “see” and interpret sound.
Echograms like these reveal features in the ocean that scatter “pings” of sound, and interpreting these signals can show life in the water column.
This is how it works. The echosounder emits pulses of sound at a known frequency, and then it listens for their return after it bounces of the sea floor or things in the water column. Based on sound experiments in the laboratory, we know to expect our krill species, Euphausia pacifica and Thysanoessa spinifera, to return those echoes at a characteristic decibel level. By constantly “pinging” the water column with this sound, we can record a continuous soundscape along the cruise track of a vessel, and analyze it to identify the animals and features recorded.
I had the opportunity to use an echosounder for the first time recently, on the first HALO cruise. We deployed the echosounder soon after sunrise, 65 miles offshore from Newport. After a little fiddling and troubleshooting, I was thrilled to start “listening” to the water; I was able to see the frothy noise at its surface, the contours of the seafloor, and the pixelated patches that indicate prey in between. Although it’s difficult to definitively identify animals only based on the raw output, we saw swarms that looked like our beloved krill, and other aggregations that suggested hake. Sometimes, at the same time that the team of visual observers on the flying bridge of the vessel sighted whales, I also saw potential prey on the echogram.
I spent much of the HALO cruise monitoring incoming data from the transducer on the SIMRAD EK60. Photo: Marissa Garcia.
I’m excited to keep collecting these data, and grateful that I can also access acoustic data collected by others. Many research vessels use echosounders while they are underway, including the NOAA Ship Bell M. Shimada, which conducts cruises in the Northern California Current several times a year. Starting in 2018, GEMM Lab members have joined these cruises to conduct marine mammal surveys.
This awesome pairing of data types means that we can analyze the prey that was available at the time of marine mammal sightings. I’ve been starting to process acoustic data from past Northern California Current cruises, eavesdropping on the preyscape in places that were jam-packed with whales, such as this echogram from the September 2020 cruise, below.
An echogram from the September 2020 NCC cruise shows a great deal of prey at different depths.
Like a lot of science, listening to animals in the sea comes down to occasional bursts of fieldwork followed by a lot of clicking on a computer screen during data analysis. This analysis can be some pretty fun clicking, though – it’s amazing to watch the echogram unfurl, revealing the preyscape in a swath of ocean. I’m excited to keep clicking, and learn what it can tell us about whale distributions off of Oregon.
By Rachel Kaplan, PhD student, Oregon State University College of Earth, Ocean, and Atmospheric Sciences and Department of Fisheries and Wildlife, Geospatial Ecology of Marine Megafauna Lab
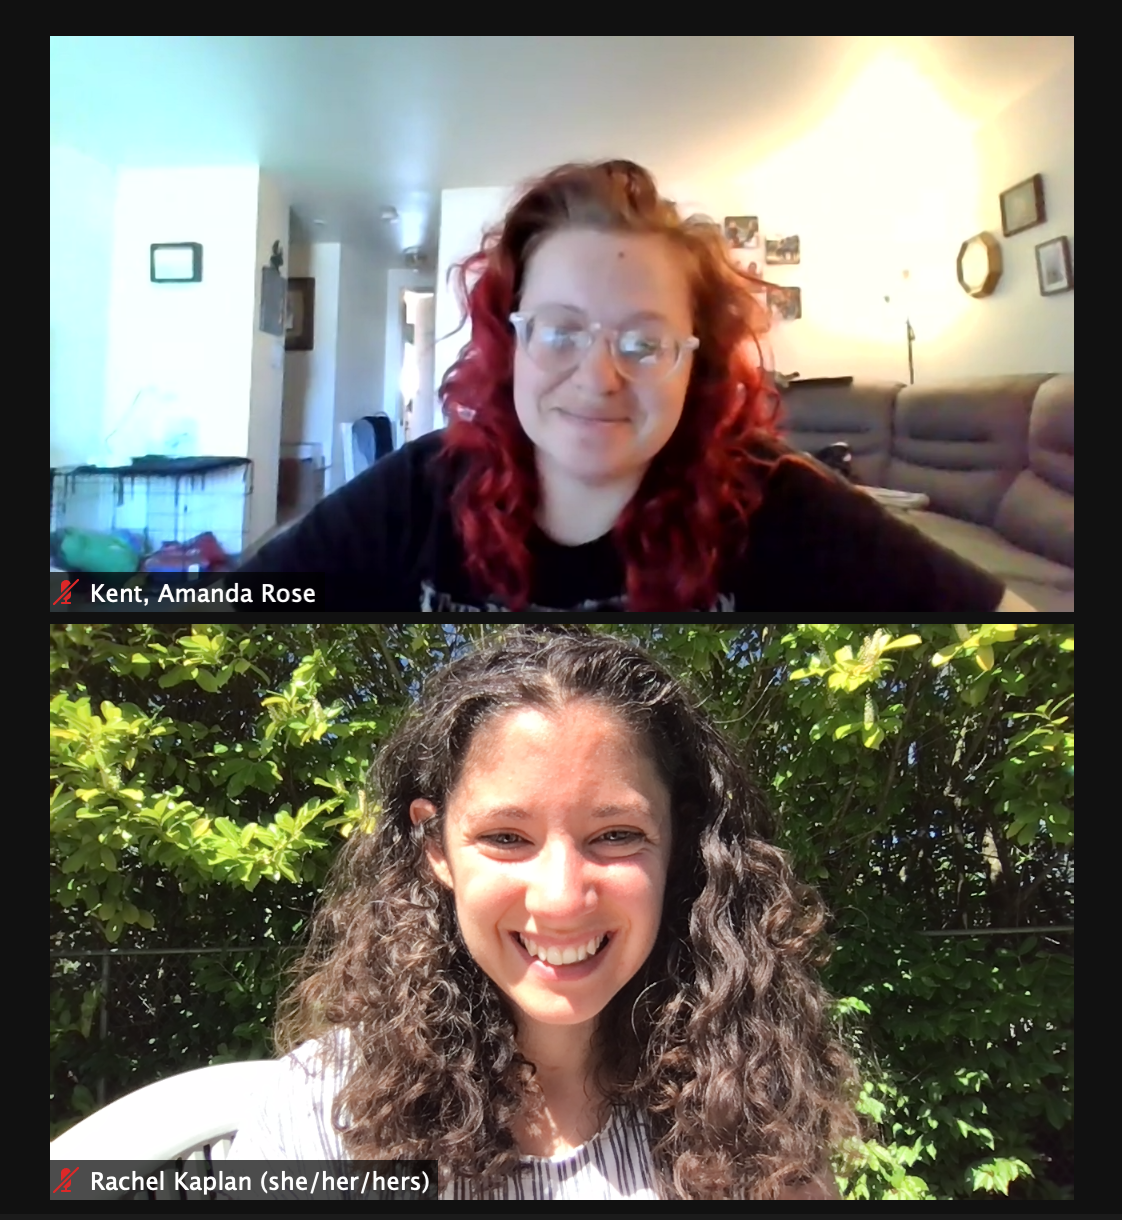
What are the most unexpected things you’ve done on Zoom in the last year? Since the pandemic dramatically changed all our lives in 2020, I think we’ve all been surprised by the diversity of things we’ve done remotely. I’ve baked bagels with a friend in Finland, done oceanography labs from my kitchen, had dance parties with people across the country, and conducted an award ceremony for my family’s Thanksgiving scavenger hunt – all on Zoom. Over the last several months, I’ve also mentored an Undergraduate Research, Scholarship, & the Arts (URSA) Engage student, named Amanda. Although we haven’t met in person yet, we’ve been connecting over Zoom since October.
Amanda is an Ocean Sciences student working with me and Dr. Kim Bernard (CEOAS) to conduct a literature review about the two species of krill found off the coast of Oregon. Thysanoessa spinifera and Euphausia pacifica are an important food source for many of the animals that live off our coast — including blue, humpback, and fin whales. I am trying to learn how krill distributions shape those of humpback and blue whales as part of project OPAL, as well as which oceanographic factors drive krill abundances and distributions.
We’re also interested in T. spinifera and E. pacifica for the crucial roles they serve in ecosystems, beyond providing dinner for whales. Krill do many things that are beneficial to ecosystems and people, termed “ecosystem services.” These include facilitating carbon drawdown from the surface ocean to the deep, supporting lucrative fisheries species like salmon, flatfish, and rockfish, and feeding seabirds like auklets and shearwaters. We want to understand more fully the niche that T. spinifera and E. pacifica each fill off the coast of Oregon, which will help us anticipate how these important animals can be impacted by forces such as global climate change and marine management efforts.
Trying to understand the ecosystem services fulfilled by krill is inherently interdisciplinary, which means we have to learn a lot of new things, making this project a lot of fun. The questions Amanda and I have pursued together have ranged from intensely specific, to surprisingly broad. How many calories do blue whales need to eat in a day? How many krill do salmon need to eat? How big are krill fecal pellets, and how fast do they sink?
Trying to answer these questions has basically amounted to a heroic scouring of the internet’s krillscape by Amanda. She has hunted down papers dating back to the 1960s, pulled together findings from every corner of the world, and pursued what she refers to as “treasure troves” of data. In the process, she has also revealed the holes that exist in the literature, and given us new questions. This is the basis of the scientific process: understanding the current state of knowledge, identifying gaps in that knowledge, and developing the questions and methods needed to fill those gaps.
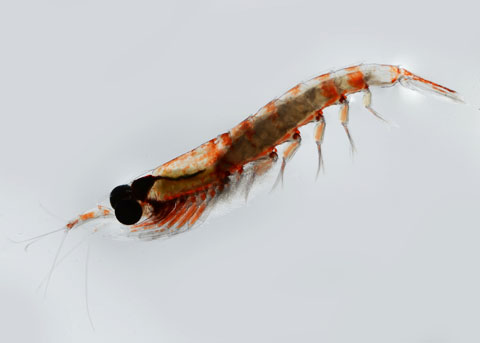
Euphausia pacifica (source: University of Irvine California, Peter J. Bryant).
Filling in knowledge gaps about T. spinifera and E. pacifica can help us better understand these animals, the ecosystems where they live, and the whales and other animals that depend on them for prey. It’s exciting to know that we will have the opportunity to help fill some of these gaps, as both Amanda and I continue this research over the course of our degrees.
Being able to engage in remote research and mentorship has been really rewarding, and it has shown me how far we’ve all come over the last year. Learning how to work together remotely has been crucial as we have adjusted to the funny new normal of the pandemic. As much as I miss working with people in person, I’ve learned that there’s a lot of great connection to be found even in remote collaboration – I’ve loved meeting Amanda’s pets on Zoom, learning about her career goals, and seeing her incredibly artistic representations of the carbon cycle held up to the camera.
Even though most of our conversations take place on Zoom from our homes, this research still feels plugged into a bigger community. Amanda and I also join Kim’s bigger Zooplankton Ecology Lab meetings, which include two other graduate students and eight undergraduate students, all of whom are working on zooplankton ecology questions that span from the Arctic to the Antarctic. Even though we’ve never met in person, a supportive and curious community has developed among all of us, which I know will persist when we can move back to in-person research and mentorship.