Five mind-blowing facts about sperm whales

By Solène Derville, Postdoctoral Scholar, OSU Department of Fisheries and Wildlife, Geospatial Ecology of Marine Megafauna Lab

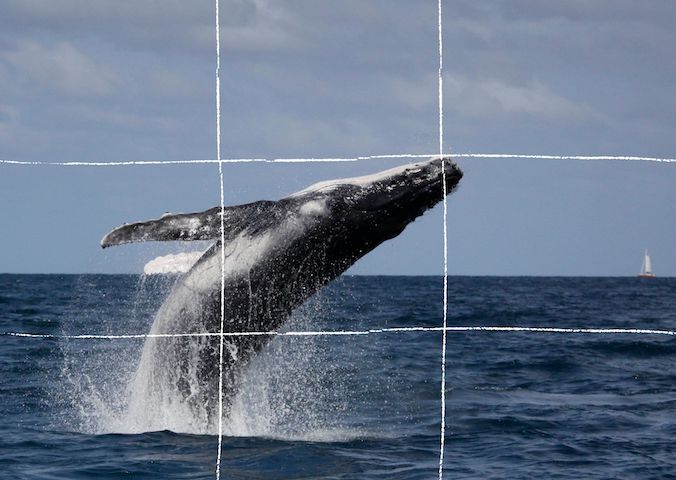
Having worked almost exclusively on humpback whales for the past 5 years, I recently realized how specialized I have become when I was asked to participate in an expedition targeting another legendary cetacean, which I discovered I knew so little about: the sperm whale. On November 18th I boarded a catamaran with a team of 8 other seamen, film makers and scientists, all ready to sail off the west coast of New Caledonia in the search of this elusive animal. The expedition was named “Code CODA” in reference to the unique patterned series of clicks produced by sperm whales.

As I prepared for the expedition, I did my scientific literature homework and felt a growing awe for sperm whales. At every step of my research, whether I investigated their morphology, physiology, social behavior, feeding habits… everything about them appeared to be exceptional. Below is a list summarizing five mind-blowing facts everyone should know about sperm whales.

A sperm whale sketch I made on the boat in preparation for this blog post (Illustration credit: Solène Derville)

Sea giants

 Sperm whales are the largest of the odontocetes species, which is the group of “toothed whales” that also includes dolphins, porpoises and beaked whales. They show a strong sexual dimorphism, unusual for a cetacean, as adult males can be about twice as big as adult females. Indeed, male sperm whales can reach up to 18 m and 56 tons (approximately the weight of 9 elephants!). Their massive block-shaped head is perhaps their most distinctive feature. It contains the largest brain in the animal kingdom and as a comparison, it is claimed that an entire car could fit in it! By its morphology alone, the sperm whale hence appears like an all-round champion of cetaceans.

Abyssal divers

 Sperm whales are some of the best divers among air-breathing sea creatures. They have been recorded down to 2,250 m, and sperm whale carcasses have been found entangled in deep-sea cables suggesting that they can dive even deeper. In these dark and cold waters, sperm whales hunt for fish and squids (and sometimes check out ROVs, see videos of a surprising deep sea encounter made in 2015 off the coast of Louisiana, on Nautilus Live). They are renowned for attacking giant (Architeuthis spp) and colossal (Mesonychoteuthis hamiltoni) squids, which can reach more than 10 m in length. The squid sucker scars born by sperm whales give evidence of these titan combats. Because sperm whales only have teeth on the lower jaw, they cannot chew and may end up eating their prey alive. But every problem has its solution… sperm whales have evolved the longest digestive system in the world: it can reach 300 m long! Their stomach is divided into four compartments, the first of which is covered by a thick and muscular lining that can resist the assault of live prey.

Deluxe poopers  

The digestion of sperm whale prey happens in the next digestive compartments, but one component will resist: the squids’ beaks! As beaks accumulate in the digestive system (up to 18,000 beaks were found in a specimen!), they cause an irritation that is responsible for the production of a waxy substance known as ‘ambergris’. After a while, this substance is thought to be occasionally secreted along with the whale’s poop (although it has been speculated that large pieces of ambergris might be expelled by the mouth… charming!). Ambergris may be found floating at sea or washed up on coastlines, where it may make one happy beachcomber! The latest report of such a lucky finding of ambergris in 2016 was estimated at more than US$71,000 for a 1.57 kg lump. Indeed, ambergris is a valued additive used in perfume, although it has now mostly been replaced by synthetic equivalents. The use of ambergris in cooking, incense or medication in ancient Egypt and the Middle Ages is also reported.

Ambergris lump found in the UK in 2018 (photo credit: APEX, source: https://www.bbc.com/news/uk-england-devon-42703991)

Caring whales

Sperm whales are highly social animals. They are organized in “clans” with their own vocal repertoire and behavioral traits that differ geographically. Clans are formed by several connected social units, which are ruled by a complex matrilineal system. While adult males typically live solitary lives, females remain in family units composed of their close female relatives. Within these groups, females take communal care of the calves, even nursing the calves of other females. Every female can act as a babysitter to the group’s calves at the surface while the clan members perform deep foraging dives of approximately 40 min. Juvenile males may also provide care to the younger calves in the group as they remain in the group far past weaning, up to 9 to 19 years old. When attacked by predators (mostly killer whales), all the group members will protect the younger and most vulnerable individuals by adopting a compact formation, either the “marguerite” (facing inwards with their tails out and the young at the center for protection) or the “heads-out” version.

Social interaction in a pod of sperm whales… much like the whale version of a cuddle (photo credit: Tony Wu)

Powerful sonars

Like other toothed whales, sperm whales use sound to echolocate and communicate. But again, sperm whales stand out from the crowd with the unique spermaceti organ that allows them to produce the most powerful sound in the animal kingdom, reaching a source level of about 230 dB within frequencies of 5 to 25 kHz (this is louder than the sound of a jet engine at take-off). The spermaceti organ is a large cavity surrounded by a tough and fibrous wall called “the case”, and is filled with up to 1,900 liters of a fatty and waxy liquid called “spermaceti”. The spermaceti oil is chemically very different from the oils found in the melons (heads) of most other species of odontocetes, which also explains why sperm whales were particularly targeted by whalers of the 19th and 20th centuries. Indeed, the spermaceti oil has exceptional lubricant properties, and thus was used in fine machinery and even in the aerospace industry.

Original figure from Raven & Gregory 1933

Sperm whales are among the most widely distributed animals in the world, as they roam waters from the ice-edge to the equator. While pre-whaling global abundance is thought to have been 1,110,000 sperm whales, the most recent estimate suggests that only about a third of this number currently populates the ocean. It is our absolute duty to make sure that these marvelous, superlative animals recover from our past mistakes and that they can be admired by future generations.

Sources:

Gero, Shane, Jonathan Gordon, and Hal Whitehead (2013) “Calves as Social Hubs: Dynamics of the Social Network within Sperm Whale Units.” Proceedings of the Royal Society B: Biological Sciences 280 (1763). https://doi.org/10.1098/rspb.2013.1113

Graber, Cynthia (2007) “Strange but True: Whale Waste Is Extremely Valuable.” Scientific American. https://www.scientificamerican.com/article/strange-but-true-whale-waste-is-valuable/

Møhl, Bertel, Magnus Wahlberg, Peter T. Madsen, Anders Heerfordt, and Anders Lund (2003) “The Monopulsed Nature of Sperm Whale Clicks.” The Journal of the Acoustical Society of America, 114 (2): 1143–54. https://doi.org/10.1121/1.1586258

Raven, H C, and William K Gregory (1933) “The Spermaceti Organ and Nasal Passages of the Sperm Whale (Physeter Catodon) and Other Odontocetes.” American Museum Novitates, no. 677.

Whitehead, Hal (2018) “Sperm Whale.” Encyclopedia of Marine Mammals, 919–25. https://doi.org/10.1016/b978-0-12-804327-1.00242-9

Pretty science

By Solène Derville, Postdoc, OSU Department of Fisheries and Wildlife, Geospatial Ecology of Marine Megafauna Lab

Ever since I was a teenager, I have been drawn to both arts and sciences. When I decided to go down the path of marine biology and research, I never thought I would one day be led to exploit my artistic skills as well as my scientific interests.

Processing data, coding, analyzing, modeling… these tasks form the core of my everyday work and are what generates my excitement and passion for research. But once a new result has come up, or a new hypothesis has been formed, how boring would it be to keep it for myself? Science is all about communication, exchanges with our peers, with stakeholders, and with the general public. Graphical representations have always been supported in research throughout the history of sciences, and particularly the life sciences (Figure 1).

I have come to realize how much I enjoy this aspect of my work, and also how much I wish I was better prepared for it! In this blogpost I will talk about visual communication in science, and tackle the question of how to make our plots, diagrams, powerpoints, figures, maps, etc. convey information that goes beyond any spoken language? I have compiled a few tips from the design and infographics fields that I think could be reinvested in our scientific communication material.

Figure 1. Illustration from anonymous biology book (credit: Katie Garrett)

Plan, order, design

This suggestion may appear like a rather simplistic piece of advice, but any form of communication should start with a plan. What is the name of my project, the goal, and the audience? A scientific conference poster will not be created with the same design as a flyer aimed at the general public, nor will the same tools be used. Libre office powerpoint, canva, inkscape, scribus, R, plotly, GIMP… these are the open-source software I use on a regular basis but there so many more possibilities!

For whatever the type of visual you want to create, there are two major rules that need to be considered. First, embrace the empty space! You may think that you are wasting space that could be filled by all sorts of extremely valuable pieces of information… but this empty space has a purpose all by itself. The empty space brings forward the central elements of your design and will help focus the attention of the viewer toward them (top panel of Figure 2). Second, keep it neat and aligned. Whether you choose to anchor elements to each other or to an invisible grid, pay attention to details so that all images and text in the design from a harmonious whole (bottom panel in Figure 2).

Figure 2. Empty spaces and alignment principles of design – examples presented by Kingcom (http://kingkom.net/12-criteres-hierarchie-visuelle/)

Alignment is also an essential aspect to consider when editing images. More than any text, images will provide the first impression to the viewer and may subjectively communicate ideas in an instant. To make them most effective, images may follow the ‘rule of thirds’. Imagine breaking the image down into thirds, hence creating four directive lines over it (Figure 3). Placing the points of interest of the image at the intersections or along the lines will provide balance and attract the viewer’s attention. In marine mammal science where we often use pictures of animals with the ocean as a background, aligning the horizon along one of these horizontal lines may be a good technique (which I have not followed in Figure 3 though!).

Figure 3. Rule of thirds example applied to a photo of a humpback whale calf (South Lagoon New Caledonia, credit: Opération Cétacés – Solène Derville). Notice how the tip of the calf’s jaw is at the intersection of two lines.

When adding text to images, it is important to not overwhelm illustrations with text by trying to use extensive written material (which happens much too often). I try to keep the text to the strict minimum and let the visuals speak for themselves. When including text over or next to an image, I place the text in the empty spaces, where the eye is drawn to (Figure 4). When using dark or contrasted images, I add a semi-transparent layer in between the text and the image to make my text pop out.

Figure 4. Text embedding example applied to a photo of a humpback whale calf (South Lagoon New Caledonia, credit: Opération Cétacés – Solène Derville). Notice how I placed the text in the empty space so that the nose of the calf would point to it.

Fonts

Tired of using Arial, Times and Calibri but don’t know which other font to pick? One good piece of advice I found online was to choose a font that complements the purpose of the design. To do so, it is necessary to choose the message before picking the font. There are three categories of fonts (show in Image 1):

– Serif (classic style designed for books as the little feet at the extremities of the letters guide the eye along the lines of text)

– Sans serif (designed to look clean on digital screen)

– Display (more personality, but to be used in small doses!)

Image 1. Examples of each font category

I have also learned that pairing fonts together is often about using opposites (Figure 5). Contrasting fonts are complementary. For instance, it is visually appealing to combine a very bold font with a very light font, or a round font with something tall. And if you need more font choices than the ones provided by your usual software, here is a web repository to freely download thousands of different fonts: https://www.dafont.com

Figure 5. Paired fonts example applied to a photo of a humpback whale calf (South Lagoon New Caledonia, credit: Opération Cétacés – Solène Derville). Notice how I combined a rounded  font with  a smaller  sans serif font.

Colors

Colors have inherent meaning that depends on individual cultures. Whether we want it or not, any plot, photo, or diagram that we present to an audience will carry a subliminal message depending on its color palette. So better make it fit with the message!

Let us go passed the boring blue shades we have used for all of our marine science presentations so far, and instead open ourselves up to an infinite choice of colors! Color nuances are defined by three things: hue (the color itself), saturation (intensity, whether the color looks more subtle or more vibrant), and value (how dark or light a color is, ranging from white to black). The color wheel helps us visualize the relationships between hues and pick the best associations (Figure 6).

Figure 6. The color wheel helps us visualize the relationships between hues and pick the best associations. Any of the principles above should work, from the simple monochromatic schemes to the more complex triad or tetradic schemes.

First, pick the main color, the hero color for your design. Choose a cool color (blues and greens) if you want to provide a calming impression or a warm color (reds and yellows) for something more energizing. This basic principle of color theory made me think back on the black/blue dark shaded presentations that I might have attended in the past and had trouble staying awake!

Now, create your color palette, which are the three to four colors that will compose your design, ideally combining some vibrant and some more neutral colors for contrast. For instance, in a publication, a color palette may be used consistently in all plots or figures to represent a set of variables, study areas, or species . Now how do you pick the right complementary colors? The color wheel provides you with a few basic principles that should help you choose a palette (Figure 6). From monochromatic to tetradic schemes, the choice is up to you:

– monochromatic colors: varying values or saturation of a given color picked in the wheel

– analogous colors: colors sitting next to each other in the wheel

– complementary color: colors sitting opposite to each other

If you are an R user, there are a myriad of color palettes available to produce your visuals. One of the most comprehensive list I have found was compiled by Emil Hvitfeldt in github (https://github.com/EmilHvitfeldt/r-color-palettes). For discrete color palettes, I enjoy using the Canva palettes, which are available both in the Canva designs and in R using the ‘canva’ library in combination with the ‘ggplot2’ library (https://www.canva.com/learn/100-color-combinations/).

In practice, this means I can produce R plots or maps with color codes that match those I use in my canva presentations or posters. And finally, thumbs up to Dawn and Clara for creating our very own GEMM lab color palette based on whale photos collected in the field (Figure 7: https://github.com/dawnbarlow/musculusColors)!

Figure 7: Example of a R plot colored with the musculusColors package using the blue whale “Bmlunge” palette (credit: Dawn Barlow & Clara Bird)

I hope these few tips help you make your science as look as pretty as it is in your mind!

Sources:

A lot of the material in this blog post was inspired by the free tutorials provided by Canva: https://designschool.canva.com/courses/graphic-design-basics/?lesson=design-to-communicate

About the rule of thirds: https://digital-photography-school.com/rule-of-thirds/

About alignment: https://blog.thepapermillstore.com/design-principles-alignment/