By Quince Nye, GEMM Lab Summer Intern, Pacific High School Junior
I have spent a lot of my life surrounded by nature. I like to backpack, bike, dive, and kayak in these natural environments. I also have the luck of having parents who are always planning to take me on another adventure where I get to see nature and its inhabitants in ways most people don’t get to enjoy.
Through my backyard explorations, I have begun to realize that Port Orford has an amazing ecosystem in the coves and rivers that are very tied into our community. I’ve fished and swam in these rivers, gone on kayaking tours in these coves (with a great kayak company called South Coast Tours that we partner with), and I’ve seen the life that dwells in them.
Nathan and Maggie paddle out to Mill Rocks for early morning sample collection
Growing up in a school of less than 100 kids I have learned to never reject an opportunity to be a part of something bigger and learn from that experience. So when one of my close friends told me about an OSU project (a college I’m interested in attending) that needed interns to help collect data on gray whales, and kayak almost every day, I signed up without a doubt in my mind.
The team gets some good practice tracking Buttons (Whale #3). Left to right; Quince, Nathan, Maggie, Florence.
Fast forward a month, and I wake up at 5:20 am. I eat breakfast and get to the Port Orford Field Station. We make a plan for the operations of both the kayak team and cliff team. Today, I’m part of the cliff team, so I head up above the station to Fort Point. Florence and I set up the theodolite and computer at the lookout point and start taking half hour watch shifts searching the horizon for the spout of a gray whale. Sometimes you see one right away, but other times it feels like the whales are actively hiding from you. These are the times I wish Maggie was here with her endless supply of Disney soundtracks to help pass the hours.
Imitating a ship’s captain, Quince points toward our whale while shouting “Mark”.
A whale spouts out at Mill Rocks and starts heading across to the jetty. Hurray, its data collection time! I try to quickly move the cross-hairs of the theodolite onto the position of the whale using a set of knobs like those on an etch-a-sketch. As you may understand, it’s not an easy task at first but I manage to do it because I’ve been practicing for three weeks. I say “Mark!” cueing Florence to click a button in the program Pythagoras on the computer to record the whale’s position.
The left hand side of Buttons – notice the scatter of white markings on the upper back.
Meanwhile, Florence sees that the whale has two white spots where the fluke meets the knuckles. Those are identifying marks of the beloved whale, Buttons. This whale has been seen here since 2016 and is a fan favorite for our on-going research program. Florence gets just as excited every time and texts her eagerly awaiting interns of previous years all about the sighting. Of course Buttons is not the only whale to have identifying marks such as scars and pigmentation marks. This is why we make sure to get photos of the whales we spot, allowing us to do photo-ID analysis on them through comparison to our database of pictures from previous years.
Quince practices CPR protocol on a training mannequin on his first day.
So far I have gained skill after skill in this internship. I got CPR certified, took a kayak training class, learned how to use a theodolite, and have spent many educational (and frustrating) hours entering data in Excel. I joined the program because I was interested in all of these things. It surprised me that I was developing a relationship with the whales I’m researching. By the end of August I’m now sure that I will also know many of the whales by name. I will probably be much better at using an etch-a-sketch, and I will have had my first taste at what being a scientist is like. What I strive for, however, is to have the same look in my eyes that appears in Florence’s whenever a familiar whale decides to browse our kelp beds.
One of the biggest obstacles an undergraduate can face is fulfilling the degree requirement of completing an internship or research opportunity. With almost every university and degree program requiring it for graduation and many employers requiring prior experience, the amount of pressure and competition is intense.
After being rejected from the internships I applied for earlier in the year, I heard about Dr. Leigh Torres’s research with the Geospatial Ecology of Marine Megafauna (GEMM) Lab . I decided to email her and ask if she had any open positions. Fast-forward a few weeks and I am collaborating with Florence Sullivan, a recent masters graduate from OSU, on the logistics of my Gray Whale Foraging Behavior internship with the GEMM Lab.
My workstation while I conduct photo identification analysis in the field station classroom. The photos are displayed and organized in Adobe Bridge. Source: Maggie O’Rourke-Liggett
During my time with the GEMM Lab team, I have been assisting with photo identification analysis of gray whales (Eschrichtius robustus), using a theodolite and Pythagoras computer program to track their movements, collecting samples of the zooplankton they eat, and recording other oceanographic data with our time-depth recorder. This project is hoping to identify the drivers of gray whale fine-scale foraging behavior. For instance: Why do gray whales spend more time in some areas than others? Does the type or density of prey affect their behavior? Do the whales use static features like kelp beds to help find their food? As a senior currently studying oceanography, who desires to study whale behavior in the future, this internship is like finding a gold mine.
Nathan Malamud, our other high school intern, and I working together to set up the theodolite in backyard during a practice run. Source: Florence Sullivan
Ever since day one at Hatfield Marine Science Center, I’ve been working with people who share the same passions for marine mammals as me. Spending hours upon hours sorting thousands of pictures may seem like a painful, tedious job, but knowing my work helps others to update existing identification catalogs makes it worthwhile. Plus, who wouldn’t want to look at whales all day?! After a while, you start to recognize specific individuals based on their various pigment configurations and scars. Once you can recognize individuals, it makes the sorting go by faster and helps with recognizing individual whales in the wild faster. It’s always exciting to sort through the photos and observe from the cliff or kayak and recognize a whale from the photo identification work.
After Florence taught me how to set up and operate the theodolite, a survey tool used to track a whale’s movements, we taught a class to undergrads on how to use it. I’ll never get over how people’s faces lit up when we discussed how the instrument works and its role in the overall mission.
Quince Nye, one of our high school interns, using side strokes to stabilize the kayak while I deploy our zooplankton net over the side with a down rigger. Source: Florence Sullivan
These past two weeks at OSU’s Port Orford Field Station have been like living on a little slice of heaven. My days are filled with clear views of the coast and the sound of waves crashing serve as a backdrop on my home for the month, the bed-and-breakfast turned field station. Each morning, the sun fills my room as I gather my gear for the day and help my teammates load the truck. We spend long days on the water collecting zooplankton samples and GoPro video or on the cliff recording whale behavior through the theodolite. To anyone searching for an internship and feeling burnt out from completing application after application, don’t give up. You’ll find your slice of heaven too.
Join us for a couple boat rides as we study blue whales in the South Taranaki Bight of New Zealand.
In both videos below you can see and hear the field team coordinate to capture photo-identification images of the whale(s) while also obtaining a small tissue biopsy sample. It is important to match the individual whale to the sample so we can link biological data obtained from the sample (genetics, hormones, stable isotopes) to the individual whale. We also carefully take notes on where, when and what we collect in order to help us keep track of our data.
In this video clip you can watch as we gently approach two blues surfacing off the starboard bow of the RV Star Keys in order to capture photo-identification images and a small tissue biopsy sample. Callum Lilley (DOC) on the bow; Leigh Torres, Dawn Barlow, and Todd Chandler (OSU) photographing and coordinating from the flying bridge.
We are in the small boat here collecting data on a pair of blue whales. Callum Lilley (DOC) is on the rifle; Leigh Torres (OSU) is on the camera and taking notes; Todd Chandler (OSU) is on the helm.
Our third day aboard the Oceanus began in the misty morning fog before the sun even rose. We took the first CTD cast of the day at 0630am because the physical properties of the water column do not change much with the arrival of daylight. Our ability to visually detect marine mammals, however, is vastly improved with a little sunlight, and we wanted to make the best use of our hours at sea possible.
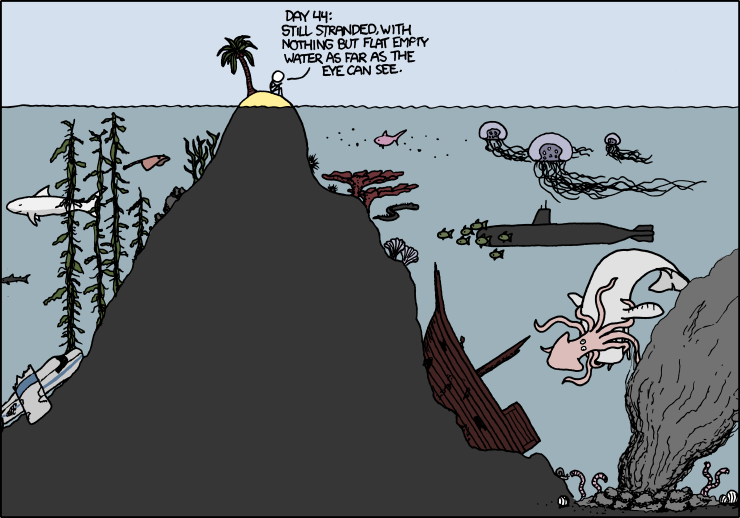
Randall Munroe www.XKCD.com
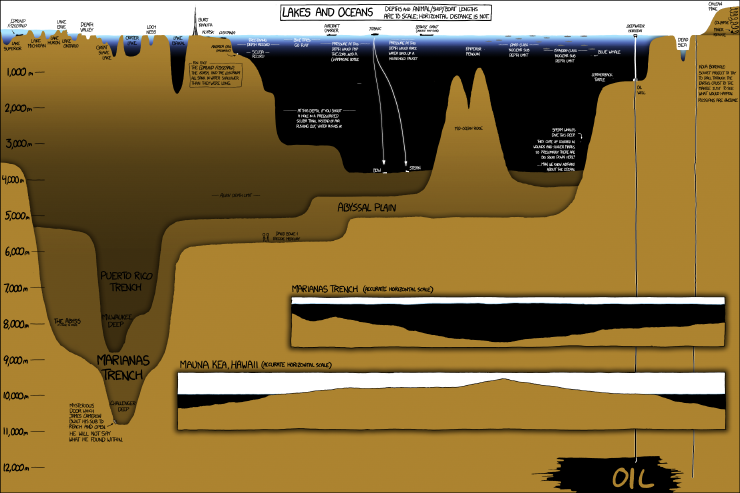
Our focus on day three was the Astoria canyon – a submarine feature just off the Oregon and Washington coast. Our first oceanographic station was 40 miles offshore, and 1300 meters deep, while the second was 20 miles offshore and only 170 meters deep. See the handy infographic below to get a perspective on what those depths mean in the grand scheme of things. From an oceanographic perspective, the neatest finding of the day was our ability to detect the freshwater plume coming from the Columbia River at both those stations despite their distance from each other, and from shore! Water density is one of the key characteristics that oceanographers use to track parcels of water as they travel through the ocean conveyor belt. Certain bodies of water (like the Mediterranean Sea, or the Atlantic or Pacific Oceans) have distinct properties that allow us to recognize them easily. In this case, it was very exciting to “sea” the two-layer system we had gotten used to observing overlain with a freshwater lens of much lower salinity, higher temperature, and lower density. This combination of freshwater, saltwater, and intriguing bathymetric features can lead to interesting foraging opportunities for marine megafauna – so, what did we find out there?
Morning conditions were almost perfect for marine mammal observations – glassy calm with low swell, good, high, cloud cover to minimize glare and allow us to catch the barest hint of a blow….. it should come as no surprise then, that the first sightings of the day were seabirds and tuna!
I didn’t catch any photos of the tuna, so here’s some sunfish we spotted. photo credit: Florence Sullivan
One of the best things about being at sea is the ability to look out at the horizon and have nothing but water staring back at you. It really drives home all the old seafaring superstitions about sailing off the edge of the world. This close to shore, and in such productive waters, it is rare to find yourself truly alone, so when we spot a fishing trawler, there’s already a space to note it in the data log. Ships at sea often have “follower” birds – avians attracted by easy meals as food scraps are dumped overboard. Fishing boats usually attract a lot of birds as fish bycatch and processing leftovers are flushed from the deck. The birders groan, because identification and counts of individuals get more and more complicated as we approach other vessels. The most thrilling bird sighting of the day for me were the flocks of a couple hundred fork-tailed storm petrels.
I find it remarkable that such small birds are capable of spending 80% of their life on the open ocean, returning to land only to mate and raise a chick. Their nesting strategy is pretty fascinating too – in bad foraging years, the chick is capable of surviving for several days without food by going into a state of torpor. (This slows metabolism and reduces growth until an adult returns.)
Just because the bird observers were starting to feel slightly overwhelmed, doesn’t mean that the marine mammal observers stopped their own survey. The effort soon paid off with shouts of “Wait! What are those splashes over there?!” That’s the signal for everyone to get their binoculars up, start counting individuals, and making note of identifying features like color, shape of dorsal fin, and swimming style so that we can make an accurate species ID. The first sighting, though common in the area, was a new species for me – Pacific white sided dolphins!
A Pacific white sided dolphin leaps into view. photo credit: Florence Sullivan. Taken under NMFS permit 16111 John Calambokidis
A pod of thirty or so came to ride our bow wake for a bit, which was a real treat. But wait, it got better! Shortly afterward, we spotted more activity off the starboard bow. It was confusing at first because we could clearly see a lot of splashes indicating many individuals, but no one had glimpsed any fins to help us figure out the species. As the pod got closer, Leigh shouted “Lissodelphis! They’re lissodelphis!” We couldn’t see any dorsal fins, because northern right whale dolphins haven’t got one! Then the fly bridge became absolute madness as we all attempted to count how many individuals were in the pod, as well as take pictures for photo ID. It got even more complicated when some more pacific white sided dolphins showed up to join in the bow-riding fun.
Northern right whale dolphins are hard to spot! photo credit: Florence Sullivan Taken under NMFS permit 16111 John Calambokidis
All told, our best estimates counted about 200 individuals around us in that moment. The dolphins tired of us soon, and things continued to calm down as we moved further away from the fishing vessels. We had a final encounter with an enthusiastic young humpback who was breaching and tail-slapping all over the place before ending our survey and heading towards Astoria to make our dock time.
Humpback whale breach. photo credit: Florence Sullivan. Taken under NMFS permit 16111 John Calambokidis
As a Washington native who has always been interested in a maritime career, I grew up on stories of The Graveyard of the Pacific, and how difficult the crossing of the Columbia River Bar can be. Many harbors have dedicated captains to guide large ships into the port docks. Did you know the same is true of the Columbia River Bar? Conditions change so rapidly here, the shifting sands of the river mouth make it necessary for large ships to receive a local guest pilot (often via helicopter) to guide them across. The National Motor Lifeboat School trains its students at the mouth of the river because it provides some of “the harshest maritime weather conditions in the world”. Suffice it to say, not only was I thrilled to be able to detect the Columbia River plume in our CTD profile, I was also supremely excited to finally sail across the bar. While a tiny part of me had hoped for a slightly more arduous crossing (to live up to all the stories you know), I am happy to report that we had glorious, calm, sunny conditions, which allowed us all to thoroughly enjoy the view from the fly bridge.
Cape Disappointment Lighthouse at the Columbia River Bar.
Finally, we arrived in Astoria, loaded all our gear into the ship’s RHIB (Ridged Hulled Inflatable Boat), lowered it into the river, descended the rope ladder, got settled, and motored into port. We waved goodbye to the R/V Oceanus, and hope to conduct another STEM cruise aboard her again soon.
Now if the ground would stop rolling, that would be just swell.
Last but not least, here are the videos we promised you in Oceanus Day Two – the first video shows the humpback lunge feeding behavior, while the second shows tail slapping. Follow our youtube channel for more cool videos!
By Dawn Barlow, MSc Student, Oregon State University
Perhaps you’ve read some posts about New Zealand blue whales on this blog from the past field season in the South Taranaki Bight (STB). I know I eagerly awaited updates from the field while the team was in New Zealand and I was in Southern California, finishing undergrad and writing funding proposals and grad school applications. Now that undergrad is done and dusted, I’ve arrived in Newport and begun to settle in to my next chapter as the newest member of the GEMM Lab, joining the blue whale research team as a MSc student in OSU’s Department of Fisheries and Wildlife. Since no blue whale news has made it onto this blog in some time, I’m excited to share what has happened since the team returned from the field!
As you may have heard from Leigh, Callum, and Kristin, 2016 was a fruitful field season. In nearly 1,500 miles of vessel surveys, the team documented blue whale foraging behavior, a pair of racing whales, four mother-calf pairs, what may be the first aerial footage of nursing behavior in baleen whales (video below), and a whale with apparent deformities. Five hydrophones units were deployed, fecal and biopsy samples were collected, oceanographic conditions were measured, and photos were taken.
I was welcomed into the GEMM Lab in early July, and presented with a workspace, a hard drive with thousands of photos, new software programs to learn, wonderfully accessible tea and coffee, and tasked with creating a photo-ID catalog of all the blue whales our team photographed this past field season. Here’s a great thing about blue whales: while they may be tricky to study, when someone sees a blue whale they are often excited to report it. In addition to the data collected by our team during the 2016 season and the 2014 pilot season, we are incorporating many photo-documented sightings of blue whales from all around New Zealand that we have received from collaborative researchers, whale watch organizations, and fishing vessels alike captured between 2004 and 2016. All these photos are precious data to us, as we can use them to better understand their ecology.
There are many unanswered questions about this population of blue whales in New Zealand — How many are there? Just how big are they? Do they stay in New Zealand year-round or are they migratory? Through the photo-ID analysis that I’ve done, we are just beginning to piece together some answers. We have now compiled records of sightings in New Zealand from every month of the year. I’ve identified 94 unique individual blue whales, 26 of which were sighted in the STB during the 2016 season. Five whales were seen in multiple years (Figure 1), including one whale that was seen in three different years, in three different places, and with three different calves! And what might all of this mean? At this point it’s still speculative, but these findings hint at year-round residency and seasonal movement patterns within New Zealand waters… with more data and more analysis I will be able to say these things more conclusively.
Figure 1. Blue whale photographed off of Westport on 31 January 2013 (above) by the Australian Antarctic Division (data provided by Mike Double), and in the South Taranaki Bight on 2 February 2016 (below). Note how the tear in the dorsal fin has healed over the three-year period.
Perhaps you’ve read Leila’s post about photogrammetry, and how she is able to make measurements using aerial photographs captured using an Unmanned Aerial System (UAS, aka ‘drone’). Using the same method, I will soon be able to tell you how long these whales really are (Figure 2).
Figure 2. An aerial photograph captured with the UAS during the 2016 season, which will be used to measure the length of these whales using photogrammetry.
How many of them are there? Well, that’s a trickier question. Using a straightforward abundance calculation based on our rate of re-sightings, the estimate I came up with is 594 ± 438. In other words, I can say with 95% confidence that there are between 156 and 1031 blue whales in New Zealand. How helpful is this? Well, not very! The wide confidence intervals in this estimate are problematic, and it is difficult to draw any conclusions when the range of possible numbers is so large. So stay tuned as I will be learning more about modeling population abundance estimates in order to provide a more precise and descriptive answer.
But stepping back for a minute, what does it matter how many whales there are and what they’re doing? In 2014, Leigh demonstrated that the STB is an important foraging ground for these blue whales. However, the STB is also a region heavily used by industry, experiencing active oil and gas extraction (Figure 3), seismic surveying, shipping traffic, and proposed seafloor mining. If we don’t know how the blue whales are using this space, then how can we know what effect the presence of industry will have on their ecology? It is our hope that findings from this study can guide effective conservation and management of these ocean giants as well as the ecosystem they are part of.
Figure 3. A blue whale surfaces in front of an oil rig. Photo by Deanna Elvines.
Keeping these goals in mind, I’m eagerly awaiting the start of our 2017 field season in the STB. As I look through all these photos I feel like I’m getting to know this group of whales just a little bit and I look forward to being on the water seeing them myself, maybe even recognizing some from the 2016 photos. More time on the water and more data will bring us closer to the piecing together the story of these whales, and inevitably open doors to more questions than we started with. And in the meantime, I’m grateful for the community I’ve found here in the GEMM Lab, at Hatfield Marine Science Center, and in Newport.
By Leila Lemos, Ph.D. Student, Department of Fisheries and Wildlife, OSU
Have you ever heard of statistical modeling? What about Hierarchical Bayes Models?
Hard words, I know…
Modeling is when known data (previously collected) is analyzed using sophisticated computer algorithms to look for patterns in these data. Models can be very useful for filling in data gaps where and when no sampling occurred. Hierarchical Bayes model is a type of statistical model that hierarchically integrates the observed data to estimate parameters. This type of model can analyze long-term data from individual animals to predict into data gaps and inform us about population dynamics.
When studying wild animals we often only collect data from brief and random encounters. Therefore, many researchers struggle with the reconstruction of possible pathways that could connect different sightings of wild animals to determine where, when and how the animal was doing in between sightings.
For instance, consider an animal that was observed in healthy condition at one sighting but in a subsequent sighting it was in poor health. How can we estimate what happened to this animal between sightings? Can we estimate where, when and how health deteriorated?
This is where the modeling comes in! It is a powerful tool used by many researchers to fill in gaps in our scientific knowledge using data that we do have. We use these ‘known data’ to estimate patterns and determine probabilities. The hierarchical Bayes model is a type of modeling that can be used to estimate the probability of pathways between known events. Schick et al. (2013) used hierarchical Bayes models to estimate the many factors that impact whale health and survivorship including distribution and movement patterns, true health condition of the individual and survival rates.
Modeling is very advantageous when studying aquatic animals like dolphins and whales that are very hard to spot since they spend a higher proportion of their lives submerged than above water. Also, sea conditions can hamper visual detection.
Schick et al. (2013) analyzed decades of data from photo-identifications of North Atlantic right whale resightings along the east coast of North America. They assessed different information from these pictures including body condition, infestation of cyamids, presence of fishing gear entanglements, rake marks and skin condition. The authors also used information of age and calving of the individuals. A model using these data was constructed and a more complete scenario of health and movement patterns of individuals and the populations were estimated. Survival rates of each individual were also estimated using this model. This is an example of a well-informed model and is important to notice that a model is only as good as the data you put into the model.
Using this model, Schick et al. documented variations in annual spatial distribution patterns between sexes (Fig. 1). For example, females arrive earlier to the BOF region than males, and have greater estimated transitions to SEUS region at the end of the year. It is also possible to see that there is a lack of information for the region MIDA, characterizing another advantage of modeling since it can highlight areas where effort should be increased.
Figure 1: Movement transition estimates from North to South regions in the western Atlantic Ocean for male and female right whales over the course of a year. Size of the circles in each region at each month corresponds to the actual number of right whales observed. Lines connecting regions indicate probability of transition. Magnitude of probability is depicted by line thickness. (NRTH: North region; BOF: Bay of Fundy; JL: Jeffreys Ledge; GOM: Gulf of Maine; RB: Roseway Basin; NE: Northeast; GSC: Great South Channel; MIDA: Mid-Atlantic; and SEUS: Southeastern US). Source: Figures 5 and 6 from Schick et al. 2013.
When the model is applied to individual whales, the authors were able to estimate survival and health rates across the whale’s life-span (Fig. 2). Whale #1077 was a rarely seen adult male, with a sparse sighting history over 25 years. The last sighting of this whale was in 2004 when its health status was poor due to a poor body condition. According with his condition in the last sighting, the model predicted a high decrease in his health over time and since the whale was not seen for more than six years, so was presumed dead, following the standards set by the North Atlantic Right Whale Consortium.
Figure 2: Health time series for whale #1077. Time series of health observations for body condition, cyamids, entanglements, rake marks and skin condition (circles), estimates with uncertainty of health (thick line and dashed lines) and estimates of survivals (height rectangle at bottom). Photographic observations are color and size coded by class (three categories for body condition: green is good, orange is fair and purple is poor; and two categories for skin condition: green is good and orange is poor). Source: Figure 11 from Schick et al. 2013.
The marine environment is constantly changing, across space and over time. Therefore, distinguishing what contributes most significantly to whale stress levels can be very challenging. However, through a model we may be able to decipher the contributions of several factors to individual stress among the many parameters we are monitoring: ocean noise, prey availability, environmental patterns, season, sex, age, geographic area, reproductive status and body condition.
Marine ecology is a complex world, and sometimes complex models are needed to help us to find patterns in our data! Once estimates of these ecological processes are created and different hypotheses are explored, information can then be provided to conservation and environmental management to aid decision making, such as defining thresholds of ambient ocean noise levels in the vicinity of baleen whales.
Bibliographic Reference:
Schick RS, Kraus SD, Rolland RM, Knowlton AR, Hamilton PK, Pettis HM, Kenney RD and Clark JS. 2013. Using Hierarchical Bayes to Understand Movement, Health, and Survival in the Endangered North Atlantic Right Whale. PLOS ONE 8(6):e64166.
Happy Spring everyone! You may be wondering where the gray whale updates have been all winter – and while I haven’t migrated south to Baja California with them, I have spent many hours in the GEMM Lab processing data, and categorizing photos.
You may recall that one of my base questions for this project is:
Do individual whales have different foraging strategies?
In order to answer this question, we must be able to tell individual gray whales apart. Scientists have many methods for recognizing individuals of different species using tags and bands, taking biopsy samples for DNA analysis, and more. But the method we’re using for this project is perhaps the simplest: Photo-Identification, which relies on the unique markings on individual animals, like fingerprints. All you need is a camera and rather a lot of patience.
Bottlenose dolphins were some of the first cetaceans to be documented by photo-identification. Individuals are identified by knicks and notches in their fins. Humpback whales are comparatively easy to identify – the bold black and white patterns on the underside of their frequently displayed flukes are compared. Orcas, one of the most beloved species of cetaceans, are recognized thanks to their saddle patches – again, unique to each individual. Did you know that the coloration and shape of those patches is actually indicative of the different ecotypes of Orca around the world? Check out this beautiful poster by Uko Gorter to see!
Gray whale photo identification is a bit more subtle since these whales don’t have dorsal fins and do not show the undersides of their fluke regularly. Because gray whales can have very different patterns on either side of their body, it is also important to get photos of both their right and left sides, as well as the fluke, to be sure of recognizing an individual if it comes around again. When taking photos of a gray whale, it’s a good idea to include the dorsal hump, where the knuckles start as it dives, as an easy indicator of which side of the body you are looking at when you’re trying to match photos. Some clues that I often use when identifying an individual include the placement of barnacles, and patterns of pigmentation and scars. You can see that patience and a talent for pattern recognition come in handy for this sort of work.
While we were in the field, it was important for my team to quickly find reference features to make sure we were always tracking the same whale. If you stopped by to visit our field station, you may have heard use saying things like “68 has white on both fluke-tips”, “70 has a propeller scar on the left side”, “the barnacles on 54’s head looks like a polyp”, or “27 has a smiley face in front of the first knuckle left side.” Sometimes, if a trait was particularly obvious, and the whale visited our field station more than once, we would give them a name to help us remember them. These notes were often (but to my frustration, not always!) recorded in our field notebook, and have come in handy this winter as I have systematically gone through the 8000+ photos we took last summer, identifying each individual, and noting whenever one was a repeat visitor. With these individuals labeled, I can now assess their level of behavioral and distribution consistency within and between study sites, and over the course of the summer.
Why don’t you try your luck? How many individuals are in this photoset? How many repeats? If I tell you that my team named some of these whales Mitosis, Smiley, Ninja and Keyboard can you figure out which ones they are?
#1#2#3#4#5#6#7#8#9#10
Keep scrolling for the answer key ( I don’t want to spoil it too easily!)
Answers:
There are 7 whales in this photoset. Smiley and Keyboard both have repeat shots for you to find, and Smiley even shows off both left and right sides.
Whale 18 – Mitosis
Whale 70 -Keyboard
Whale 23 -Smiley
Whale 68 – Keyboard
Whale 27 -Smiley
Whale 67
Whale 36 -Ninja
Whale 60 – “60”
Whale 38 – has no nickname even if we’ve seen it 8 times! Have any suggestions? leave it in the comments!