By Abby Tomita, undergraduate student, OSU College of Earth, Ocean, and Atmospheric Sciences
From long days in Newport performing the patience-testing task of bomb calorimetry, to spending hours transfixed by the microscopic world that exists in our oceans, I recently got an amazing glimpse into the world of marine biological research working with PhD student Rachel Kaplan. She has been an amazing teacher to my fellow intern Hadley and I, showing us the basics of the research process and introducing us to so many wonderful people at NOAA and the GEMM Lab. I am in my third year studying oceanography here at OSU and had no real lab experience before this, so I was eager to explore this area of research, and not only learn new information about our oceans, but also to see the research process up close and personal.
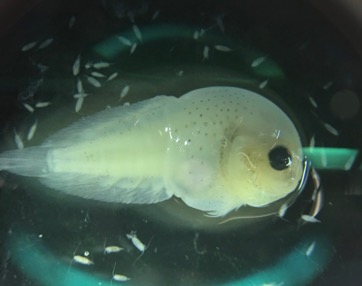
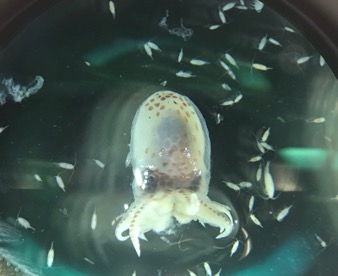
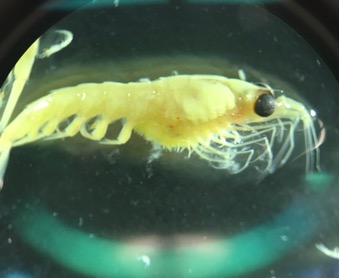
After being trained by Jennifer Fisher, a NOAA Research Fisheries Biologist, I sorted through zooplankton samples collected on the R/V Bell M. Shimada from the Northern California Current region. This data will be used to get an idea of where krill are found throughout the year, and in what abundances. Though my focus was mainly on two species of krill, I also found an assortment of other organisms, such as larval fish, squid, copepods, crabs, and tons of jellies, which were super interesting to see.
I also studied krill through a technique called bomb calorimetry, which is not for the faint of heart! It takes a tough soul to be able to put these complex little creatures into a mortar and pestle and grind them into a dust that hits your nose like pepper. They then take their final resting place into the bomb calorimetry machine (which can and will find something to fuss over) until it finally manages to ignite and dispose of the krill’s remains. The light that guided me through this dark tunnel was the knowledge that these sacrificial krill were taken in the name of science, with the aim of eventually decreasing whale entanglements.
That, and Rachel’s contagious positivity. In the early stages, we would spend the majority of our time troubleshooting after constant “misfires”, in which the machine fails to combust the sample properly. Bomb calorimetry involves many tedious steps, and working with such small quantities of tissue – a single krill could weigh 0.01 grams or even less – poses a plethora of its own challenges. One of my biggest takeaways from this experience was to have patience with this kind of work and know when to take a much-needed dance break. Things often do not work out according to plan, and getting to see first-hand how to adapt to confounding variables and hitches in the procedure was an invaluable lesson.
I also got to see how collaborative the research process is. We received helpful advice from other members of the GEMM Lab at lunch, as well as constant help from our esteemed Resident Bomb Cal Expert, Elizabeth Daly. It was comforting for me to see that even when you are doing independent research, you are not expected to only work alone, and there can be so much community in higher level research.
Did you enjoy this blog? Want to learn more about marine life, research, and conservation? Subscribe to our blog and get a weekly message when we post a new blog. Just add your name and email into the subscribe box below.
By Hadley Robinson, undergraduate student, OSU College of Earth, Ocean, and Atmospheric Sciences and School of Language, Culture, and Society
My name is Hadley Robinson and I am a sophomore undergraduate at OSU, double majoring in Environmental Science and Spanish. This summer, I had the privilege of working with Rachel on her PhD research project involving bomb calorimetry, a technique that allows you to quantify the caloric content of organisms like the zooplankton krill.
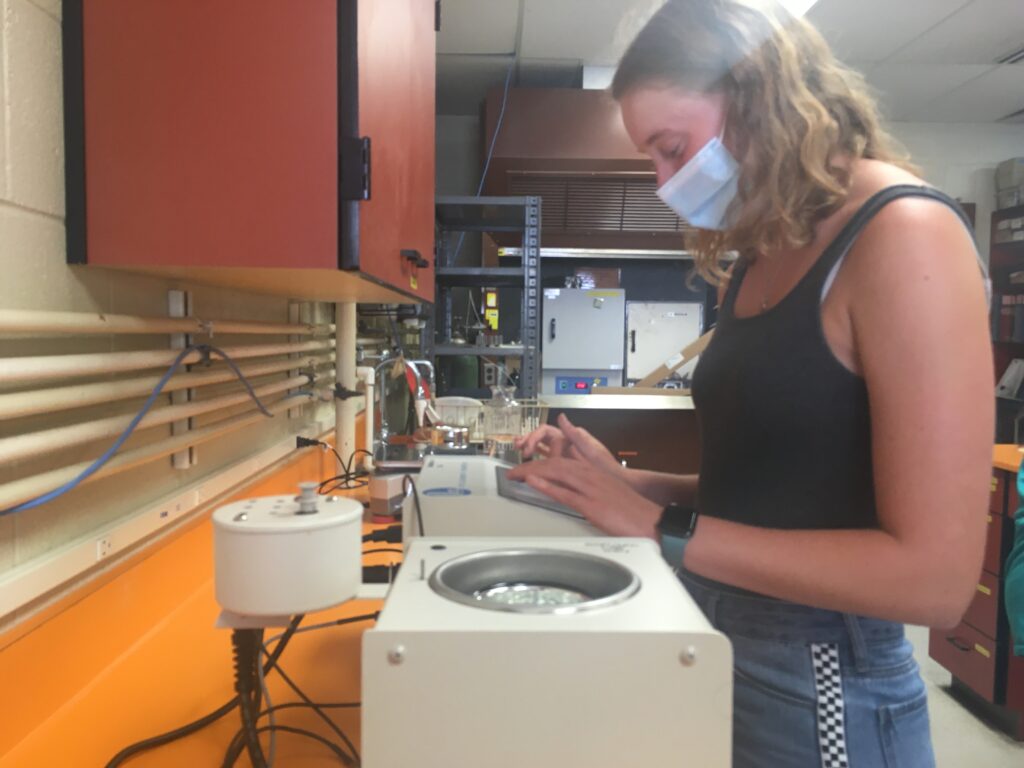
Hadley preparing the bomb calorimetry machine to run a sample (photo by Rachel Kaplan).
Prior to this internship, I had never worked in a lab before, and as an environmental science major, I had no previous exposure to oceanography. The connection that Rachel made between our labwork and the broader goal of helping decrease whale entanglement events sparked my interest in this project. Our work this summer aimed to process a set of krill samples collected off the coast of Oregon and Washington, so that we could find the number of calories in single krill, and then look at patterns in krill caloric content based on their species, sex, and other characteristics.
We first identified the krill by species and sex (this was my favorite part of the experiment!). I not only loved looking at them under the microscope, but I also loved how it became a collaborative process. We quickly began getting each other’s opinions on whether or not a krill was Euphausia pacifica, Thysanoessa spinifera, male, female, sexless, gravid (carrying eggs), and much more.
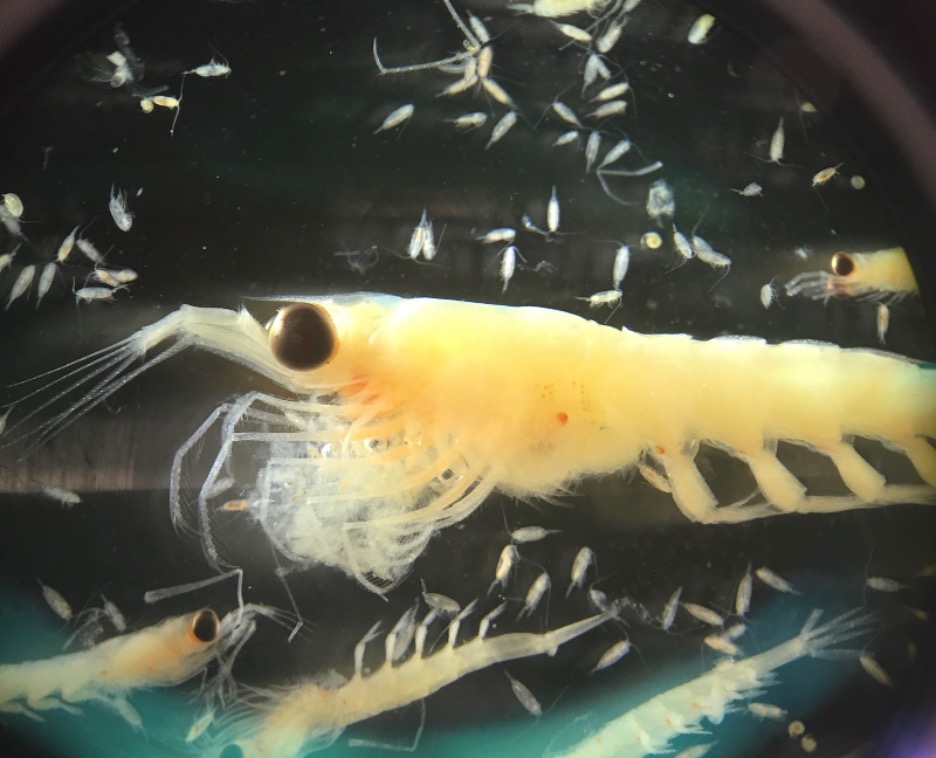
Female Thysanoessa spinifera krill (photo by Abby Tomita).
After identification, we weighed and dried the krill, and finally turned them into small pellets that could fit in an instrument called a bomb calorimeter. These pellets were placed individually into in a “bomb cell” that could then be filled with oxygen and receive a shock from a metal wire. When the machine sent an electric pulse through the wire and combusted the krill pellet, the water surrounding the bomb cell warmed very slightly. The instrument measures this minute temperature change and uses it to calculate the amount of energy in the combusted material. With this information, we were able to quantify how many calories each krill sample contained. Eventually, this data could be used to create a seasonal caloric map of the ocean. Assuming that foraging whales seek out regions with calorically dense prey, such a map could play a crucial role in predicting whale distributions.
Working with Rachel taught me how dynamic the world of research really is. There were many variables that we had to control and factor into our process, such as the possibility of high-calorie lipids being lost if the samples became too warm during the identification process, the risk of a dried krill becoming rehumidified if it sat out in the open air, and even the tiny amount of krill powder inevitably lost in the pelletization process. This made me realize that we cannot control everything! Grappling with these realities taught me to think quickly, adapt, and most importantly, realize that it is okay to refine the process of research as it is being conducted.
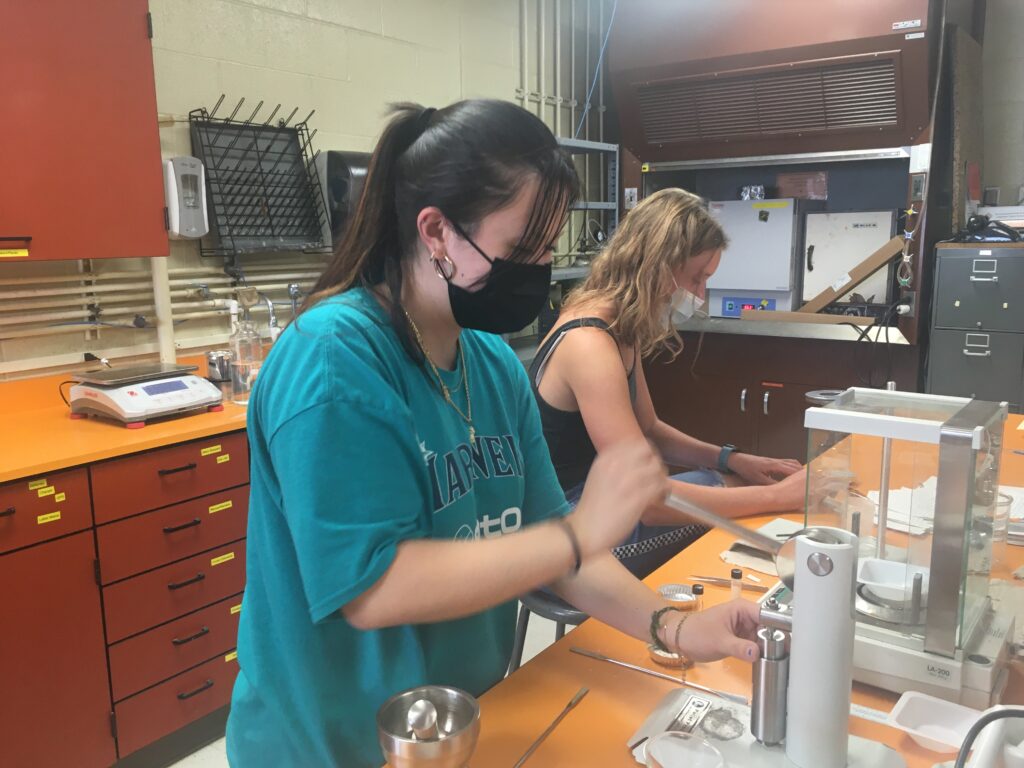
Intern Abby (left) pressing the krill powder into a pellet and Hadley (right) prepping the bomb (photo by Rachel Kaplan).
Did you enjoy this blog? Want to learn more about marine life, research, and conservation? Subscribe to our blog and get a weekly message when we post a new blog. Just add your name and email into the subscribe box below.
I always have a small crisis before heading into the field, whether for a daytrip or a several-month stint. I’m always dying to go – up until the moment when it is actually time to leave, and I decide I’d rather stay home, keep working on whatever has my current focus, and not break my comfortable little routine.
Preparing to leave on the most recent Northern California Current (NCC) cruise was no different. And just as always, a few days into the cruise, I forgot about the rest of my life and normal routines, and became totally immersed in the world of the ship and the places we went. I learned an exponential amount while away. Being physically in the ecosystem that I’m studying immediately had me asking more, and better, questions to explore at sea and also bring back to land.
Many of these questions and realizations centered on predator-prey relationships between krill and whales at fine spatial scales. We know that distributions of prey species are a big factor in structuring whale distributions in the ocean, and one of our goals on this cruise was to observe these relationships more closely. The cruise offered an incredible opportunity to experience these relationships in real time: while my labmates Dawn and Clara were up on the flying bridge looking for whales, I was down in the acoustics lab, watching incoming echosounder data in order to identify krill aggregations.
From left, Clara and Dawn survey for marine mammals on the flying bridge.
We used radios to stay in touch with what we were each seeing in real time, and learned quickly that we tended to spot whales and krill almost simultaneously. Experiencing this coherence between predator and prey distributions felt like a physical manifestation of my PhD. It also affirmed my faith in one of our most basic modeling assumptions: that the backscatter signals captured in our active acoustic data are representative of the preyscape that nearby whales are experiencing.
Being at sea with my labmates also catalyzed an incredible synthesis of our different types of knowledge. Because of the way that I think about whale distributions, I usually just focus on whether a certain type of whale is present or not while surveying. But Clara, with her focus on cetacean behavior, thinks in a completely different way from me. She timed the length of dives and commented on the specific behaviors she noticed, bringing a new level of context to our observations. Dawn, who has been joining these cruises for five years now, shared her depth of knowledge built through returning to these places again and again, helping us understand how the system varies through time.
Observing whale behavior, such as for these humpbacks, provides valuable information on how they are using a given area.
One of the best experiences of the cruise for me was when we conducted a targeted net tow in an area of foraging humpbacks on the Heceta Head Line off the central Oregon coast. The combination of the krill signature I was seeing on the acoustics display, and the radio reports from Dawn and Clara of foraging dives, convinced me that this was an opportunity for a net tow, if possible, to see exactly what zooplankton was in the water near the whales. Our chief scientist, Jennifer Fisher, and the ship’s officers worked together to quickly turn the ship around and get a net in the water, in an effort to catch krill from the aggregation I had seen.
This unique opportunity gave me a chance to test my own interpretation of the acoustics data, and compare what we captured in the net with what I expected from the backscatter signal. It also prompted me to think more about the synchrony and differences between what is captured by net tows and echosounder data, two primary ways for looking at whale prey.
Collecting tiny yet precious krill samples associated with foraging humpbacks!
Throughout the entire cruise, the opportunity to build my intuition and notice ecological patterns was invaluable. Ecosystem modeling gives us the opportunity to untangle incredible complexity and put dynamic relationships in mathematical terms, but being out on the ocean provides the chance to develop a feel for these relationships. I’m so glad to bring this new perspective to my next round of models, and excited to continue trying to tease apart fine-scale dynamics between whales and krill.
Did you enjoy this blog? Want to learn more about marine life, research, and conservation? Subscribe to our blog and get a weekly message when we post a new blog. Just add your nameand email into the subscribe box below.
1PhD student, Oregon State University College of Earth, Ocean, and Atmospheric Sciences and Department of Fisheries, Wildlife, and Conservation Sciences, Geospatial Ecology of Marine Megafauna Lab
What do peanut butter m&ms, killer whales, affogatos, tired eyes, and puffins all have in common? They were all major features of the recent Northern California Current (NCC) ecosystem survey cruise.
The science party of the May 2022 Northern California Current ecosystem cruise.
We spent May 6–17 aboard the NOAA vessel Bell M. Shimada in northern California, Oregon, and Washington waters. This fabulously interdisciplinary cruise studies multiple aspects of the NCC ecosystem three times per year, and the GEMM lab has put marine mammal observers aboard since 2018.
This cruise was a bit different than usual for the GEMM lab: we had eyes on both the whales and their prey. While Dawn Barlow and Clara Bird observed from sunrise to sunset to sight and identify whales, Rachel Kaplan collected krill data via an echosounder and samples from net tows in order to learn about the preyscape the whales were experiencing.
From left, Rachel, Dawn, and Clara after enjoying some beautiful sunset sightings.
We sailed out of Richmond, California and went north, sampling as far north as La Push, Washington and up to 200 miles offshore. Despite several days of challenging conditions due to wind, rain, fog, and swell, the team conducted a successful marine mammal survey. When poor weather prevented work, we turned to our favorite hobbies of coding and snacking.
Rachel attends “Clara’s Beanbag Coding Academy”.
Cruise highlights included several fin whales, sperm whales, killer whales, foraging gray whales, fluke slapping and breaching humpbacks, and a visit by 60 pacific white-sided dolphins. While being stopped at an oceanographic sampling station typically means that we take a break from observing, having more time to watch the whales around us turned out to be quite fortunate on this cruise. We were able to identify two unidentified whales as sei whales after watching them swim near us while paused on station.
Marine mammal observation segments (black lines) and the sighting locations of marine mammal species observed during the cruise.
On one of our first survey days we also observed humpbacks surface lunge feeding close to the ship, which provided a valuable opportunity for our team to think about how to best collect concurrent prey and whale data. The opportunity to hone in on this predator-prey relationship presented itself in a new way when Dawn and Clara observed many apparently foraging humpbacks on the edge of Heceta Bank. At the same time, Rachel started observing concurrent prey aggregations on the echosounder. After a quick conversation with the chief scientist and the officers on the bridge, the ship turned around so that we could conduct a net tow in order to get a closer look at what exactly the whales were eating.
Success! Rachel collects krill samples collected in an area of foraging humpback whales.
This cruise captured an interesting moment in time: southerly winds were surprisingly common for this time of year, and the composition of the phytoplankton and zooplankton communities indicated that the seasonal process of upwelling had not yet been initiated. Upwelling brings deep, cold, nutrient-rich waters to the surface, generating a jolt of productivity that brings the ecosystem from winter into spring. It was fascinating to talk to all the other researchers on the ship about what they were seeing, and learn about the ways in which it was different from what they expected to see in May.
Experiencing these different conditions in the Northern California Current has given us a new perspective on an ecosystem that we’ve been observing and studying for years. We’re looking forward to digging into the data and seeing how it can help us understand this ecosystem more deeply, especially during a period of continued climate change.
The total number of each marine mammal species observed during the cruise.
Did you enjoy this blog? Want to learn more about marine life, research, and conservation? Subscribe to our blog and get a weekly message when we post a new blog. Just add your nameand email into the subscribe box below.
This year in late February is the 2022 Ocean Sciences Meeting, an interdisciplinary bonanza of ocean scientists from all over the world. The conference will be held online this year as a precaution against Covid-19, and a week of virtual talks and poster sessions will cover new research in diverse topics from microbial ecology to ocean technology to whale vocalizations.
The meeting will also include my first poster presentation at a major conference, and so I have the typical grad student jitters that accompany each new thing I do (read more about the common experience of “imposter syndrome” here). This poster is the first time since starting graduate school and joining Project OPAL that I’m trying to craft a full science story that connects whales, their prey, and oceanographic conditions.
Learning how to do the analyses to assess and quantify these connections has involved plenty of head-scratching and periodic frustration on my part, but it has also offered a surprisingly joyful and even moving experience. In my efforts to troubleshoot a problem with my prey analysis, I’ve reached out to nearly everyone who works with krill acoustic data on the West Coast. Every single person has been incredibly welcoming and ready to help me, and excited to learn about my work in return. This experience has made me realize how many people I have on my team, and that even strangers are willing to support me on the whacky journey that is a PhD.
Through these collaborations, I am learning to analyze the acoustic signal of krill, small animals that are important food for whales foraging off the coast of Oregon and beyond. As part of Project OPAL, we plan to compare krill swarms with whale survey data to learn about the types of aggregations that whales are drawn to. From the perspective of a hungry whale, not all krill are created equal.
Analysis of a layer of krill in the upper ocean. The blue color in the top panel indicates scattering of acoustic signal by the krill, and the outline in the bottom panel shows the results of an algorithm programmed to detect krill aggregations.
In addition to developing great remote relationships through this work, the ability to meet in person as we continue adapting to life during the pandemic has absolutely not lost its thrill. After over a year of meetings and collaborating on Zoom, I was delighted to meet GEMM Lab postdoc Solène Derville this January, after she journeyed from her home in New Caledonia to Oregon. It was so exciting to see her in real life (we’re more similar in height than I knew!) and a few minutes into our first lunch together she was already helping me refine my analysis plans and think of new approaches.
Our interaction also made me think about how impressive the GEMM Lab is. The first two people Solène saw upon her arrival in Oregon were me and fellow GEMM Lab student Allison Dawn, two newer members who joined the lab after her last trip to Oregon. Without a moment of hesitation, Allison stepped up to give Solène a ride to Newport from Corvallis to finish her long journey. The connection our lab has developed and maintained during a pandemic, across borders and time zones, is special.
Hiking on gorgeous days is just one of the many benefits of being in the same place! This adventure included spotting a whale blow off the coast and a lot of GEMM excitement.
As I look out at the next few weeks until the Ocean Sciences meeting, and out towards the rest of my PhD, I inevitably feel worried about all I need to accomplish. But, I know that the dynamics in our lab and the other collaborative relationships I’m forming are what will carry me through. Every meeting and new connection reminds me that I’m not doing this alone. I’m grateful that there’s a team of people who are ready and willing to help me muddle my way through my first Principal Components Analysis, puzzle over algorithm errors, and celebrate with me as we make progress.
Part of what makes being a graduate student so exciting is the way that learning can flip the world around: you learn a new framework or method, and suddenly everything looks a little different. I am experiencing this fabulous phenomenon lately as I learn to collect and process active acoustic data, which can reveal the distribution and biomass of animals in the ocean – including those favored by foraging whales off of Oregon, like the tiny shrimp-like krill.
We know that whales seek out the dense, energy-rich swarms that krill form, and that knowing where to expect krill can give us a leg up in anticipating whale distributions. Project OPAL (Overlap Predictions About Large whales) seeks to model and provide robust predictions of whale distributions off the coast of Oregon, so that managers can make spatially discrete decisions about potential fishery closures, minimizing burdens to fishermen while also maximizing protection of whales. We hope that including prey in our ecosystem models will help this effort, and working on this aim is one of the big tasks of my PhD.
So, how do we know where to expect krill to be off the coast of Oregon? Acoustic tools give us the opportunity to flip the world upside down: we use a tool called an echosounder to eavesdrop on the ocean, yielding visual outputs like the ones below that let us “see” and interpret sound.
Echograms like these reveal features in the ocean that scatter “pings” of sound, and interpreting these signals can show life in the water column.
This is how it works. The echosounder emits pulses of sound at a known frequency, and then it listens for their return after it bounces of the sea floor or things in the water column. Based on sound experiments in the laboratory, we know to expect our krill species, Euphausia pacifica and Thysanoessa spinifera, to return those echoes at a characteristic decibel level. By constantly “pinging” the water column with this sound, we can record a continuous soundscape along the cruise track of a vessel, and analyze it to identify the animals and features recorded.
I had the opportunity to use an echosounder for the first time recently, on the first HALO cruise. We deployed the echosounder soon after sunrise, 65 miles offshore from Newport. After a little fiddling and troubleshooting, I was thrilled to start “listening” to the water; I was able to see the frothy noise at its surface, the contours of the seafloor, and the pixelated patches that indicate prey in between. Although it’s difficult to definitively identify animals only based on the raw output, we saw swarms that looked like our beloved krill, and other aggregations that suggested hake. Sometimes, at the same time that the team of visual observers on the flying bridge of the vessel sighted whales, I also saw potential prey on the echogram.
I spent much of the HALO cruise monitoring incoming data from the transducer on the SIMRAD EK60. Photo: Marissa Garcia.
I’m excited to keep collecting these data, and grateful that I can also access acoustic data collected by others. Many research vessels use echosounders while they are underway, including the NOAA Ship Bell M. Shimada, which conducts cruises in the Northern California Current several times a year. Starting in 2018, GEMM Lab members have joined these cruises to conduct marine mammal surveys.
This awesome pairing of data types means that we can analyze the prey that was available at the time of marine mammal sightings. I’ve been starting to process acoustic data from past Northern California Current cruises, eavesdropping on the preyscape in places that were jam-packed with whales, such as this echogram from the September 2020 cruise, below.
An echogram from the September 2020 NCC cruise shows a great deal of prey at different depths.
Like a lot of science, listening to animals in the sea comes down to occasional bursts of fieldwork followed by a lot of clicking on a computer screen during data analysis. This analysis can be some pretty fun clicking, though – it’s amazing to watch the echogram unfurl, revealing the preyscape in a swath of ocean. I’m excited to keep clicking, and learn what it can tell us about whale distributions off of Oregon.
By Rachel Kaplan, PhD student, Oregon State University College of Earth, Ocean, and Atmospheric Sciences and Department of Fisheries and Wildlife, Geospatial Ecology of Marine Megafauna Lab
What are the most unexpected things you’ve done on Zoom in the last year? Since the pandemic dramatically changed all our lives in 2020, I think we’ve all been surprised by the diversity of things we’ve done remotely. I’ve baked bagels with a friend in Finland, done oceanography labs from my kitchen, had dance parties with people across the country, and conducted an award ceremony for my family’s Thanksgiving scavenger hunt – all on Zoom. Over the last several months, I’ve also mentored an Undergraduate Research, Scholarship, & the Arts (URSA) Engage student, named Amanda. Although we haven’t met in person yet, we’ve been connecting over Zoom since October.
Amanda is an Ocean Sciences student working with me and Dr. Kim Bernard (CEOAS) to conduct a literature review about the two species of krill found off the coast of Oregon. Thysanoessa spinifera and Euphausia pacifica are an important food source for many of the animals that live off our coast — including blue, humpback, and fin whales. I am trying to learn how krill distributions shape those of humpback and blue whales as part of project OPAL, as well as which oceanographic factors drive krill abundances and distributions.
We’re also interested in T. spinifera and E. pacifica for the crucial roles they serve in ecosystems, beyond providing dinner for whales. Krill do many things that are beneficial to ecosystems and people, termed “ecosystem services.” These include facilitating carbon drawdown from the surface ocean to the deep, supporting lucrative fisheries species like salmon, flatfish, and rockfish, and feeding seabirds like auklets and shearwaters. We want to understand more fully the niche that T. spinifera and E. pacifica each fill off the coast of Oregon, which will help us anticipate how these important animals can be impacted by forces such as global climate change and marine management efforts.
Trying to understand the ecosystem services fulfilled by krill is inherently interdisciplinary, which means we have to learn a lot of new things, making this project a lot of fun. The questions Amanda and I have pursued together have ranged from intensely specific, to surprisingly broad. How many calories do blue whales need to eat in a day? How many krill do salmon need to eat? How big are krill fecal pellets, and how fast do they sink?
Trying to answer these questions has basically amounted to a heroic scouring of the internet’s krillscape by Amanda. She has hunted down papers dating back to the 1960s, pulled together findings from every corner of the world, and pursued what she refers to as “treasure troves” of data. In the process, she has also revealed the holes that exist in the literature, and given us new questions. This is the basis of the scientific process: understanding the current state of knowledge, identifying gaps in that knowledge, and developing the questions and methods needed to fill those gaps.
Euphausia pacifica (source: University of Irvine California, Peter J. Bryant).
Filling in knowledge gaps about T. spinifera and E. pacifica can help us better understand these animals, the ecosystems where they live, and the whales and other animals that depend on them for prey. It’s exciting to know that we will have the opportunity to help fill some of these gaps, as both Amanda and I continue this research over the course of our degrees.
Being able to engage in remote research and mentorship has been really rewarding, and it has shown me how far we’ve all come over the last year. Learning how to work together remotely has been crucial as we have adjusted to the funny new normal of the pandemic. As much as I miss working with people in person, I’ve learned that there’s a lot of great connection to be found even in remote collaboration – I’ve loved meeting Amanda’s pets on Zoom, learning about her career goals, and seeing her incredibly artistic representations of the carbon cycle held up to the camera.
Even though most of our conversations take place on Zoom from our homes, this research still feels plugged into a bigger community. Amanda and I also join Kim’s bigger Zooplankton Ecology Lab meetings, which include two other graduate students and eight undergraduate students, all of whom are working on zooplankton ecology questions that span from the Arctic to the Antarctic. Even though we’ve never met in person, a supportive and curious community has developed among all of us, which I know will persist when we can move back to in-person research and mentorship.
As the largest animals on the planet, blue whales have massive prey requirements to meet energy demands. Despite their enormity, blue whales feed on a tiny but energy-rich prey source: krill. Furthermore, they are air-breathing mammals searching for aggregations of prey in the expansive and deep ocean, and must therefore budget breath-holding and oxygen consumption, the travel time it takes to reach prey patches at depth, the physiological constraints of diving, and the necessary recuperation time at the surface. Additionally, blue whales employ an energetically demanding foraging strategy known as lunge feeding, which is only efficient if they can locate and target dense prey aggregations that compensate for the energetic costs of diving and lunging. In our recent paper, published today in PeerJ, we examine how blue whales in New Zealand optimize their energy use through preferentially feeding on dense krill aggregations near the water’s surface.
Figure 1. A blue whale lunges on a dense aggregation of krill at the surface. Note the krill jumping away from the mouth of the onrushing whale. UAS piloted by Todd Chandler.
Figure 2. Survey tracklines in 2017 in the South Taranaki Bight (STB) with locations of blue whale sightings, and where surface lunge feeding was observed, denoted. Inset map shows location of the STB within New Zealand. Figure reprinted from Torres et al. 2020.
To understand how predators such as blue whales optimize foraging strategies, knowledge of predator behavior and prey distribution is needed. In 2017, we surveyed for blue whales in New Zealand’s South Taranaki Bight region (STB, Fig. 2) while simultaneously collecting prey distribution data using an echosounder, which allowed us to identify the location, depth, and density of krill aggregations throughout the region. When blue whales were located, we observed their behavior from the research vessel, recorded their dive times, and used an unmanned aerial system (UAS; “drone”) to assess their body condition and behavior.
Much of what is known about blue whale foraging behavior and energetics comes from extensive studies off the coast of California, USA using accelerometer tags to track fine-scale kinematics (i.e., body movements) of the whales. In the California Current, the krill species targeted by blue whales are denser at depth, and therefore blue whales regularly dive to depths of 300 meters to lunge on the most energy-rich prey aggregations. However, given the reduced energetic costs of feeding closer to the surface, optimal foraging theory predicts that blue whales should only forage at depth when the energetic gain outweighs the cost. In New Zealand, we found that blue whales foraged where krill aggregations were relatively shallow and dense compared to the availability of krill across the whole study area (Fig. 3). Their dive times were quite short (~2.5 minutes, compared to ~10 minutes in California), and became even shorter in locations where foraging behavior and surface lunge feeding were observed.
Figure 3. Density contours comparing the depth and density (Sv) of krill aggregations at blue whale foraging sightings (red shading) and in absence of blue whales (gray shading). Density contours: 25% = darkest shade, 755 = medium shade, 95% = light shade. Blue circles indicate krill aggregations detected within 2 km of the sighting of the UAS filmed surface foraging whale analyzed in this study. Figure reprinted from Torres et al. 2020.
Figure 4. Kinematics of a blue whale foraging dive derived from a suction cup tag. Upper panel shows the dive profile (yellow line), with lunges highlighted (green circles), superimposed on a prey field map showing qualitative changes in krill density (white, low; blue, medium; red, high). The lower panels show the detailed kinematics during lunges at depth. Here, the dive profile is shown by a black line. The orange line shows fluking strokes derived from the accelerometer data, the green line represents speed estimated from flow noise, and the grey circles indicate the speed calculated from the vertical velocity of the body divided by the sine of the body pitch angle, which is shown by the red line. Figure and caption reprinted from Goldbogen et al. 2011.
Describing whale foraging behavior and prey in the surface waters has been difficult due to logistical limitations of conventional data collection methods, such as challenges inferring surface behavior from tag data and quantifying echosounder backscatter data in surface waters. To compliment these existing methods and fill the knowledge gap surrounding surface behavior, we highlight the utility of a different technological tool: UAS. By analyzing video footage of a surface lunge feeding sequence, we obtained estimates of the whale’s speed, acceleration, roll angle, and head inclination, producing a figure comparable to what is typically obtained from accelerometer tag data (Fig. 4, Fig. 5). Furthermore, the aerial perspective provided by the UAS provides an unprecedented look at predator-prey interactions between blue whales and krill. As the whale approaches the krill patch, she first observes the patch with her right eye, then turns and lines up her attack angle to engulf almost the entire prey patch through her lunge. Furthermore, we can pinpoint the moment when the krill recognize the impending danger of the oncoming predator—at a distance of 2 meters, and 0.8 seconds before the whale strikes the patch, the krill show a flee response where they leap away from the whale’s mouth (see video, below).
Figure 5. Body kinematics during blue whale surface lunge feeding event derived from Unmanned Aerial Systems (UAS) image analysis. (A) Mean head inclination and roll (with CV in shaded areas), (B) relative speed and acceleration, and (C) distance from the tip of the whale’s rostrum to the nearest edge of krill patch. Blue line on plots indicate when krill first respond to the predation event, and the purple dashed lines indicate strike at time = 0. The orange lines indicate the time at which the whale’s gape is widest, head inclination is maximum, and deceleration is greatest. Figure reprinted from Torres et al. 2020
In this study, we demonstrate that surface waters provide important foraging opportunities and play a key role in the ecology of New Zealand blue whales. The use of UAS technology could be a valuable and complimentary tool to other technological approaches, such as tagging, to gain a comprehensive understanding of foraging behavior in whales.
To see the spectacle of a blue whale surface lunge feeding, we invite you to take a look at the video footage, below:
The publication is led by GEMM Lab Principal Investigator Dr. Leigh Torres. I led the prey data analysis portion of the study, and co-authors include our drone pilot extraordinaire Todd Chandler and UAS analysis guru Dr. Jonathan Burnett. We are grateful to all who assisted with fieldwork and data collection, including Kristin Hodge, Callum Lilley, Mike Ogle, and the crew of the R/V Star Keys (Western Workboats, Ltd.). Funding for this research was provided by The Aotearoa Foundation, The New Zealand Department of Conservation, The Marine Mammal Institute at Oregon State University, Greenpeace New Zealand, OceanCare, Kiwis Against Seabed Mining, The International Fund for Animal Welfare, and The Thorpe Foundation.
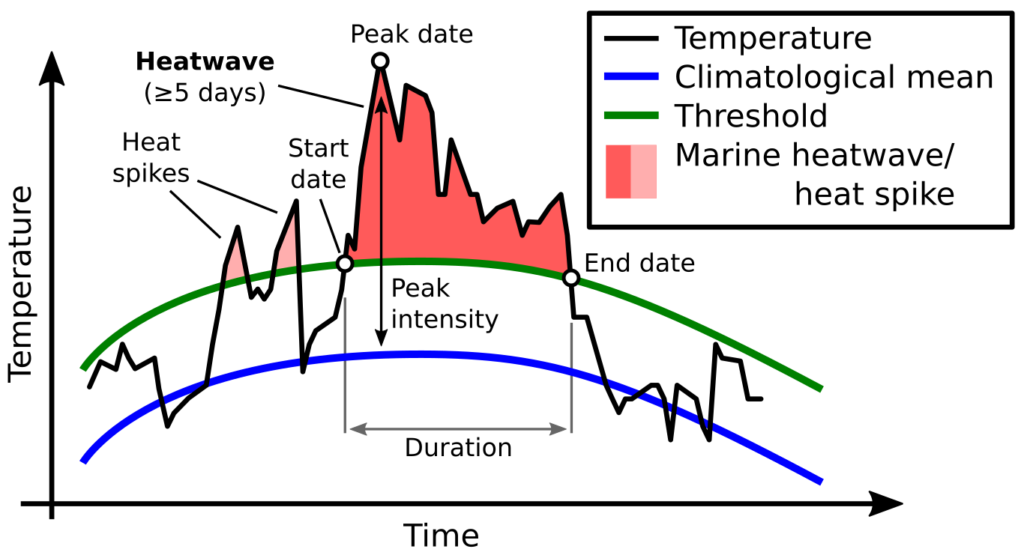
In recent years, anomalously warm ocean temperatures known as “marine heatwaves” have sparked considerable attention and concern around the world. Marine heatwaves (MHW) occur when seawater temperatures rise above a seasonal threshold (greater than the 90th percentile) for five consecutive days or longer (Hobday et al. 2016; Fig. 1). With global ocean temperatures continuing to rise, we are likely to see more frequent and more intense MHW conditions in the future. Indeed, the global prevalence of MHWs is increasing, with a 34% rise in frequency, a 17% increase in duration, and a 54% increase in annual MHW days globally since 1925 (Oliver et al. 2018). With sustained anomalously warm water temperatures come a range of ecological, sociological, and economic consequences. These impacts include changes in water column structure, primary production, species composition, marine life distribution and health, and fisheries management including closures and quota changes (Oliver et al. 2018).
Figure 1. Illustration of how marine heatwaves are defined. Source: marineheatwaves.org
The notorious “warm blob” was an MHW event that plagued the northeast Pacific Ocean from 2014-2016. Some of the most notable consequences of this MHW were extremely high levels of domoic acid, extreme changes in the biodiversity of pelagic species, and an unprecedented delay in the opening of the Dungeness crab fishery, which is an important and lucrative fishery for the West Coast of the United States (Santora et al. 2020). The “warm blob” directly impacted the California Current ecosystem, which is typically a highly productive coastal area driven by seasonal upwelling. Yet, as a consequence of the 2014-2016 MHW, upwelling habitat was compressed and constricted to the coastal boundary, resulting in a contraction in available habitat for humpback whales and a shift in their prey (Santora et al. 2020; Fig. 2).
Figure 2. A figure from Santora et al. 2020 illustrating the compression in available upwelling habitat, defined by areas with SST<12°C (delineated by the black line), during the 2014-2016 marine heatwave in the California Current ecosystem.
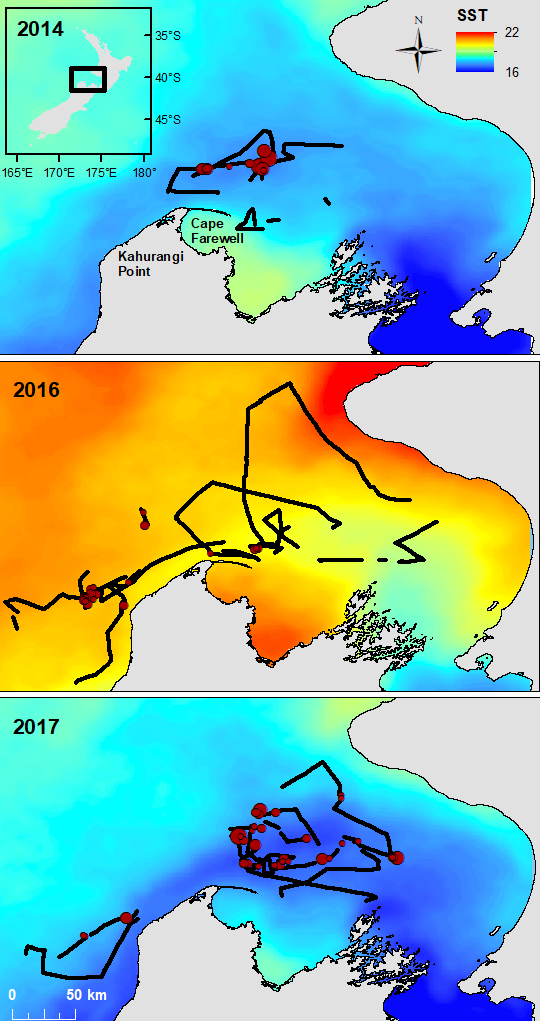
Shifting to an example from another part of the world, the austral summer of 2015-2016 coincided with a strong regional MHW in the Tasman Sea between Australia and New Zealand, which lasted for 251 days and had a maximum intensity of 2.9°C above the climatological average (Oliver et al. 2017). Subsequently, the conditions were linked to a significant shift in zooplankton species composition and abundance in Australia (Evans et al. 2020). Ocean warming, including MHWs, also appears to decrease primary production in the Tasman Sea and large portions of New Zealand’s marine ecosystem (Chiswell & Sutton 2020). In New Zealand’s South Taranaki Bight region, where we study the ecology of blue whales, we observed a shift in blue whale distribution in the MWH conditions of February 2016 relative to more typical ocean conditions in 2014 and 2017 (Fig. 3). The first chapter of my dissertation includes a detailed analysis of the impacts of the 2016 MHW on New Zealand oceanography, krill, and blue whales, documenting how the warm, stratified water column of 2016 led to consequences across multiple trophic levels, from phytoplankton, to zooplankton, to whales.
Figure 3. Maps showing monthly sea surface temperature (SST) in the South Taranaki Bight region of New Zealand during our three years of survey effort to document blue whale distribution (February 2014, 2016, and 2017). Vessel tracklines are shown in black, with blue whale sighting locations shown in dark red. Red circles are scaled by the number of blue whales observed at each sighting. The color ramp of SST values is consistent across the three maps, making the dramatically warmer ocean conditions of 2016 evident.
The response of marine mammals is tightly linked to shifts in their environment and prey (Silber et al. 2017). With MHWs and changing ocean conditions, there will likely be “winners” and “losers” among marine predators including large whales. Blue whales are highly selective krill specialists (Nickels et al. 2019), whereas other species of whales, such as humpback whales, have evolved flexible feeding tactics that allow them to switch target prey species when needed (Cade et al. 2020). In California, humpback whales have been shown to switch their primary prey from krill to fish during warm years (Fossette et al. 2017, Santora et al. 2020). By contrast, blue whales shift their distribution in response to changing krill availability during warm years (Fossette et al. 2017), however this strategy comes with increased risk and energetic cost associated with searching for prey in new areas. Furthermore, in instances when a prey resource such as krill becomes increasingly scarce for a multi-year period (Santora et al. 2020), krill specialist predators such as blue whales are at a considerable disadvantage. It is also important to acknowledge that although the humpbacks in California may at first seem to have a winning strategy for adaptation by switching their food source, this tactic may come with unforeseen consequences. Their distribution overlapped substantially with Dungeness crab fishing gear during MHW conditions in the warm blob years, resulting in record numbers of entanglements that may have population-level repercussions (Santora et al. 2020).
While this is certainly not the most light-hearted blog
topic, I believe it is an important one. As warming ocean temperatures
contribute to the increase in frequency, intensity, and duration of extreme
conditions such as MHW events, it is paramount that we understand their impacts
and take informed management actions to mitigate consequences, such as lethal
entanglements as a result of compressed whale habitat. But perhaps more
importantly, even as we do our best to manage consequences, it is critical that
we as individuals realize the role we have to play in reducing the root cause
of warming oceans, by being conscious consumers and being mindful of the impact
our actions have on the climate.
References
Cade DE, Carey N, Domenici P, Potvin J, Goldbogen JA (2020) Predator-informed looming stimulus experiments reveal how large filter feeding whales capture highly maneuverable forage fish. Proc Natl Acad Sci USA.
Chiswell SM, Sutton PJH
(2020) Relationships between long-term ocean warming, marine heat waves and
primary production in the New Zealand region. New Zeal J Mar Freshw Res.
Evans R, Lea MA, Hindell
MA, Swadling KM (2020) Significant shifts in coastal zooplankton populations
through the 2015/16 Tasman Sea marine heatwave. Estuar Coast Shelf Sci.
Fossette S, Abrahms B,
Hazen EL, Bograd SJ, Zilliacus KM, Calambokidis J, Burrows JA, Goldbogen JA,
Harvey JT, Marinovic B, Tershy B, Croll DA (2017) Resource partitioning
facilitates coexistence in sympatric cetaceans in the California Current. Ecol
Evol.
Hobday AJ, Alexander L
V., Perkins SE, Smale DA, Straub SC, Oliver ECJ, Benthuysen JA, Burrows MT,
Donat MG, Feng M, Holbrook NJ, Moore PJ, Scannell HA, Sen Gupta A, Wernberg T
(2016) A hierarchical approach to defining marine heatwaves. Prog Oceanogr.
Nickels CF, Sala LM,
Ohman MD (2019) The euphausiid prey field for blue whales around a steep
bathymetric feature in the southern California current system. Limnol Oceanogr.
Oliver ECJ, Benthuysen
JA, Bindoff NL, Hobday AJ, Holbrook NJ, Mundy CN, Perkins-Kirkpatrick SE (2017)
The unprecedented 2015/16 Tasman Sea marine heatwave. Nat Commun.
Oliver ECJ, Donat MG,
Burrows MT, Moore PJ, Smale DA, Alexander L V., Benthuysen JA, Feng M, Sen
Gupta A, Hobday AJ, Holbrook NJ, Perkins-Kirkpatrick SE, Scannell HA, Straub
SC, Wernberg T (2018) Longer and more frequent marine heatwaves over the past
century. Nat Commun.
Santora JA, Mantua NJ,
Schroeder ID, Field JC, Hazen EL, Bograd SJ, Sydeman WJ, Wells BK, Calambokidis
J, Saez L, Lawson D, Forney KA (2020) Habitat compression and ecosystem shifts
as potential links between marine heatwave and record whale entanglements. Nat
Commun.
Silber GK, Lettrich MD,
Thomas PO, Baker JD, Baumgartner M, Becker EA, Boveng P, Dick DM, Fiechter J,
Forcada J, Forney KA, Griffis RB, Hare JA, Hobday AJ, Howell D, Laidre KL,
Mantua N, Quakenbush L, Santora JA, Stafford KM, Spencer P, Stock C, Sydeman W,
Van Houtan K, Waples RS (2017) Projecting marine mammal distribution in a
changing climate. Front Mar Sci.
I have the privilege of studying the largest animals on the planet: blue whales (Balaenoptera musculus). However, in order to understand the ecology, distribution, and habitat use patterns of these ocean giants, I have dedicated the past several months to studying something much smaller: krill (Nyctiphanes australis). New Zealand’s South Taranaki Bight region (“STB”, Figure 1) is an important foraging ground for a unique population of blue whales [1,2]. A wind-driven upwelling system off of Kahurangi Point (the “X” in Figure 1) generates productivity in the region [3], leading to an abundance of krill [4], the desired blue whale prey [5].
Figure 1. A map of New Zealand, with the South Taranaki Bight (STB) region delineated by the black box. Cape Farewell is denoted by a star, and Kahurangi point is denoted by an X.
Figure 4. A blue whale lunges on an aggregation of krill. UAS piloted by Todd Chandler.
Krill (Nyctiphanes australis), blue whale prey in New Zealand’s South Taranaki Bight region. Image: Te Papa.
Our blue whale research team collected a multitude of datastreams in three different years, including hydroacoustic data to map krill distribution throughout our study region. The summers of 2014 and 2017 were characterized by what could be considered “typical” conditions: A plume of cold, upwelled water curving its way around Cape Farewell (marked with the star in Figure 1) and entering the South Taranaki Bight, spurring a cascade of productivity in the region. The 2016 season, however, was different. The surface water temperatures were hot, and the whales were not where we expected to find them.
Figure 2. Sea surface temperature maps of the South Taranaki Bight region in each of our three study years. The white circles indicate where most blue whale sightings were made in each year. Note the very warm temperatures in 2016, and more westerly location of blue whale sightings.
What happened to the blue whales’ food source under these different conditions in 2016? Before I share some preliminary findings from my recent analyses, it is important to note that there are many possible ways to measure krill availability. For example, the number of krill aggregations, as well as how deep, thick, and dense those aggregations are in an area will all factor into how “desirable” krill patches are to a blue whale. While there may not be “more” or “less” krill from one year to the next, it may be more or less accessible to a blue whale due to energetic costs of capturing it. Here is a taste of what I’ve found so far:
In 2016, when surface waters were warm, the krill aggregations were significantly deeper than in the “typical” years (ANOVA, F=7.94, p <0.001):
Figute 3. Boxplots comparing the median krill aggregation depth in each of our three survey years.
The number of aggregations was not significantly different between years, but as you can see in the plot below (Figure 4) the krill were distributed differently in space:
Figure 4. Map of the South Taranaki Bight region with the number of aggregations per 4 km^2, standardized by vessel survey effort. The darker colors represent areas with a higher density of krill aggregations.
While the bulk of the krill aggregations were located north of Cape Farewell under typical conditions (2014 and 2017), in the warm year (2016) the krill were not in this area. Rather, the area with the most aggregations was offshore, in the western portion of our study region. Now, take a look at the same figure, overlaid with our blue whale sighting locations:
Figure 5. Map of standardized number of krill aggregations, overlaid with blue whale sighting locations in red stars.
Where did we find the whales? In each year, most whale encounters were in the locations where the most krill aggregations were found! Not only that, but in 2016 the whales responded to the difference in krill distribution by shifting their distribution patterns so that they were virtually absent north of Cape Farewell, where most sightings were made in the typical years.
The above figures demonstrate the importance of studying an ecosystem. We could puzzle and speculate over why the blue whales were further west in the warm year, but the story that is emerging in the krill data may be a key link in our understanding of how the ecosystem responds to warm conditions. While the focus of my dissertation research is blue whales, they do not live in isolation. It is through understanding the ecosystem-scale story that we can better understand blue whale ecology in the STB. As I continue modeling the relationships between oceanography, krill, and blue whales in warm and typical years, we are beginning to scratch the surface of how blue whales may be responding to their environment.
Torres LG. 2013 Evidence for an unrecognised blue whale foraging ground in New Zealand. New Zeal. J. Mar. Freshw. Res.47, 235–248. (doi:10.1080/00288330.2013.773919)
Barlow DR et al. 2018 Documentation of a New Zealand blue whale population based on multiple lines of evidence. Endanger. Species Res.36, 27–40. (doi:https://doi.org/10.3354/esr00891)
Shirtcliffe TGL, Moore MI, Cole AG, Viner AB, Baldwin R, Chapman B. 1990 Dynamics of the Cape Farewell upwelling plume, New Zealand. New Zeal. J. Mar. Freshw. Res.24, 555–568. (doi:10.1080/00288330.1990.9516446)
Bradford-Grieve JM, Murdoch RC, Chapman BE. 1993 Composition of macrozooplankton assemblages associated with the formation and decay of pulses within an upwelling plume in greater cook strait, New Zealand. New Zeal. J. Mar. Freshw. Res.27, 1–22. (doi:10.1080/00288330.1993.9516541)
Gill P. 2002 A blue whale (Balaenoptera musculus) feeding ground in a southern Australian coastal upwelling zone. J. Cetacean Res. Manag.4, 179–184.