….aaaand we’re off! The blue whale team heads to New Zealand

By Dawn Barlow, MSc Student, Geospatial Ecology of Marine Megafauna Lab, Department of Fisheries and Wildlife, Oregon State University

Today we are flying to the other side of the world and boarding a 63-foot boat to study the largest animals ever to have inhabited this planet: blue whales (Balaenoptera musculus). Why do we study them, and how will we do it? Before I tell you, first let me say that no fieldwork is ever straightforward, and consequently no fieldwork lacks exciting learning opportunities. I have learned a lot about the logistics of an international field season in the past month, which I will share with you here!

The South Taranaki Bight, which lies between the north and south islands of New Zealand, is the study area for this survey.
Research vessel Star Keys will be our home for the month of February as we look for whales.

Unmanned aerial systems (UAS, a.k.a. “drones”) are becoming more prevalent in our field as a powerful and minimally invasive tool for studying marine mammals. Last year, our team was able to capture what we believe is the first aerial footage of nursing behavior in baleen whales, in addition to feeding and traveling behaviors. And beyond behavior, these aerial images contain morphological and physiological information about the whales such as how big they are, whether they are pregnant or lactating, and if they are in good health. I’ll start making a packing list for you to follow along with. So far it contains two drones and all of their battery supplies and chargers.

Aerial image of a blue whale mother and calf captured by a drone during the 2016 field season.

Perhaps you read my first GEMM Lab blog post, about identifying individual blue whales from photographs? Using these individual IDs, I plan to generate an abundance estimate for this blue whale population, as well as look at residency and movement patterns of individuals. Needless to say, we will be collecting photo-ID images this year as well! Add two large pelican cases with cameras and long lenses to the packing list.

Blue whale photo-ID image, showing the left and right sides of the same whale. I have identified 99 unique individuals so far, and look forward to adding to our catalog this year!

Now wouldn’t it be great to capture video of animal behavior in some way other than with the UAS? Maybe even from underwater? Add two GoPros and all of their associated paraphernalia to the mounting gear pile.

Now, bear with me. There is a wealth of physiological information contained in blue whale fecal matter. And when hormone analysis from fecal samples is paired with photogrammetry from UAS images, we can develop a valuable picture of individual and population-level health, stress, nutrition, and reproductive status. So, say we are able to scoop up lots of blue whale fecal samples – wouldn’t that be fantastic? Yes! Alright, add two nets, a multitude of jars, squirt bottles, and gloves to the gear list. And then we still need to bring them back to our lab here in Newport. How does that happen? Well, we need to filter out the sea water, transfer the samples to smaller tubes, and freeze them… in the field, on a moving vessel. Include beakers, funnels, spatulas, and centrifuge tubes on the list. Yes, we will be flying back with a Styrofoam cooler full of blue whale “poopsicles”. Of course, we need a cooler!

Alright, and now remember the biopsy sampling that took place last season? Collecting tissue samples allows us to assess the genetic structure of this population, their stable isotopic trophic feeding level, and hormone levels. Well, we are prepared to collect tissue samples once again! Remember to bring small tubes and scalpel blades for storing the samples, and to get ethanol when we arrive in Wellington.

An important piece in investigating the habitat of a marine predator is learning about the prey they are consuming. In the case of our blue whales, this prey is krill (Nyctiphanes australis). We study the prey layer with an echo sounder, which sends out high frequency pings that bounce off anything they come in contact with. From the strength of the signal that bounces back it is possible to tell what the composition of the prey layer is, and how dense. The Marine Mammal Institute here at OSU has an echo sounder, and with the help of colleagues and collaborators, positive attitudes, and perseverance, we successfully got the transducer to communicate with the receiver, and the receiver to communicate with the software, and the software to communicate with the GPS.  Add one large pelican case for the receiver. Can we fit the transducer in there as well? Hmmm, this is going to be heavy…

Blue whale team members and colleagues troubleshoot and test the Simrad EK60 echo sounder before packing it to take to New Zealand.

Now the daunting, ever-growing to-do lists have been checked off and re-written and changed and checked off again. The mountain of research gear has been evaluated and packed and unpacked and moved and re-evaluated and packed again. The countdown to our departure date has ended, and this evening Leigh, Todd, and I fly out of Portland and make our way to Wellington, New Zealand. To think that from here all will be smooth and flawless is naïve, but not being able to contain my excitement seems reasonable. Maybe it’s the lack of sleep, but more likely it’s the dreams coming true for a marine ecologist who loves nothing more than to be at sea with the wind in her face, looking for whales and creatively tackling fieldwork challenges.

In the midst of the flurry of preparations, it can be easy to lose sight of why we are doing this—why we are worrying ourselves over poopsicle transport and customs forms and endless pelican cases of valuable equipment for the purpose of spending several weeks on a vessel we haven’t yet set foot on when we can’t even guarantee that we’ll find whales at all. This area where we will work (Figure 1) is New Zealand’s most industrially active region, where endangered whales share the space with oil rigs, shipping vessels, and seismic survey vessels that have been active since October in search of more oil and gas reserves. It is a place where we have the opportunity to study how these majestic giants fit into this ecosystem, to learn what about this habitat is driving the presence of the whales and how they’re using the space relative to industry. It is an opportunity for me as a scientist to pursue questions in ecology—the field of study that I love. It is also an opportunity for me as a conservation advocate to find my voice on issues of industry presence, resource extraction, and conflicts over ocean spaces that extend far beyond one endangered species and one region of the world.

Fieldwork preparations have made clear to me once again the strength and importance of collaboration in science. Kim Bernard from OSU’s College of Earth, Ocean, and Atmospheric Sciences and Craig Hayslip from the Marine Mammal Institute’s Whale Telemetry Group spent half a day troubleshooting the echosounder with us. Western Work Boats has manufactured a pole mount for the echosounder transducer, and Kristin Hodge is joining us from Cornell University’s Bioacoustics Research Program to assist with data collection. Callum Lilley and Mike Ogle from the New Zealand Department of Conservation will join us in Wellington to collect the biopsy samples, and Rochelle Constantine and Scott Baker will facilitate the archiving and transport of the tissue samples back to Newport for analysis. Scientific colleagues at NIWA will collaborate on oceanographic aspects and conduct stable isotope analysis of tissue samples. We are also grateful to the indispensable logistical support from Kathy Minta and Minda Stiles in the OSU Marine Mammal Institute. And, of course we could not do any of this work without the generous funding support from The Aotearoa Foundation, The New Zealand Department of Conservation, Greenpeace Aotearoa New Zealand, OceanCare, The International Fund for Animal Welfare Oceanea Office, Kiwis Against Seabed Mining, the OSU Marine Mammal Institute, and the Thorpe Foundation. Our science is stronger when we pool our energy and expertise, and I am thrilled to be working with this great group of people.

Stay tuned, the next several blogs will be posted from the field by the New Zealand blue whale team!

How we craft our messages

By: Erin Pickett, MSc

Communicating science has become more important than ever as major social and political issues, such as climate change, require increasing input from scientists. In a recent article published by the Proceedings of the National Academy of Science, a research group from the University of Cologne in Cologne, Germany, explores how social cognition influences our ability to market science.

This article, titled “Past-focused environmental comparisons promote pro-environmental outcomes for conservatives” focuses specifically on understanding why there is a political divide in the United States regarding the issue of climate change (Baldwin & Lammers 2016). While our research in the GEMM lab focuses on spatial ecology (rather than social science) I thought this article was worth sharing because of its insights about “framing science”. The conservation science that we conduct in the GEMM lab will not be effective if we cannot properly communicate our objectives and our findings to funders and stakeholders.

“Framing” is a term in psychology that describes how you craft a message based on your intended audience. It is important to note that use of the term framing (or marketing) science doesn’t imply misrepresentation of facts (Nisbet & Mooney 2007). Rather,“Frames organize central ideas, defining a controversy to resonate with core values and assumptions” (Nisbet & Mooney 2007). Baldwin & Lammers (2016) demonstrated that subtle differences in framing significantly affect how environmental messages are perceived. These authors investigated the effect of framing with regards to temporal comparisons, environmental attitudes and behavior.

The specific problem these authors address is the failure of climate change advocates to bridge the political divide between liberals and conservatives in the United States. The authors hypothesize that the temporal comparisons used in arguments for action on climate change explain the dichotomy between liberal and conservative views on this issue (which garners less support from conservatives).

The primary hypothesis guiding this study is that conservatives are more likely to favor a “past-focused” message rather than a “future-focused” message about climate change. The authors surmise that this framing bias is rooted in a conservative ideology that favors past traditions over a progressive future, which is more favored by liberals. Many pro-environmental arguments and appeals to address climate change are future focused, e.g. Balwin & Lemmers (2016) quote UN Secretary-General Ban-Ki Moon, speaking about climate change:

“…We need to find a new, sustainable path to the future we want”.

If temporal comparisons do elicit framing bias, then our framing of the issue of climate change, and possibly other environmental issues, could be more effective if presented to conservatives as past-focused messages.

The authors tested these hypotheses on participants in a series of online studies. You can find more details on methods in the papers supporting information found here. In the first three studies, the authors investigated the effect of temporal comparisons on pro-environmental beliefs. Study participants were asked to read messages, or view images, that addressed the issue of climate change by comparing the present to the past, or the present to the future. Following these comparisons, participants ranked their pro-environmental attitudes. Examples of these comparisons were statements such as, “Looking forward to our Nation’s future… there is increasing traffic on the road” (future-focused), and, “Looking back to our Nation’s past…there was less traffic on the road” (past-focused).

You can see examples of past and future-focused images below.

Images of past, present and future conditions (Baldwin & Leemers 2016-Supporting information Fig. S1)

The authors found significant evidence to support their hypothesis that presenting conservatives with past-focused messages is more effective in terms of promoting pro-environmental messages than presenting future-focused messages. Temporal comparisons did not affect the pro-environmental attitudes of liberals.

Liberals pro-environmental attitudes remain similar between conditions, while conservatives pro-environmental attitude is higher given a past-focused condition (Baldwin & Lammers 2016, Fig. 2)

The authors also investigated the temporal focus of environmental organizations and found that overall, environmental charities promote future-focused messages. Study participants were allotted small amounts of cash to donate to these charities, and conservatives gave more to past-focused charities than to future-focused charities. You can see examples of charities with differing temporal focuses below.

Examples of future and past-focused environmental charities (Balwin & Lammers 2016-supporting information Fig. S3)

In a final meta-analysis, these authors found that employing past-focused comparisons nearly made up for the difference between liberals and conservatives in terms of their pro-environmental attitudes. The implication of these findings is that we can improve the way we communicate about controversial issues such as climate change by subtly altering our arguments. For example, in one study that was cited by Baldwin & Lammers (2016), conservatives favored the words ‘purity’ and ‘sanctity’ over ‘harm’ and ‘care’ (Fienberg & Willer 2012). Based on these studies, an example of an effective message for a conservative audience would be, “It is important that we restore the Earth because it has become contaminated”.

These findings could be true for other environmental issues as well, and so it is worth thinking critically about how to craft messages about our scientific findings for our intended audiences. We need to carefully frame our messages whether we are writing grant proposals, peer-reviewed manuscripts, press releases, or posts intended for social media.

I originally discovered this paper after listening to a short radio interview that was conducted by CBC Radio, and if you are interested in this research I encourage you to check it out! You can following this link: how to convince a climate change skeptic.

References:

Baldwin, M., & Lammers, J. (2016). Past-focused environmental comparisons promote proenvironmental outcomes for conservatives. Proceedings of the National Academy of Sciences113(52), 14953-14957.

Feinberg, M., & Willer, R. (2013). The moral roots of environmental attitudes. Psychological Science24(1), 56-62.

Nisbet, M. C., & Mooney, C. (2009). Framing science. Science316.

GEMM Lab 2016: A Year in the Life

By Dawn Barlow, MSc Student, Department of Fisheries and Wildlife, Oregon State University

The year is rapidly coming to a close, and what a busy year it has been in the Geospatial Ecology of Marine Megafauna Lab! In 2016, our members have traveled to six continents for work (all seven if we can carry Rachael’s South African conference over from the end of 2015…), led field seasons in polar, temperate, and tropical waters, presented at international conferences, processed and analyzed data, and published results. Now winter finds us holed up in our offices in Newport, and various projects are ramping up and winding down. With all of the recent turmoil 2016 has brought, it is a nice to reflect on the good work that was accomplished over the last 12 months. In writing this, I am reminded of how grateful I am to work with this talented group of people!

The year started with a flurry of field activity from our southern hemisphere projects! Erin spent her second season on the Antarctic peninsula, where she contributed to the Palmer Station Long Term Ecological Research Project.

Erin collecting a crabeater seal scat sample.
Erin in action collecting a crabeater seal scat sample along the West Antarctic Peninsula.


Aerial image of the research vessel and a pair of blue whales during the 2016 New Zealand survey.

The New Zealand blue whale project launched a comprehensive field effort in January and February, and it was a fruitful season to say the least. The team deployed hydrophones, collected tissue biopsy and fecal samples, and observed whales feeding, racing and nursing. The data collected by the blue whale team is currently being analyzed to aid in conservation efforts of these endangered animals living in the constant presence of the oil and gas industry.

Midway atoll is home to one of the largest albatross colony in the world, and Rachael visited during the winter breeding season. In addition to deploying tracking devices to study flight heights and potential conflict with wind energy development, she became acutely aware of the hazards facing these birds, including egg predation by mice and the consumption of plastic debris.

Laysan albatross equipped with a GPS data logger.
Fledgling from last year with a stomach full of plastic.

Early summertime brought red-legged kittiwakes to the remote Pribilof Islands in Alaska to nest, and Rachael met them there to study their physiology and behavior.

Rachael with a noosepole on St. George Island, Alaska
Solene with Dr. Claire Garrigue during fieldwork at the Chesterfield Reefs, New Caledonia.

As the weather warmed for us in the northern hemisphere, Solene spent the austral winter with the humpback whales on their breeding grounds in New Caledonia. Her team traveled to the Chesterfield Reefs, where they collected tissue biopsy samples and photo-IDs, and recorded the whale’s songs. But Solene studies far more than just these whales! She is thoroughly examining every piece of environmental, physical, and oceanographic data she can get her hands on in an effort to build a thorough model of humpback whale distribution and habitat use.

A humpback whale in New Caledonia's South Lagoon.
A humpback whale in New Caledonia’s South Lagoon.

Summertime came to Oregon, and the gray whales returned to these coastal waters. Leigh, Leila, and Todd launched into fieldwork on the gray whale stress physiology project. The poop-scooping, drone-flying team has gotten a fair bit of press recently, follow this link to listen to more!

The overhead drone captures a pair of gray whales surfacing between kelp beds off Cape Blanco, Oregon, with the research vessel nearby. Take under NOAA/NMFS permit #16111 given to John Calambokidis.

And while Leigh, Leila, and Todd followed the grays from the water, Florence and her team watched them from shore in Port Orford, tracking their movement and behavior. In an effort to gain a better understanding of the foraging ecology of these whales, Florence and crew also sampled their mysid prey from a trusty research kayak.

13
Florence and the summer 2016 gray whale field team.
DSCF0758
Kelli Iddings sampling mysid near Port Orford.

With the influx of gray whales came an influx of new and visiting GEMM Lab members, as Florence’s team of interns joined for the summer season. I was lucky enough to join this group as the lab’s newest graduate student!

All summer 2016 GEMM Lab members.
All of the summer 2016 GEMM Lab members.

Our members have presented their work to audiences far and wide. This summer Leigh, Amanda, and Florence attended the International Marine Conservation Congress, and Amanda was awarded runner-up for the best student presentation award! Erin traveled to Malaysia for the Scientific Convention on Antarctic Research, and Rachael and Leigh presented at the International Albatross and Petrel Conference in Barcelona. With assistance from Florence and Amanda, Leigh led an offshore expedition on OSU’s research vessel R/V Oceanus to teach high school students and teachers about the marine environment.

Amanda with her award!
Science Party musters in the dry lab for safety debrief aboard R/V Oceanus.

Courtney fledged from the GEMM Lab nest before 2016 began, but the work she did while here was published in Marine Mammal Science this year. Congrats Courtney! And speaking of publications, additional congratulations to Solene for her publication in Marine Ecology Progress Series, Rachael for her four publications this year in PLOS ONE, Marine Ecology Progress Series, Marine Ornithology, and the Journal of Experimental Biology, and Leigh for her five publications this year in Polar Biology, Diversity and Distributions, Marine Ecology Progress Series, and Marine Mammal Science!

Wintertime in Newport has us tucked away indoors with our computers, cranking through analyses and writing, and dreaming about boats, islands, seabirds, and whales… Solene visited from the South Pacific this fall, and graced us with her presence and her coding expertise. It is a wonderful thing to have labmates to share ideas, frustrations, and accomplishments with.

No heat in the lab can't stop us from solving a coding problem together on a wintery evening!
Solving a coding problem together on a wintery evening.

As the year comes to a close, we have two newly-minted Masters of Science! Congratulations to Amanda and Erin on successfully defending their theses, and stay tuned for their upcoming publications!

Amanda's post-defense celebration!
Amanda’s post-defense celebration!
Erin's post-defense celebration!
Erin’s post-defense celebration!

We are looking forward to what 2017 brings for this team of marine megafauna enthusiasts. Happy holidays from the GEMM Lab!

Happy GEMM Lab members.
Happy GEMM Lab members, enjoying one another’s company and playing Evolution.

Good news: You are Brilliant, the Earth is Hiring

By: Erin Pickett, M.S. Student, Oregon State University

GEMM lab UPDATE: Amanda Holdman successfully defended her master’s thesis this week!

Amanda wisely planned her defense date for November 7th, 2016, the day before Election Day. As I anxiously watched the New York Times election forecast needle bounce back and forth, from left to right on Election night, I thought to myself, why didn’t I think of that? If you are unfamiliar with what I am talking about, this “forecast needle” was an animated graphic on the NYT website that bounced constantly all night between the two Presidential candidates. It caused a great deal of unease for those of us that found it difficult to look away. The animation sparked some debate online among bloggers and tweeters, my favorite comment being, “it borders on irresponsible data visualization”. I came to the realization pretty quickly on Tuesday night that despite the outcome of the election, I would still need to turn in my thesis the following week.

Personally, I did not feel motivated to get out of bed on Wednesday. I wasn’t feeling inspired, or overcome with positive thoughts about what my day of thesis writing would bring. Thankfully, here at OSU, we graduate students have good leaders to keep us on track. Wednesday afternoon, we received an encouraging email from our Department Head, Dr. Selina Heppell. I took away two important points from this email. The first: stay positive, and remember that we do great work with great people and that our work matters. Secondly, think about the lessons that we have learned from this election. For those of us that were shocked about who our country has chosen as the next President of the United States, one important lesson is that we need to focus more on engaging people who exist outside of the echo chambers of our scientific communities.

The recent election has left many scientists and environmentalists concerned about what the future political climate will bring in terms of research funding, job opportunities, and environmental protection. More so now than ever it is important to remain positive and hopeful, and to reconsider the way we communicate our research and engage outside communities whose views are unlike our own. Both of these tasks are particularly challenging due to the long list of environmental problems we face. As it turns out, having a hopeful outlook is important for tackling seemingly insurmountable conservation issues, and empowering others to want to do the same (Swaisgood & Sheppard 2010, Garnett & Lindenmayer 2011).

The title of this blog comes from an eloquent commencement speech by Paul Hawken about the importance of remaining optimistic when the data tells us otherwise. While the address was given to the University of Portland class of 2009, I think it is worth reading because it is a relevant and moving reminder of why hope is important.

But, before you read that, take a look at what has been done recently to protect biodiversity around the world-

Photo credit: Mark Sullivan NMFS Permit 10137-07/NOAA

President Obama quadrupled the size of a marine national monument in Hawaii. You can read more about the significance of this monument, called Papahānaumokuākea, in a previous blog of mine.

Photo credit: Northeast U.S. canyons expedition science team and NOAA Okeanos Explorer Program (2013)

Soon after announcing the expansion of Papahānaumokuākea, President Obama established the first marine national monument in the Atlantic. You can read more about the aptly named Northeast Canyons and Seamounts Marine National Monument here.

Photo credit:  Ari Friedlaender

And finally, to top it off, an international body comprised of 24 countries, called the Commission for the Conservation of Antarctic Marine Living Resources, recently came to a consensus to designate a vast portion of the Antarctic’s remote Ross Sea as the world’s largest marine reserve.


References

  • Garnett, S. T., & Lindenmayer, D. B. (2011). Conservation science must engender hope to succeed. Trends in Ecology & Evolution, 26(2), 59-60.
  • Swaisgood, R. R., & Sheppard, J. K. (2010). The culture of conservation biologists: Show me the hope!. BioScience, 60(8), 626-630.


Assembling a Toolbox

By Dawn Barlow, MSc student, Oregon State University

toolbox
Source: https://www.ohrd.wisc.edu/home/portals/0/toolbox.jpg

The season has shifted since the post I wrote this summer about diving into the world of New Zealand blue whales and the beginnings of my masters research. My fieldwork will take place during the upcoming austral summer, which will require me to miss the winter term here on campus. This quarter, I have put my research on the back burner for the time being in favor of a full load of coursework. But my project is still there, simmering subtly and persistently, and giving relevance to the coursework that I’m focusing my energy on this fall term.

As an undergraduate student, I acquired a broad scientific background and had the opportunity to dabble in the areas of biology that piqued my interest. I arrived here with a basic understanding of chemistry, physics, cell biology, anatomy, marine ecology and conservation biology. I gained experience working in the field with intertidal sea stars, snails, mussels, crabs and barnacles, with bottlenose dolphins and with humpback whales. But now my focus has narrowed as I’ve honed in on the specific questions that I will pursue over the next two years. My passion lies in marine ecology and conservation. Now, as a graduate student studying the ecology of a little-known population in a highly industrial area, this passion can come to fruition. For my masters, I hope to do the following:

A) Use photo-identification analysis to obtain a population abundance estimate for blue whales in New Zealand

B) Investigate blue whale residency and distribution patterns in New Zealand waters

C) Develop a comprehensive blue whale habitat use model for the South Taranaki Bight region of New Zealand, which incorporates physical and biological data

Down the road I hope to have implemented a capture-recapture abundance estimate model that best fits the dynamics of this population of blue whales, to have mapped where sightings have occurred and where the highest densities of blue whales are found in both space and time, and to have paired blue whale presence and absence with prey distribution, remote-sensed environmental data, and in situ oceanographic data. But how does one accomplish these things? I need a toolbox to draw from. And so this fall, I am assembling my toolbox, learning programs and analytical skills. I am taking methods courses—statistics, data management in R, analysis in GIS, methods in physiology and behavior of marine megafauna—that are no longer explorations into the world of natural science, but rather tools for exploring, identifying, and interpreting specific phenomena in ecology. While each comes with its own hiccups and headaches (see Florence’s post about this…), they are powerful tools.

Aside from coursework, the research I’m conducting has gained weight and relevance beyond being an investigation in ecology. My study area lies in the South Taranaki Bight of New Zealand, which is a contentious proposed seabed mining site for iron sands. As an undergraduate student I read case studies and wrote papers on the environmental impacts of industry, and I decided to go graduate school because I want to do research that has direct conservation applications. Last week I compiled all the data I’ve processed on blue whale sightings, seasonal residency, and photo identification for the South Taranaki Bight, which will be included as evidence submitted in environmental court in New Zealand by my advisor, Dr. Leigh Torres. “Applied conservation science” has been an abstract idea that has excited and motivated me for a long time, and now I am partaking in this process, experiencing applied conservation science firsthand.

And so my toolbox is growing, and the scope of my work is simultaneously narrowing in focus and expanding in relevance. The more tools I acquire, the more excited I am to apply them to my research. As I build my toolbox this fall, this process is something I look forward to enhancing while I’m in the field, when I dig deeper into data analysis, and as I grow as a conservation scientist.

A blue whale dives in the South Taranaki Bight, New Zealand. Photo by Leigh Torres.

R/V Oceanus Day One: Hungry Hungry Humpbacks

By Florence Sullivan and Amanda Holdman

The GEMM lab is adventuring out into the wild blue yonder of open ocean sampling and educational outreach! Leigh is the chief scientist onboard the R/V Oceanus for the next two days as we sail through Oregon waters in search of marine megafauna. Also onboard are four local teachers and five high school students who are learning the tricks of the trade. Amanda and I are here to help teach basic oceanography and distance sampling techniques to our enthusiastic students.

Science Party musters in the dry lab for safety debrief. photo credit: Florence Sullivan

We started the morning with safety briefings, and headed out through the Newport breakwater, direction: Stonewall Bank.  Stonewall is a local bathymetric feature where upwelling often occurs, leading to a productive ecosystem for both predators and prey. Even though our main sampling effort will be offshore this trip, we didn’t even make out of the harbor before recording our first gray whale and California sea lion sightings.

California Sea Lions on the Newport buoy. Taken under NMFS permit 16111 John Calambokidis

Our students (and their teachers) are eager and quick to catch on as we teach them new methodologies. Amanda and I had prepared presentations about basic oceanographic and distance sampling methods, but really the best way to learn is to jump in and go. We’ve set up a rotation schedule, and everyone is taking turns scanning the ocean for critters, deploying and recovering the CTD, logging data, and catching plankton.

a small pod of Orca. Photo credit: Florence Sullivan. Taken under NMFS permit 16111 John Calambokidis
A small pod of Orca. Photo credit: Florence Sullivan. Taken under NMFS permit 16111 John Calambokidis

So far, we have spotted gray whales, sea lions, a pod of (lightning speed) killer whales, lots of seagulls, northern fulmars, sooty shearwaters, storm petrels, and cormorants, but today’s highlight has to the last sighting of ~42 humpback whales. We found them at the Northern edge of Heceta Bank – a large rocky reef which provides structural habitat for a wide variety of marine species. As we approached the area, we spotted one whale, and then another. At first, our spotters had no trouble inputting the data, getting photo-ID shots, and distinguishing one whale from the next, but as we continued, we were soon overwhelmed. With whale blows surrounding us on all sides, it was hard to know where to look first – here a surface lunge, there, a breach, a spout, a fluke, a flipper slap! The surface activity was so dense and enthralling, it took a few moments before realizing there were some sea lions in the feeding frenzy too!

Five humpback whales surface at once. photo credit: Leigh Torres. Taken under NMFS permit 16111 John Calambokidis

We observed the group, and tried to document as many individuals as possible as the sunset faded into night. When poor visibility put a stop to the visuals, we hurried to do a plankton tow and CTD cast to find some environmental insights for such a gathering. The CTD revealed a stratified water column, with two distinct layers, and the plankton tow brought up lots of diatoms and krill. As one of the goals of this cruise is to explore how marine mammals vary with ocean gradients, this is a pretty cool way to start.

A humpback whale lunge feeds. Photo credit: Leigh Torres. Taken under NMFS permit 16111 John Calambokidis

A long day observing has left us all exhausted, but not too tired to share our excitement. Stay tuned for more updates from the briny blue!

Follow this link for real time view of our beautiful ship! : http://webcam.oregonstate.edu/oceanus

Humpback flukes for photo ID. photo credit: Leigh Torres. Taken under NMFS permit 16111 John Calambokidis

Papahānaumokuākea: soon to be the world’s largest marine protected area?

By Erin Pickett, MS student, Oregon State University

On January 29, 2016, a group of native Hawaiian community leaders and conservation practitioners wrote a letter of request to President Barack Obama asking him to expand Papahānaumokuākea Marine National Monument1

Papahānaumokuākea is a UNESCO World Heritage Site and at the time of its creation in 2006, it became the world’s largest fully protected marine area2. The monument encompasses 140,000 square miles and surrounds the Northwestern Hawaiian Island (NWHI) chain, which extends about 2000 km northwest from the main Hawaiian Islands to Kure atoll (see map below). This monument was originally created through use of the Antiquity Act of 1906, which grants the President of the United States the authority to protect valuable public land through the establishment of a national monument3. The initial letter of request sent to President Obama in January called on the President to use his executive power to expand Papahānaumokuākea marine national monument.

This letter of request was put simply. The letter writers believed that as an island boy himself, President Barack Obama understands the importance of the ocean to the people of Hawai’i, especially future generations. This letter and the discussions that have since followed it, emphasize not only the biological value of conserving this large swath of marine habitat, but also the cultural significance of preserving such a place. In the field of marine biology we don’t traditionally think of marine protected areas (MPAs) as “…cultural seascapes that have meaning and significance in the formation and perpetuation of oceanic identity4,” however in the case of the expansion of Papahānaumokuākea, cultural justification is aptly interwoven with biological conservation. The proposed expansion of this marine protected area is especially significant to me for this reason.

While I am not native Hawaiian, much of my life is tied to the ocean. My personal life and my current career as a master’s student of marine science are driven by aloha and malama ‘āina. These two concepts are core tenets of Hawaiian culture and they describe a profound love (aloha) and deep respect and sense of caring (malama) for the āina, or land. I have never felt more aloha or such a strong sense of caring for a place than for Papahānaumokuākea.

Papahānaumokuākea is a sacred place; a place where the Hawaiian people believe life began. Today, the islands, atolls and the surrounding ocean within the monument continue to create and sustain vast quantities of life, in the form of marine species. The use of the monument is limited to cultural, scientific and educational activities, while activities such as commercial fishing and deep-sea mining are prohibited4,5. One primary benefit of large MPAs is that they improve the state of an ecosystem by supporting sufficient numbers of large and far-ranging predators6. The waters surrounding the NWHI support high numbers of large fish, sharks, marine mammals and seabirds. A total of 7,000 known species exist here, 25% of which are endemic7. The expansion of this monument would mean greater protection for these species, and for important pelagic habitats such as seamounts. Underwater seamounts are biodiversity hot spots and a vast number of them exist outside of the current boundaries but within the limits of the proposed expansion of the monument. Far ranging top predators such as seabirds would benefit greatly from an expanded protected area that would reduce the chance of interactions with longline fishing vessels. The foraging ranges of many of the 14 million seabirds that exist in the monument extend beyond its current boundaries4,8. The Hawaiian longline fishery is especially dangerous for Laysan and black-footed albatross, and hooks an estimated 1,000-2,000 of each species per year9.

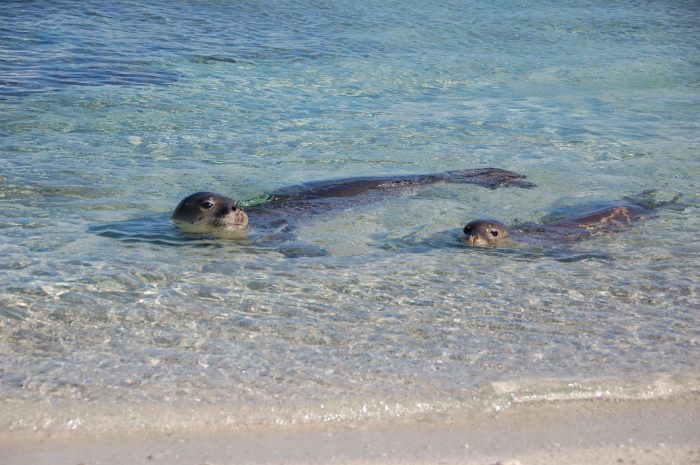
The Laysan albatross, or mōlī, as it is known in Hawaiian, is the species that captured my attention the most during my time in Papahānaumokuākea. In 2010, I worked for the NOAA/NMFS Hawaiian monk seal research program on Laysan Island. While our work on Laysan was focused on the Hawaiian monk seal, it was hard to miss the energy of the presence of the mōlī. We had the opportunity to observe these birds come to the island to make nests, lay eggs and raise their chicks. The incessant sound of hundreds of thousands of albatross whistling and clicking their beaks at their mates and with their chicks is one I will never forget. You can hear these sounds for yourself in a video that Rachael included in a previous blog post about her time on Midway atoll. On Laysan, I had the opportunity to connect deeply with a natural place and this connection reinforced the feeling of aloha ‘aina.

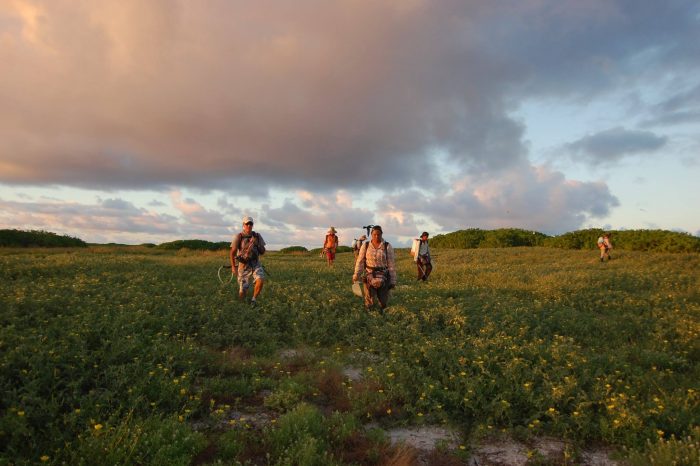
While in the NWHI, we occupied much of our daily life with not only observing and connecting with the wildlife, but also with carrying out conservation activities, such as monitoring the local monk seal population and removing marine debris from beaches. While Laysan is remote, it has not escaped the far reaches of marine plastic pollution (see Rachael’s blog for more on this). Additionally, many of the NWHI are in a perpetual state of restoration and invasive species removal projects. After Laysan, I spent time working on Lisianski Island and then Kure atoll, where we worked tirelessly to eradicate an invasive weed, Verbesina encelioides, and replace it with native plants that we had cultivated. Throughout all of these activities, there was always a feeling that it was our duty to malama ‘aina, to care for and protect these fragile islands and the species that depend on them.

A significant amount of momentum has been gained since January, with one important development being a formal proposal that outlines the main points of this request to the President. These include a request to expand the perimeter of the monument to the limits of the U.S. exclusive economic zone, which lies an additional 150 nm beyond its current boundaries. This expansion would more than quadruple the monument’s current size and make it the world’s largest contiguously protected area. The Obama administration has sent delegates to Hawaii to learn more and has intentions to develop an official federal proposal10. While the timeline of this is unclear, a local coalition of community leaders are actively garnering public support to encourage the Obama administration to sign this expansion into law.

There was a meeting held last night on Kauai to hear public input regarding the proposed expansion of Papahānaumokuākea and because I was not able to attend I was inspired to write this blog to share my thoughts about why I believe further protection of this monument is a pono (moral, just, righteous) decision. The place-based connection I have with Hawai’i and its surrounding waters are what have guided my career in the fields of marine science and conservation. For me, this connection is with Hawai’i, but for you it may your own hometown, island, backyard or nearby mountain peak.

Our love of these places is significant because it facilitates a greater understanding of why they are important to protect. In the field of conservation today, it is especially critical that we foster these types of connections. Preserving wild places, whether they be remote island ecosystems or more easily accessible nature parks, is one way we can ensure that more people have the opportunity to make these connections.


References

1 Eagle, N. (2016). Honolulu Civil Beat. Hawaiians Press Obama to Expand NW Islands Marine Monument. Retrieved from http://www.civilbeat.org/2016/02/should-obama-expand-papahanaumokuakea/

2 Pew Charitable Trust. Global Ocean Legacy-Hawaii (2016). Fact sheet.Papahānaumokuākea Marine National Monument: Expanding protections to conserve Hawaiian culture and biodiversity Retrieved from: http://www.pewtrusts.org/en/research-and-analysis/fact-sheets/2016/05/papahanaumokuakea-marine-national-monument

3 “Antiquities Act” Wikipedia: The Free Encyclopedia. Wikimedia Foundation, Inc. 4 March 2016. Web. 2 August 2016.

4 Kerr, J., et al. 2016. PUʻUHONUA: A PLACE OF SANCTUARY. The Cultural and Biological Significance of the proposed expansion for the Papahānaumokuākea Marine National Monument.

5 Papahānaumokuākea Marine National Monument: Resource Protection. Retrieved from: http://www.papahanaumokuakea.gov/resource/

6 Edgar, Graham J., et al. “Global conservation outcomes depend on marine protected areas with five key features.” Nature 506.7487 (2014): 216-220.

7 National Marine Sanctuaries (2016), National Oceanic and Atmospheric Administration. Accessed on 01 February 2016: http://sanctuaries.noaa.gov/#PM

8 Papahanaumokuakea Marine National Monument Management Plan 2008; KE Keller, AD Anders, SA Shaffer, MA Kappes, B Flint, and A Friedlander, 2009. Seabirds: A Marine Biogeographic Assessment of the Northwestern Hawaiian Islands.

9 Cousins, K.L., et al. Managing pelagic longline-albatross interactions in the North Pacific Ocean. Retrieved from: http://www.wpcouncil.org/documents/managebird.pdf

10 Eagle, N. (2016). Hawaii Lawmakers To Obama: Don’t Grow Marine Monument. Honolulu Civil Beat. Retrieved from: http://www.civilbeat.org/2016/05/hawaii-lawmakers-to-obama-dont-grow-marine-monument/


Making a Splash

By: Cathryn Wood, Lawrence University ’17, summer REU in the GEMM Lab

Greetings from Port Orford! My name is Cathryn, and I am the fourth member of the GEMM Lab’s gray whale foraging ecology research team, which includes Florence, Kelli, and the other Catherine (don’t worry, I go by Cat). Nearly 5 weeks into field season, I am still completely amazed with my first West Coast experience and doing what I’ve always dreamt of: studying marine mammals. Coming from Michigan’s Upper Peninsula, this may seem slightly out of place, but my mom can attest; she read “Baby Beluga” to me every night when I was a toddler. Now a rising senior majoring in biology at Lawrence University, I’ve been focusing my coursework on aquatic and marine ecology to prepare for graduate school where I plan to specialize in marine science. Being part of this research is a very significant step for me into the field.

So how did I end up here, as part of this amazing project and dream, women-in-science team? I am interning through OSU’s Ocean Sciences REU program at the Hatfield Marine Science Center, where the GEMM Lab is located. REU stands for “Research Experience for Undergraduates ”, and is an NSF-funded research internship program found in numerous universities around the country. These internships allow undergrads to conduct independent research projects under the guidance of a faculty mentor at the program’s institution. I applied to several REUs this past winter, and was one of 12 undergrads accepted for the program at HMSC. Each of us is paired with different faculty members to work on various projects that cover a diverse range of topics in the marine sciences; everything from estuarine ecology, to bioacoustics. I was ecstatic to learn that I had been paired with Dr. Torres as my faculty mentor to work on Florence’s gray whale project, which had been my first choice during the application process.

My particular research this summer is going to complement Florence’s master’s thesis work by asking new questions regarding the foraging data. While her project focuses on the behavioral states of foraging whales, I will be looking at the whale tracks to see if there are patterns in their foraging behavior found at the individual level. Traditionally, ecological studies have accepted classical niche theory, treating all individuals within a population as ecological equivalents with the same niche width. Any variances present among individuals are often disregarded as having an insignificant consequence on the population dynamics as a whole, but this simplification can overlook the true complexity of that population . The presence of niche variation among conspecifics is known to occur in at least 93 species across a diverse array of taxa, so the concept of individual specialization, and how it can affect ecological processes is gaining recognition progressively in the field (Bolnick et al., 2003). My goal is to determine whether or not the gray whales in this study, and presumably others in the Pacific Coast Feeding Group (PCFG), exhibit individual specialization in their foraging strategies . There are many ways in which individuals can specialize in foraging, but I will be specifically determining if fine scale spatial patterns in the location of foraging bouts exists, regardless of time.

To address my question, I am using the whale tracking data from both 2015 and 2016, and learning to use some very important software in the spatial ecology world along the way through a method that Dr. Torres introduced to me. Starting in ArcGIS, I generate a kernel density layer of a raw track (Fig. 1 ), which describes the relative distribution of where the tracked whale spent time (Fig. 2 ). Next, using the isopleth function in the software Geospatial Modelling Environment, I generate a 50% density contour line that distinguishes where the whale spent at least 50% of its time during the track (Fig. 3 ). Under the assumption that foraging took place in these high density areas, we use these 50% contour lines to describe foraging bout locations. I now go back to ArcGIS to make centroids within each 50% line, which mark the exact foraging bout locations (Fig. 4 ).

Fig.1 Raw individual whale track.
Fig. 1 Raw individual whale track.
Fig. 2 Kernel Density map of whale track.
Fig. 3 50% isopleth contours of locations with highest foraging densities
Fig. 4 Final centroids to signify foraging bouts

These centroids will be determined for every track by an individual whale, and then compared relative to foraging locations of all tracked whales to determine if the individual is foraging in different locations than the population. Then, the tracks of individuals who repeatedly visit the site at least three times will be compared with one another to determine if the repeat whales show spatial and/or temporal patterns in their foraging bout locations, and if specialization at a fine scale is occurring in this population. If you did not quite follow all those methods, no worries, it was a lot for me to take in at first too. I’ve finally gotten the hang of it though, and am grateful to now have these skills going into grad school.

Because I am interested in behavioral ecology and the concept of individuality in animal populations, I am extremely excited to see how this research plays out. Results could be very eye-opening into the fine scale foraging specialization of the PCFG sub-population because they already demonstrate diet specialization on mysid (as opposed to their counterparts in the Bering Sea who feed on benthic organisms) and large scale individual residency patterns along the Pacific Northwest (Newell, 2009; Calambokidis et al., 2012). Most significantly, understanding how individuals vary in their feeding strategies could have very important implications for future conservation measures for the whales, especially during this crucial foraging season where they replenish their energy reserves.  Management efforts geared for an “average population” of gray whales could ultimately be ineffective if in fact individuals vary from one another in their foraging strategies. Taking into account the ways in which variation occurs amongst individuals is therefore crucial knowledge for successful conservation approaches.

My project is unique from those of the other REUs because I am simultaneously in the midst of assisting in field season number two of Florence’s project. While most of the other interns are back at Hatfield spending their days in the lab and doing data analyses like a 9-5 job, I am with the team down in Port Orford for field season. This means we’re out doing research every dawn as weather allows. Though I may never have an early bird bone in my body, the sleepy mornings are totally worth it because ecology field work is my favorite part of research. To read more about our methods in the field, check out Florence’s post.

Since Catherine’s last update, we’ve had an eventful week. To our dismay, Downrigger Debacle 2.0 occurred. (To read about the first one, see Kelli’s post). This time it was not the line – our new line has been great. It was a little wire that connected the downrigger line to the pipe that the GoPro and TDR are connected to. It somehow snapped due to what I presume was stress from the currents.   Again, it was Catherine and I in the kayak, with a very successful morning on the water coming to a close when it happened. Again, I was in the bow, and she was in the stern deploying the equipment – very déjà vu. When she reeled in an equipment-less line, we at first didn’t know how to break it to Florence and Kelli who were up on the cliff that day. Eventually, Catherine radioed “Brace yourselves…” and we told them the bad news. Once again, they both were very level-headed, methodical, and un-blaming in the moments to follow. We put together the same rescue dive team as last time, and less than a week later, they set off on the mission using the GPS coordinates I had marked while in the kayak. Apparently, between the dredging taking place in the harbor and the phytoplankton bloom, visibility was only about 2 feet during the dive, but they still recovered the equipment, with nothing but baked goods and profuse thanks as payment. We are very grateful for another successful recovery, and are confident that our new attachment mechanism for the downrigger will not require a third rescue mission (Fig. 6-8). Losing the equipment twice now has taught us some very important things about field work. For one, no matter how sound you assume your equipment to be, it is necessary to inspect it for weak points frequently – especially when salt water and currents are in the picture. Perhaps even more importantly, we’ve gotten to practice our problem solving skills and see firsthand how necessary it is to act efficiently and calmly when something goes wrong. In ecological field research you have to be prepared for  anything.

Fig. 5 Original setup of GoPro and TDR.
Fig. 6 Photo taken after the wire that connected the pole to the downrigger line snapped.
Fig. 7 New mechanism for attaching the pole to the downrigger line.
Fig. 8 Equipment rescue team: Aaron Galloway and Taylor Eaton diving, Greg Ryder operating the boat, and Florence on board to direct the GPS location of where the equipment was lost.

In other news, unlike our slow-whale days during the first two weeks of the project, we have recently had whales to track nearly every day from the cliff! In fact, the same, small, most likely juvenile, whale pictured in Catherine’s last post has returned several times, and we’ve nicknamed her “Buttons” due to two distinguishing white spots on her tail peduncle near the fluke. Though we tend to refer to Buttons as “her”, we cannot actually tell what the sex is definitively…until now. Remember in Catherine’s post when she described how Buttons defecated a lot, and how our team if, given the opportunity, is supposed to collect the feces when we’re out in the kayak for Leila’s project?  Everything from hormone levels to reproductive status to, yes, sex, is held in that poop! Well, Miss (or Mr.) Buttons was in Tichenor Cove today, and to our delight, she performed well in the defecation department once again. Florence and I were on cliff duty tracking her and Kelli and Catherine were in Tichenor on the kayak when we first noticed the defecation.  I then radioed down to the kayak team to stop what they were doing and paddle quickly to go collect it before it sank (Fig. 9).  Even in these situations, it is important to stay beyond 100 yards of the animal, as required by the MMPA. Florence and I cheered them on and our ladies did indeed get the poop sample, without disturbing the whale (Fig. 10). It was a sight to behold.

Fig. 9 Kelli and Catherine on a mission.
Fig. 10 Kelli and Catherine collecting the feces.

We were able to track Buttons for the remainder of our time on the cliff, and were extremely content with the day’s work as we packed all the gear up later in the afternoon. Right before we were about to leave, however, Buttons had one more big treat for us. As we looked to the harbor before starting the trek back to the truck, we paused briefly after noticing a large, white splash in the middle of the harbor, not far from the dock. We paused for a second and thought “No, it can’t be, was that —?” and then we see it again and unanimously yelled “BREACH!” Buttons breached about five times on her way back to Tichenor Cove from where she had been foraging in Mill Rocks. It is rare to see a gray whale breach, so this was really special. Florence managed to capture one of the breaches on video:

At first I thought a big ole humpback had arrived, but nope, it was our Buttons! I am in awe of this little whale, and am forever-grateful to be in the presence of these kinds of moments. She’s definitely made her splash here in Port Orford. I think our team has started to as well.


Bolnick, D. I., Svanback, R., Fordyce, J. A., Yang, L. H., Davis, J. M., Hulsey, C. D., & Forrister, M. L. (2003). Ecology of Individuals: Incidence and Implications of Individual Specialization. The American Naturalist, 161(1), 28.

Calambokidis, J., Laake, J. L., & Klimek, A. (2012). Updated analysis of abundance and population structure of seasonal gray whales in the Pacific Northwest, 1998-2010 (Vol. 2010).

Newell, C. (2009). Ecological Interrelationships Between Summer Resident Gray Whales (Eschrichtius robustus) and Their Prey, Mysid Shrimp (Holmesimysis sculpta and Neomysis rayi) along the Central Oregon Coast.


Sonic Sea asks “can we turn down the volume before it’s too late?”

By: Amanda Holdman, MS student, Geospatial Ecology and Marine Megafauna Lab & Oregon State Research Collective for Applied Acoustics, MMI

It was March 15th, 2000; Kenneth Balcomb was drinking coffee with his new summer interns in the Bahamas when a goose-beaked whale stranded on a nearby beach. Balcomb, a whale researcher and former U.S. Navy Officer, gently pushed the whale out to sea but the beaked whale kept returning to the shore. He continued this process until a second beaked whale stranding was reported further down the beach; and then a third. Within hours, 17 cetaceans had stranded in the Bahamas trying to escape ‘something’ in the water, and Kenneth Balcomb was determined to solve the mystery of the mass stranding. The cause, he eventually learned, was extreme noise – sonar tests from Navy Warships.

The world is buzzing with the sounds of Earth’s creatures as they are living, interacting, and communicating with one another, even in the darkest depths of the oceans. Beneath the surface of our oceans lies a finely balanced, living world of sound. To whales, dolphins and other marine life, sound is survival; the key to how they navigate, find mates, hunt for food, communicate over vast distances and protect themselves against predators in waters dark and deep. Yet, this symphony of life is being disrupted and sadly destroyed, by today’s increasing noise pollution (Figure 1). Human activities in the ocean have exploded over the past 5 decades with ocean noise rising by 3db per decade (Halpern et al. 2008). People have been introducing more and more noise into the ocean from shipping, seismic surveys for oil and gas, naval sonar testing, renewable energy construction, and other activities. This increased noise has significant impacts on acoustically active and sensitive marine mammals. However, as the Discovery Chanel’s new documentary Sonic Sea points out “The biggest thing about noise in the ocean is that humans aren’t aware of the sound at all.” The increase of ocean noise has transformed the delicate ocean habitat, and has challenged the ability of whales and other marine life to prosper and survive.

June blogFigure 1: Anthropogenic sources contributing to ocean soundscapes and the impacts on marine megafauna survival (sspa.se)

Like the transformative documentary from 10 years ago, An Inconvenient Truth, which highlighted the reality and dangers of climate change, Sonic Sea aims to inform audiences of increased man-made noise in the oceans and the harm it poses to marine animals. The Hatfield Marine Science Center and Oregon Chapter of the American Cetacean Society offered a free, premier showing of the award-winning documentary followed by a scientific panel discussion. The panel featured Dave Mellinger, Joe Haxel, and Michelle Fournet of Oregon State University’s Cooperative Institute for Marine Resources Studies (CIMRS) marine bioacoustics research along with GEMM Lab leader, Leigh Torres, of the Marine Mammal Institute.

Sonic Sea introduces us to this global problem of ocean noise and offers up solutions for change. The film uncovers how better ship design, speed limits for large ships, quieter methods for under water resource exploration, and exclusion zones for sonar training can work to reduce the noise in our oceans. However, these efforts require continued innovation and regulatory involvement to bring plans to action.

Around the world the scientific community, policymakers and authorities such as The National Oceanic and Atmospheric Administration (NOAA), the European Union (EU), the International Maritime Organization (IMO) and other authorities have increasingly pressed for the reduction of noise.  NOAA, which manages and protects marine life in United States waters, is trying to reduce ocean noise through their newly released Ocean Noise Strategy Roadmap, where the challenge is dealt with as a comprehensive issue rather than a case-by-case basis. This undersea map is a 10-year plan that aims to identify areas of specific importance for cetaceans and the temporal, spatial, and frequency of man-made underwater noise. After obtaining a more comprehensive scientific understanding of the distributions and effects of noise in the ocean, these maps can help to develop better tools and strategies for the management and mitigation of ocean noise.

Sonic Sea states “we must protect what we love” but then asks “how we can love it if we don’t understand it?” Here at GEMM Lab and the Marine Mammal Institute, we are trying to understand marine species ecology, distributions and behavioral responses to anthropogenic impacts. One of the suggestions Sonic Sea makes to reduce the impact of ocean noise is to restrict activity in biologically sensitive habitats. Therefore, we must know where these important areas are. In an ideal world, we would have a good inventory of data on the marine animals present in a region and when these animals breed, birth and feed. Then we could use this information to guide marine spatial planning and management to keep noise out of important habitats. My thesis project aims to provide such baseline information on harbor porpoise distribution patterns within a proposed marine energy development site. By filling knowledge gaps about where marine animals can be found and why certain habitats are critical, conservation efforts can be more directed and effective in reducing threats, such as ocean noise, to marine mammals.

Noise in our oceans is hard to observe, but its effects are visibly traumatic and well-documented. Unlike other sources of pollution to our oceans, (climate change, acidification, plastic pollution), which may take years, decades or centuries to dissipate, reducing ocean noise is rather straight forward. “Like a summer night when the fireworks end, our oceans can quickly return to their natural soundscape.” Ocean noise is a problem we can fix. To quiet the world’s waters, we all need to raise our voices so policy makers hear of this problem. That’s what Sonic Sea is all about: increasing awareness of this growing threat and building a worldwide community of citizen advocates to help us turn down the volume on undersea noise. If we sit back and do nothing to mitigate oceanic noise pollution, the problem will likely worsen. I highly suggest watching Sonic Sea.  Then, together, we can speak up to turn down the noise that threatens our oceans — and threatens us all.

Sonic Sea airs TONIGHT (6/8) for World Ocean’s Day on Animal Planet  at 10pm ET/PT!

Scratching the Surface

By Dr. Leigh Torres, Assistant Professor, Oregon State University, Geospatial Ecology of Marine Megafauna Lab

I have been reminded of a lesson I learned long ago: Never turn your back on the sea – it’s always changing.

The blue whales weren’t where they were last time. I wrongly assumed oceanographic patterns would be similar to our last time out in 2014 and that the whales would be in the same area. But the ocean is dynamic – ever changing. I knew this. And I know it better now.

Below (Fig. 1) are two satellite images of sea surface temperature (SST) within the South Taranaki Bight and west coast region of New Zealand that we surveyed in Jan-Feb 2014 and again recently during Jan-Feb 2016. The plot on the left describes ocean surface conditions in 2014 and illustrates how SST primarily ranged between 15 and 18 ⁰C. By comparison, the panel on the right depicts the sea surface conditions we just encountered during the 2016 field season, and a huge difference is apparent: this year SST ranged between 18 and 23 ⁰C, barely overlapping with the 2014 field season conditions.

Figure 1. A comparison of satellite images of sea surface temperature (SST) in the South Taranaki Bight region of New Zealand between late January 2014 and early February 2016. The white circles on each image denote where the majority of blue whales were encountered during each field season.

While whales can live in a wide range of water temperatures, their prey is much pickier. Krill, tiny zooplankton that blue whales seek and devour in large quantities, tend to aggregate in pockets of nutrient-rich, cool water in this region of New Zealand. During the 2014 field season, we encountered most blue whales in an area where SST was about 15 ⁰C (within the white circle in the left panel of Fig. 1). This year, there was no cool water anywhere and we mainly found the whales off the west coast of Kahurangi shoals in about 21 ⁰C water (within the white circle in the right panel of Fig. 1. NB: the cooler water in the Cook Strait in the southeast region of the right panel is a different water mass than preferred by blue whales and does not contain their prey.)

The hot water we found this year across the survey region can likely be attributed, at least in part, to the El Niño conditions that are occurring across the Pacific Ocean currently. El Niño has brought unusually settled conditions to New Zealand this summer, which means relatively few high wind events that normally churn up the ocean and mix the cool, nutrient rich deep water with the hot surface layer water. These are ideal conditions for Kiwi sun-bathers, but the ocean remains highly stratified with a stable layer of hot water on top. However, this stratification does not necessarily mean the ocean is un-productive – it only means that the SST satellite images are virtually useless for helping us to find whales this year.

Although SST data can be informative about ocean conditions, it only reflects what is happening in the thin, top slice of the ocean. Sub-surface conditions can be very different. Ocean conditions during our two survey periods in 2014 and 2016 could be more similar when compared underwater than when viewed from above. This is why sub-surface sensors and data collection is critical to marine studies. Ocean conditions in 2014 and 2016 could both potentially provide good habitat for the whales. In fact, where and when we encountered whales during both 2014 and 2016 we also detected high densities of krill through hydro-acoustics (Fig. 2). However, in 2014 we observed many surface swarms of krill that we rarely saw this recent field season, which could be due to elevated SST. But, we did capture cool drone footage this year of a brief sub-surface foraging event:

An overhead look of a blue whale foraging event as the animal approaches the surface. Note how the distended ventral (throat) grooves of the buccal cavity (mouth) are visible. This is a big gulp of prey (krill) and water. The video was captured using a DJI Phantom 3 drone in the South Taranaki Bight of New Zealand in on February 2, 2016 under a research permit from the New Zealand Department of Conservation (DOC) permit # 45780-MAR issued to Oregon State University.

Figure 2. An echo-sounder image of dense krill patches at 50-80 m depth captured through hydroacoustics in the South Taranaki Bight region of New Zealand.

Below are SST anomaly plots of January 2014 and January 2016 (Fig. 3). These anomaly plots show how different the SST was compared to the long-term average SST across the New Zealand region. As you can see, in 2014 (left panel) SST conditions in our study area were ~1 ⁰C below average, while in 2016 (right panel) SST conditions were ~1 ⁰C above average. So, what are normal conditions? What can we expect next year when we come back to survey again for blue whales across this region? These are challenging questions and illustrate why marine ecology studies like this one must be conducted over many years. One year is just a snap shot in the lifetime of the oceans.

Figure 3. Comparison of sea surface temperature (SST) anomaly plots of the New Zealand region between January 2014 (left) and January 2016 (right). The white box in both plots denotes the general location of our blue whale study region. (Apologies for the different formats of these plots - the underlying data is directly comparable.)
Figure 3. Comparison of sea surface temperature (SST) anomaly plots of the New Zealand region between January 2014 (left) and January 2016 (right). The white box in both plots denotes the general location of our blue whale study region. (Apologies for the different formats of these plots – the underlying data is directly comparable.)

Like all marine megafauna, blue whales move far and fast to adjust their distribution patterns according to ocean conditions. So, I can’t tell you what the ocean will be like in January 2017 or where the whales will be, but as we continue to study this marine ecosystem and its inhabitants our understanding of ocean patterns and whale ecology will improve. With every year of new data we will be able to better predict ocean and blue whale distribution patterns, providing managers with the tools they need to protect our marine environment. For now, we are just beginning to scratch the (sea) surface.