Measure faster! New tools for automatically obtaining body length and body condition of whales from drone videos

Dr. KC Bierlich, Postdoctoral Scholar, OSU Department of Fisheries, Wildlife, & Conservation Sciences, Geospatial Ecology of Marine Megafauna Lab

Monitoring the body length and body condition of animals can help provide important information on the health status of individuals and their populations, and can even serve as early warning signs if a population is adapting to habitat changes or is at risk of collapse (Cerini et al., 2023). As discussed in previous blogs, drone-based photogrammetry provides a method for non-invasively collecting important size measurements of whales, such as for detecting differences in body condition and length between populations, and even diagnosing pregnancy. Thus, using drones to collect measurement data on the growth, body condition, and pregnancy rates of whales can help expedite population health assessments to elicit conservation and management actions.

However, it takes a long time to manually measure whales filmed in drone imagery. For every video collected, an analyst must carefully watch each video and manually select frames with whales in good positions for measuring (flat and straight at the surface). Once frames are selected, each image must then be ranked and filtered for quality before finally measuring using a photogrammetry software, such as MorphoMetriX. This entire manual processing pipeline ultimately delays results, which hinders the ability to rapidly assess population health. If only there was a way to automate this process of obtaining measurements…

Well now there is! Recently, a collaboration between researchers from the GEMM Lab, CODEX, and OSU’s Department of Engineering and Computer Science published a manuscript introducing automated methods for obtaining body length and body condition measurements (Bierlich et al., 2024). The manuscript describes two user-friendly models: 1) “DeteX”, which automatically detects whales in drone videos to output frames for measuring and 2) “XtraX”, which automatically extracts body length and body condition measurements from input frames (Figure 1). We found that using DeteX and XtraX produces measurements just as good as manual measurement (Coefficient of Variation < 5%), while substantially reducing the processing time by almost 90%. This increased efficiency not only saves hours (weeks!) of manual processing time, but enables more rapid assessments of populations’ health.

Future steps for DeteX and XtraX are to adapt the models so that measurements can be extracted from multiple whales in a single frame, which could be particularly useful for analyzing images containing mothers with their calf. We also look forward to adapting DeteX and XtraX to accommodate more species. While DeteX and XtraX was trained using only gray whale imagery, we were pleased to see that these models performed well when trialing on imagery of a blue whale (Figure 2). These results are encouraging because it shows that the models can be adapted to accommodate other species with different body shapes, such as belugas or beaked whales, with the inclusion of more training data.

We are excited to share these methods with the drone community and the rest of this blog walks through the features and steps for running DeteX and XtraX to make them even easier to use.
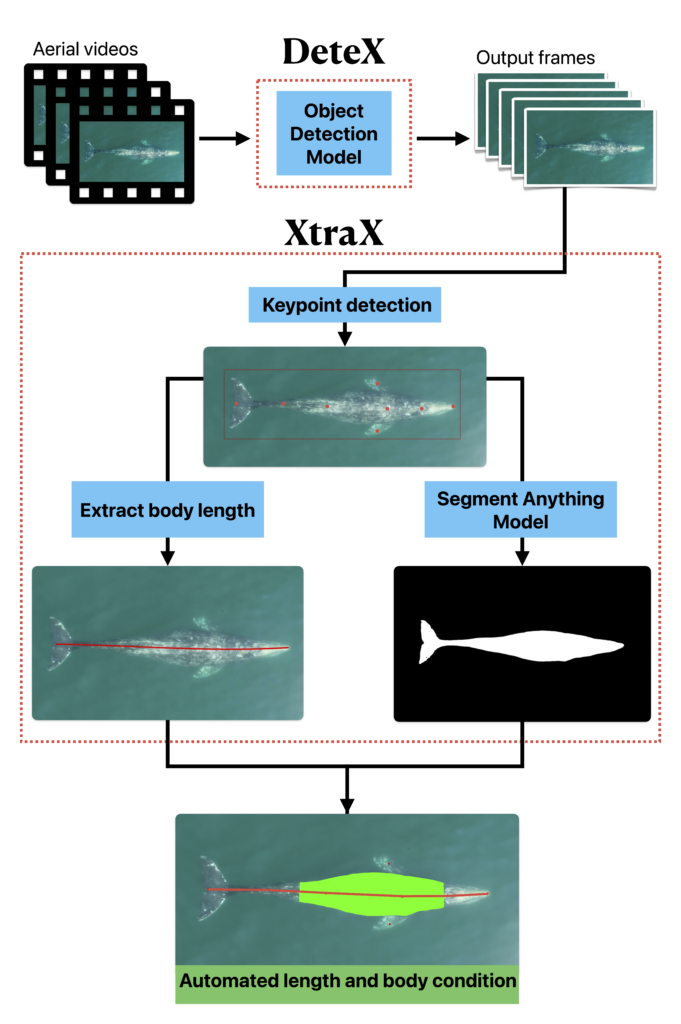
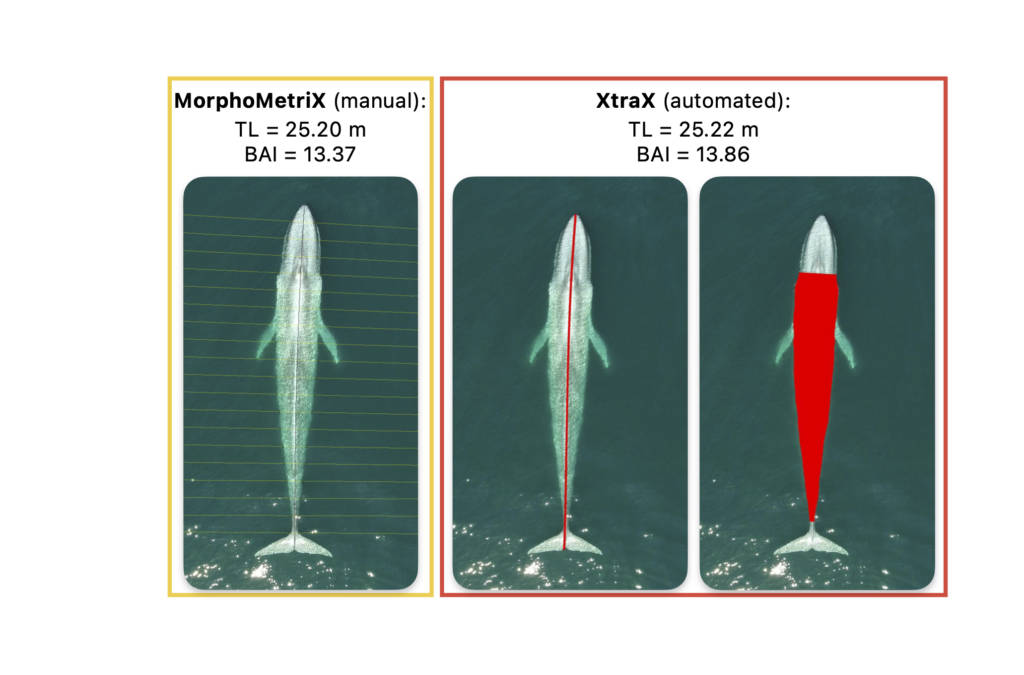
Figure 1. Overview of DeteX and XtraX for automatically obtaining body length and body condition measurements from drone-based videos.

Figure 2. Example comparing manual (MorphoMetriX) vs. automated (XtraX) measurements of a blue whale.

DeteX and XtraX walkthrough

Both DeteX and XtraX are web-based applications designed to be intuitive and user-friendly. Instructions to install and run DeteX and XtraX are available on the CODEX website. Once DeteX is launched, the default web-browser automatically opens the application where the user is asked to select 1) the folder containing the drone-based videos to analyze and 2) the folder to save output frames (Figure 3). Then, the user can select ‘start’ to begin. The default for DeteX is set to analyze the entire video from start to finish at one frame per second; if recording a video at 30 frames per second, the last (or 30th) frame is processed for each second in the video. There is also a “finetune” version of DeteX that offers users much more control, where they can change these default settings (Figure 4). For example, users can change the defaults to increase the number of frames processed per second (i.e., 10 instead of 1), to target a specific region in the video rather than the entire video, and adjust the “detection model threshold” to change the threshold of confidence the model has for detecting a whale. These specific features for enhanced control may be particularly helpful when there is a specific surfacing sequence that a user wants to have more flexibility in selecting specific frames for measuring.
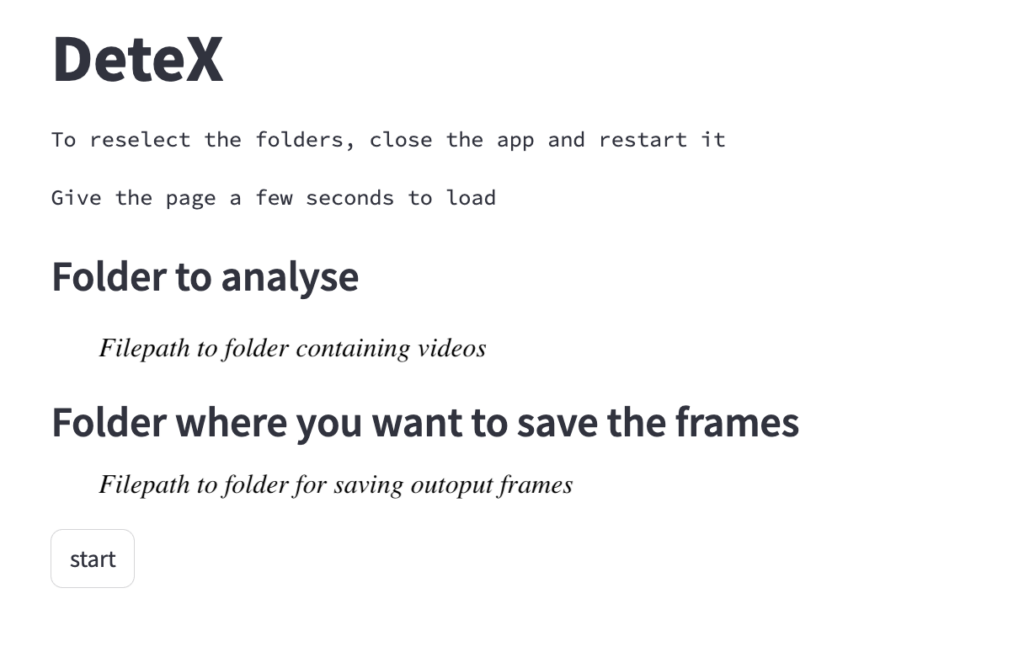
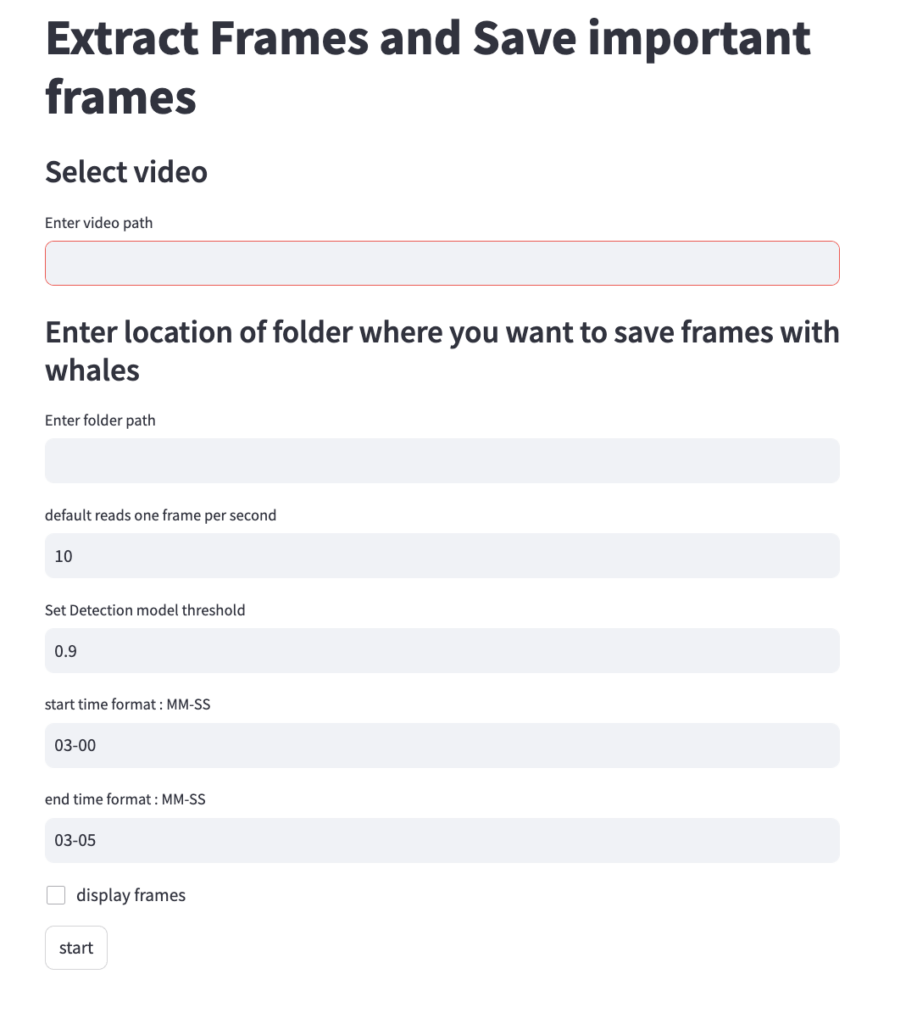
Figure 3. A screenshot of the DeteX web-based application interface.

Figure 4. The DeteX “finetune” version provides more control for users to change the default settings to target a specific region in the video (here between 3 min 00 sec and 3 min 05 sec), change the number of frames per second to process (now 10 per second), and the detection threshold, or level of confidence for identifying a whale in the video (now a higher threshold at 0.9 instead of the default at 0.8).

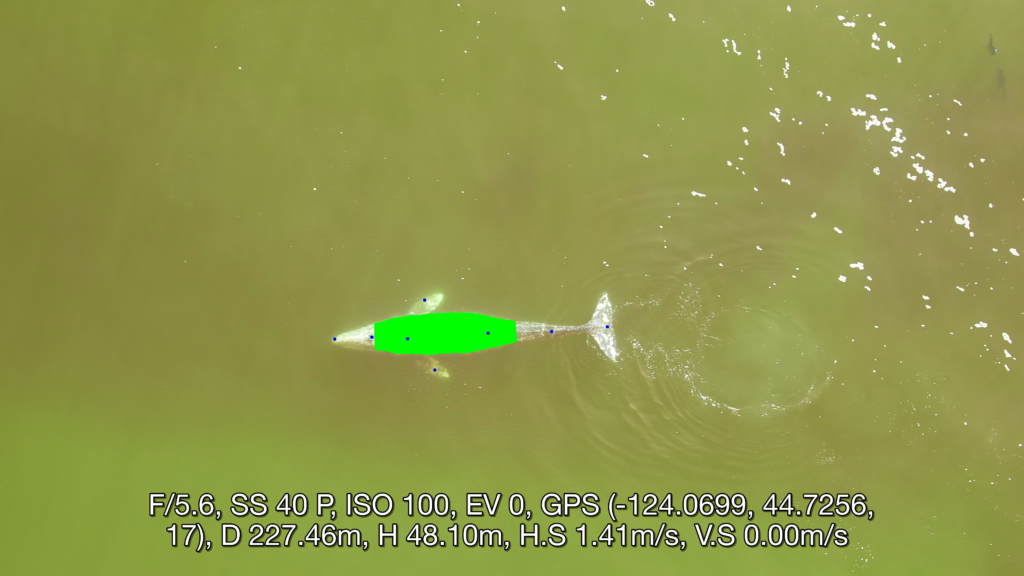
Once output frames are generated by DeteX, the user can select which frames to input into XtraX to measure. Once XtraX is launched, the default web-browser automatically opens the application where the user is asked to select 1) the folder containing the frames to measure and 2) the folder to save the output measurements. If the input frames were generated using DeteX, the barometric altitude is automatically extracted from the file name (note, that altitudes collected from a LiDAR altimeter can be joined in the XtraX output .csv file to then calculate measurements using this altitude). The image width (pixels) is automatically extracted from the input frame metadata. Users can then input specific camera parameters, such as sensor width (mm) and the focal length of the camera (mm), the launch height of the drone (i.e., if launching from hand when on a boat), and the region along the body to measure body condition (Figure 5). This region along the body is called the Head-Tail range and is identified as the area where most lipid storage takes place to estimate body condition. To run, the user selects “start”. XtraX then will output a .png file of each frame showing the keypoints (used for the body length measurement) and the shaded region (used for the body condition estimate) along the body to help visual results so users can filter for quality (Figure 6). XtraX also outputs a single .csv containing all the measurements (in meters and pixels) with their associated metadata.
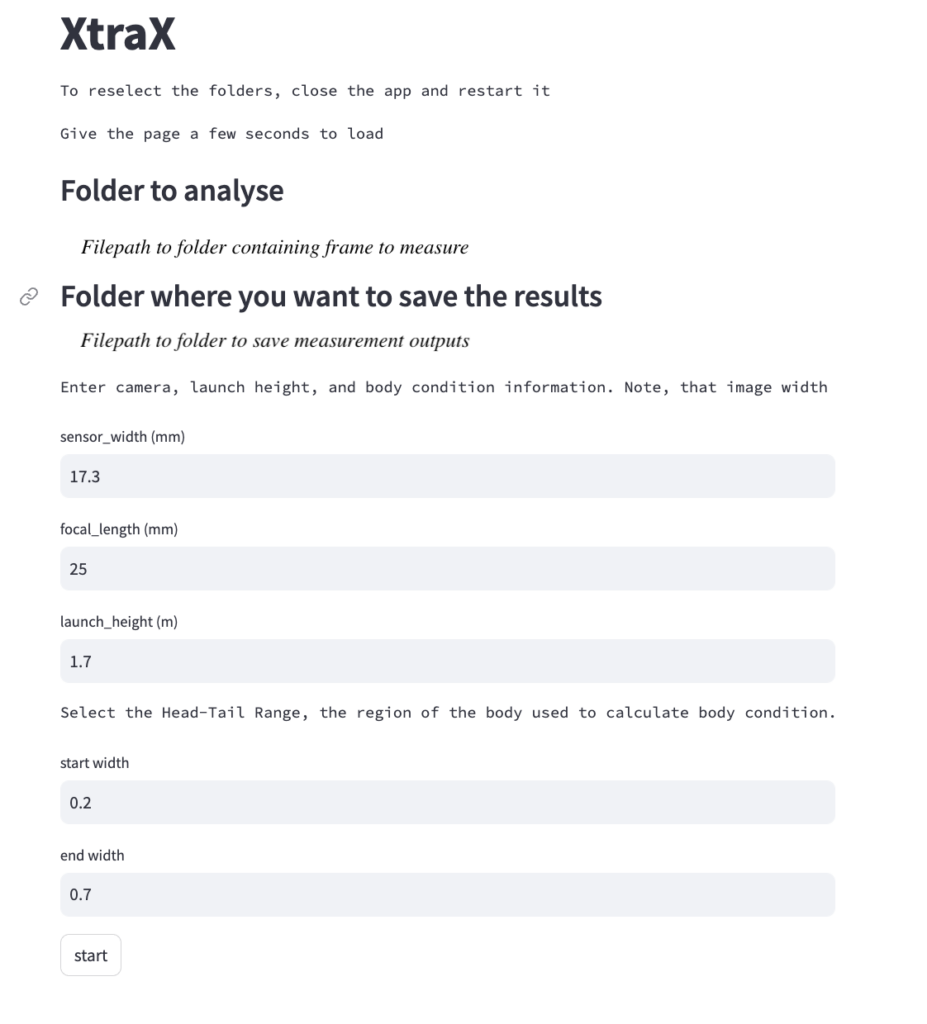
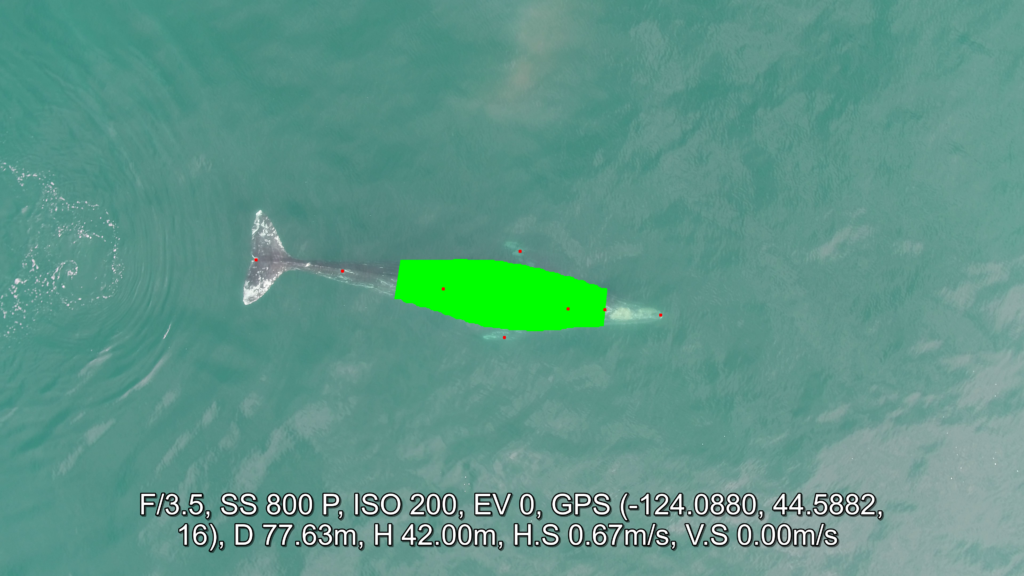
Figure 5. User interface for XtraX. The user specifies a folder containing the images to measure and a folder to save the outputs measurements, and then can enter in camera specifications, the launch height of the drone (to be added to the barometer altitude) and the range of body widths to include in the body condition measurement (in the case, 0.2 and 0.7 correspond to body region between widths 20% and 70% of the total length, respectively).

Figure 6. Example output from XtraX showing (red) keypoints along the body to measure body length and the (green) shaded region used for body condition.

We hope this walkthrough is helpful for researchers interested in using and adapting these tools for their projects. There is also a video tutorial available online. Happy (faster) measuring!

References

Bierlich, K. C., Karki, S., Bird, C. N., Fern, A., & Torres, L. G. (2024). Automated body length and body condition measurements of whales from drone videos for rapid assessment of population health. Marine Mammal Science, e13137. https://doi.org/10.1111/mms.13137

Cerini, F., Childs, D. Z., & Clements, C. F. (2023). A predictive timeline of wildlife population collapse. Nature Ecology & Evolution, 7(3), 320–331. https://doi.org/10.1038/s41559-023-01985-2
Fantastic beasts and how to measure  them! 

Sagar Karki, Master’s student in the Computer Science Department at Oregon State University 

What beasts? Good question! We are talking about gray whales in this article but honestly we can tweak the system discussed in this blog a little and make it usable for other marine animals too.  

Understanding the morphology, such as body area and length, of wild animals and populations can provide important information on animal  behavior and health (check out postdoc Dr. KC Bierlich’s post on this topic). Since 2015, the GEMM Lab has been flying drones over whales to collect aerial imagery to allow for photogrammetric measurements to gain this important morphological data. This photogrammetry data has shed light on multiple important aspects of gray whale morphology, including the facts that the whales feeding off Oregon are skinnier [1] and shorter [2] than the gray whales that feed in the Arctic region.  But, these surprising conclusions overshadow the immense, time-consuming labor that takes place behind the scenes to move from aerial images to accurate measurements.  

To give you a sense of this laborious process, here is a quick run through of the methods: First the 10 to 15 minute videos must be carefully watched to select the perfect frames of a whale (flat and straight at the surface) for measurement. The selected frames from the drone imagery are then imported into MorphoMetriX, which is a custom software developed for photogrammetry measurement [1]. MorphoMetriX is an interactive application that allows an analyst to manually measure the length by clicking points along the centerline of the whale’s body. Based on this line, the whale is divided into a set of sections perpendicular to the centerline, these are used to then measure widths along the body. The analyst then clicks border points at the edge of the whale’s body to delineate the widths following the whale’s body curve. MorphoMetriX then generates a file containing the lengths and widths of the whale in pixels for each measured image. The length and widths of whales are converted from pixels to metric units using a software called CollatriX [4] and this software also calculates metrics of body condition from the length and width measurements. 

While MorphoMetriX [3] and CollatriX [4] are both excellent platforms to facilitate these photogrammetry measurements, each measurement takes time, a keen eye, and attention to detail. Plus, if you mess up one step, such as an incorrect length or width measurement, you have to start from the first step. This process is a bottleneck in the process of obtaining important morphology data on animals. Can we speed this process up and still obtain reliable data? 

What if we can apply automation using computer vision to extract the frames we need and automatically obtain measurements that are as accurate as humans can obtain? Sounds pretty nice, huh? This is where I come into the picture. I am a Master’s student in the Computer Science Department at OSU, so I lack a solid background in marine science, but bring to the table my skills as a computer programmer. For my master’s project, I have been working in the GEMM Lab for the past year to develop automated methods to obtain accurate photogrammetry measurements of whales.  

We are not the first group to attempt to use computers and AI to speed up and improve the identification and detection of whales and dolphins in imagery. Researchers have used deep learning networks to speed up the time-intensive and precise process of photo-identification of  individual whales and dolphins [5], allowing us to more quickly determine animal location, movements and abundance. Millions of satellite images of the earth’s surface are collected daily and scientists are attempting to utilize these images to  benefit marine life by studying patterns of species occurrence, including detection of gray whales in satellite images using deep learning [6]. There has also been success using computer vision to identify whale species and segment out the body area of the whales  from drone imagery [7]. This process involves extracting segmentation masks of the whale’s body followed by length extraction from the mask. All this previous research shows promise for the application of computer vision and AI to assist with animal research and conservation. As discussed earlier, the automation of image extraction and photogrammetric measurement  from drone videos will help researchers collect vital data more quickly so that decisions that impact  the health of whales can be more responsive and effective.For instance,  photogrammetry data extracted from drone images can diagnose pregnancy of the whales [8], thus automation of this information could speed up our ability to understand population trends. 

Computer vision and natural language processing fields are growing exponentially. There are new foundation models like ChatGPT that can do most of the natural language understanding and processing tasks. Foundational models are also emerging for computer vision tasks, such as “the segment anything model” from Meta. Using these foundation models along with other existing research work in computer vision, we have developed and deployed a system that automates the manual and computational tasks of MorphoMetriX and CollatriX systems.  

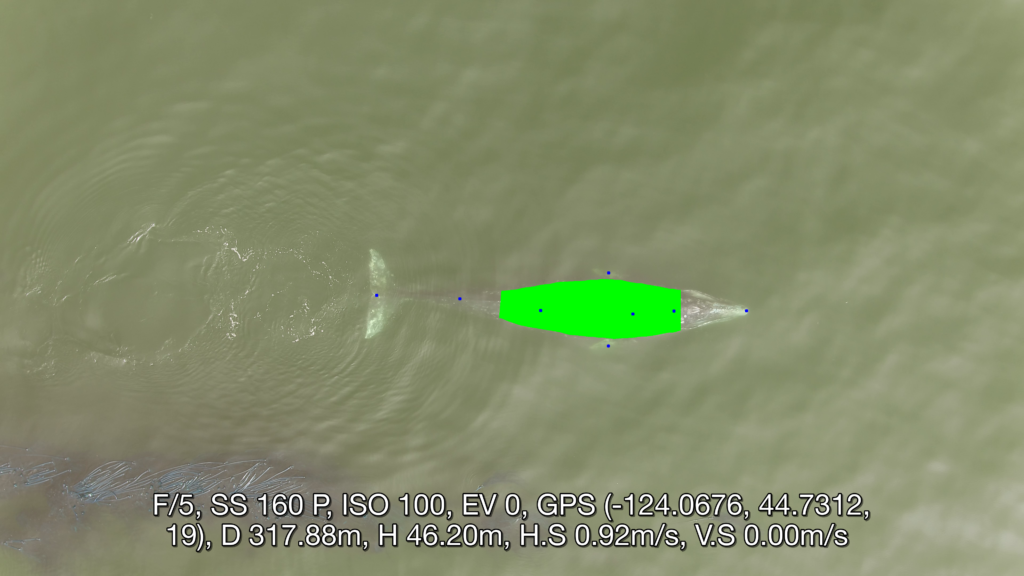
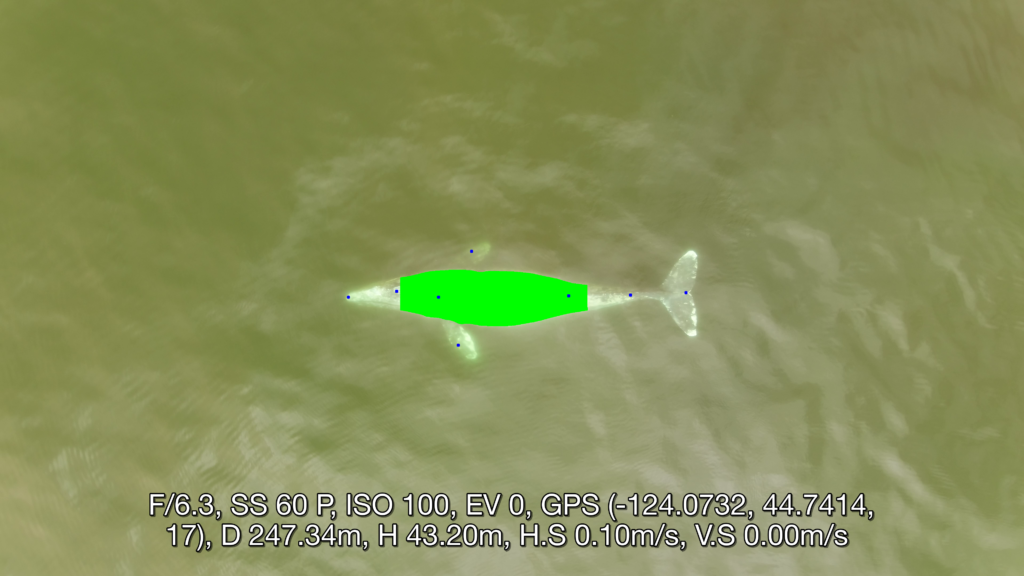
This system is currently in its testing and monitoring phase, but we are rapidly moving toward a publication to disseminate all the tools developed, so stay tuned for the research paper that will explain in detail the methodologies followed on data processing, model training and test results. The following images give a sneak peak of results. Each image  illustrates a frame from a drone video that was  identified and extracted through automation, followed by another automation process that identified important points along the whale’s body and curvature.  The user interface of the system aims to make the user experience intuitive and easy to follow. The deployment is carefully designed to run on different hardwares, with easy monitoring and update options using the latest open source frameworks. The user has to do just two things. First, select the videos for analysis. The system then generates potential frames for photogrammetric analysis (you don’t need to watch 15 mins of drone footage!). Second, the user selects the frame of choice for photogrammetric analysis and waits for the system to give you measurements. Simple! Our goal is for these softwares to be a massive time-saver while  still providing vital, accurate body measurements  to the researchers in record time. Furthermore, an advantage of this approach is that researchers can follow the methods in our to-be-soon-published research paper to make  a few adjustments enabling the software to measure other marine species, thus expanding the impact of this work to many other life forms.  

Did you enjoy this blog? Want to learn more about marine life, research, and conservation? Subscribe to our blog and get a weekly message when we post a new blog. Just add your name and email into the subscribe box below.

Loading

References 

  1. Torres LG, Bird CN, Rodríguez-González F, Christiansen F, Bejder L, Lemos L, Urban R J, Swartz S, Willoughby A, Hewitt J, Bierlich K (2022) Range-Wide Comparison of Gray Whale Body Condition Reveals Contrasting Sub-Population Health Characteristics and Vulnerability to Environmental Change. Front Mar Sci 910.3389/fmars.2022.867258 
  1. Bierlich KC, Kane A, Hildebrand L, Bird CN, Fernandez Ajo A, Stewart JD, Hewitt J, Hildebrand I, Sumich J, Torres LG (2023) Downsized: gray whales using an alternative foraging ground have smaller morphology. Biol Letters 19:20230043 doi:10.1098/rsbl.2023.0043 
  1. Torres et al., (2020). MorphoMetriX: a photogrammetric measurement GUI for morphometric analysis of megafauna. Journal of Open Source Software, 5(45), 1825, https://doi.org/10.21105/joss.01825 
  1. Bird et al., (2020). CollatriX: A GUI to collate MorphoMetriX outputs. Journal of Open Source Software, 5(51), 2328, https://doi.org/10.21105/joss.02328 
  1. Patton, P. T., Cheeseman, T., Abe, K., Yamaguchi, T., Reade, W., Southerland, K., Howard, A., Oleson, E. M., Allen, J. B., Ashe, E., Athayde, A., Baird, R. W., Basran, C., Cabrera, E., Calambokidis, J., Cardoso, J., Carroll, E. L., Cesario, A., Cheney, B. J. … Bejder, L. (2023). A deep learning approach to photo–identification demonstrates high performance on two dozen cetacean species. Methods in Ecology and Evolution, 00, 1–15. https://doi.org/10.1111/2041-210X.14167 
  1. Green, K.M., Virdee, M.K., Cubaynes, H.C., Aviles-Rivero, A.I., Fretwell, P.T., Gray, P.C., Johnston, D.W., Schönlieb, C.-B., Torres, L.G. and Jackson, J.A. (2023), Gray whale detection in satellite imagery using deep learning. Remote Sens Ecol Conserv. https://doi.org/10.1002/rse2.352 
  1. Gray, PC, Bierlich, KC, Mantell, SA, Friedlaender, AS, Goldbogen, JA, Johnston, DW. Drones and convolutional neural networks facilitate automated and accurate cetacean species identification and photogrammetry. Methods Ecol Evol. 2019; 10: 1490–1500. https://doi.org/10.1111/2041-210X.13246 
  1. Fernandez Ajó A, Pirotta E, Bierlich KC, Hildebrand L, Bird CN, Hunt KE, Buck CL, New L, Dillon D, Torres LG (2023) Assessment of a non-invasive approach to pregnancy diagnosis in gray whales through drone-based photogrammetry and faecal hormone analysis. Royal Society Open Science 10:230452 

Do you lose SLEAP over video analysis of gray whale behavior? Not us in the GEMM Lab! 

Celest Sorrentino, University of California, Santa Barbara, Department of Ecological, Evolution, and Marine Biology, GEMM Lab NSF REU intern

Are you thinking “Did anyone proofread this blog beforehand? Don’t they know how to spell SLEEP?”  I completely understand this concern, but not to fear: the spelling of SLEAP is intentional! We’ll address that clickbait in just a moment. 

My name is Celest Sorrentino, a first-generation Latina undergrad who leaped at the opportunity to depart from the beaches of Santa Barbara, California to misty Newport, Oregon to learn and grow as a scientist under the influential guidance of Clara Bird, Dr. Leigh Torres and the powerhouse otherwise known as the GEMM lab. As a recent NSF REU (Research Experience for Undergraduates) intern in the GEMM Lab at Oregon State University, I am thrilled to have the chance to finally let you in on the project Clara, Leigh and I have been working on all summer. Ready for this?

Our project uses a deep-learning platform called SLEAP A.I. ( https://sleap.ai/) that can predict and track multiple animals in video to track gray whale mother calf pairs in drone footage. We also took this project a step further and explored how the distance between a gray whale mother and her calf, a proxy for calf independence, varied throughout the season and by different calf characteristics. 

In this story, we’ve got a little bit for everyone: the dynamic duo of computer vision and machine learning for my data scientist friends, and ecological inquest for my cetacean researcher friends. 

About the Author

Before we begin, I’d like to share that I am not a data scientist. I’ve only ever taken one coding class. I also do not have years of gray whale expertise under my belt (not yet at least!). I’m entering my 5th year at University of California, Santa Barbara as a double major in Ecology and Evolution (BS) as well as Italian Studies (BA). I am sharing this information to convey the feasibility of learning how to use machine-learning as a solution to streamline the laborious task of video analysis, which would permit more time towards answering your own ecological question, as we did here.

Essential Background

Hundreds of Hours of Drone footage

Since 2016, the GEMM Lab has been collecting drone footage of gray whales off the Oregon Coast to observe gray whale behavior in more detail (Torres et al. 2018). Drones have been shown to increase observational time of gray whales by a three-fold (Torres et al. 2018), including the opportunity to revisit the video with fresh eyes at any time one pleases. The GEMM Lab has flow over 500 flights in the past 6 years, including limited footage of gray whale mother-calf pairs. Little is known about gray whale mother-calf dynamics and even less about factors that influence calf development. As we cannot interview hundreds of gray-whale mother-calf pairs to develop a baseline for this information, we explore potential proxies for calf development instead (similar to how developmental benchmarks are used for human growth). 

Distance and Development

During our own life journey, each of us became less and less dependent on our parents to survive on our own. Formulating our first words so that we can talk for ourselves, cracking an egg for our parents so that we can one day cook for ourselves, or even letting go of their hand when crossing the street. For humans, we spend many years with our kin preparing for these moments, but gray whale mother-calf pairs only have a few months after birth until they separate. Gray whale calves are born on their wintering grounds in Baja California, Mexico (around February), migrate north with their mothers to the foraging grounds, and are then weaned during the foraging season (we think around August). This short time with their mother means that they have to become independent pretty quickly (about 6 months!).

Distance between mother and calf can be considered a measure of independence because we would expect increased distance between the pair as calf independence increases. In a study by Nielson et al (2019), distance between Southern Right Whale mother-calf pairs was found to increase as the calf grew, indicating that it can serve as a good proxy for independence. The moment a mother-calf pair separates has not been documented, but the GEMM lab has footage of calves during the foraging season pre-weaning that can be used to investigate this process.  However, video analysis is no easy feat: video analysis can range from post-processing, diligent evaluation, and video documentation (Torres et al. 2018). Although the use of UAS has become a popular method for many researchers, the extensive time required for video analysis is a limitation. As mentioned in Clara’s blog, the choice to pursue different avenues to streamline this process, such as automation through machine learning, is highly dependent on the purpose and the kind of questions a project intends to answer.

SLEAP A.I.

 In a world where modern technology is constantly evolving to cater towards making everyday tasks easier, machine learning leads the charge with its ability for a machine to perform human tasks. Deep learning is a subset of machine learning in which the model learns and adapts the ability to perform a task given a dataset. SLEAP (Social LEAP Estimation of Animal Poses) A.I. is an open-source deep-learning framework created to be able to track multiple subjects, specifically animals, throughout a variety of environmental conditions and social dynamics. In previous cases, SLEAP has tracked animals with distinct morphologies and conditions such as mice interactions, fruit flies engaging in courtship, and bee behavior in a petri dish (Pereira 2020). While these studies show that SLEAP could help make video analysis more efficient, these experiments were all conducted on small animals and in controlled environments. However, large megafauna, such as gray whales, cannot be cultivated and observed in a controlled Petri dish. Could SLEAP learn and adapt to predict and track gray whales in an uncontrolled environment, where conditions are never the same (ocean visibility, sunlight, obstructions)? 

Methods

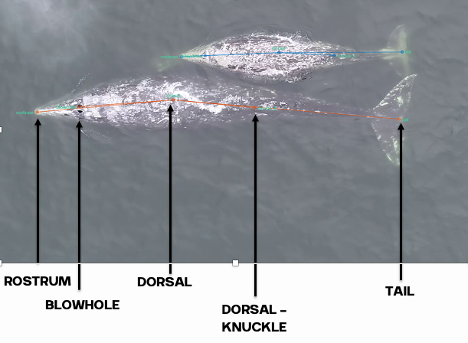
In order to establish a model within SLEAP, we split our mother-calf drone video dataset into training (n=9) and unseen/testing (n=3) videos. Training involves teaching the model to recognize gray whales, and necessitated me to label every four frames using the following labels (anatomical features): rostrum, blowhole, dorsal, dorsal-knuckle, and tail (Fig. 1). Once SLEAP was trained and able to successfully detect gray whales, we ran the model on unseen video. The purpose of using unseen video was to evaluate whether the model could adapt and perform on video it had never seen before, eliminating the need for a labeler to retrain it. 

We then extracted the pixel coordinates for the mom and calf, calculated the distance between their respective dorsal knuckles, and converted the distance to meters using photogrammetry (see KC’s blog  for a great explanation of these methods).  The distance between each pair was then summarized on a daily scale as the average distance and the standard deviation. Standard deviation was explored to understand how variable the distance between mother-calf pair was throughout the day. We then looked at how distance and the standard deviation of distance varied by day of year, calf Total Length (TL), and calf Body Area Index (BAI; a measure of body condition). We hypothesized that these three metrics may be drivers of calf independence (i.e., as the calf gets longer or fatter it becomes more independent from its mother).  

Fig 1. Example of a labelled frame from SLEAP, highlighting labels: rostrum, blowhole, dorsal, dorsal-knuckle, and tail. 

Results

SLEAP A.I. was able to successfully detect and track gray whale mother-calf pairs across all videos (that’s a total of 1318 frames!). When evaluating how the average distance changed across Day of Year, calf Total length, and calf BAI, the plots did not demonstrate the positive relationship we anticipated (Fig 2A). However, when evaluating the standard deviation of distance across Day of Year, calf Total Length, and calf BAI, we did notice that there does appear to be an increase in variability of distance with an increase in Day of Year and calf Total length (Fig 2B)

Fig 2A: Relationship between average distance(m) between each mother and calf (colors represent different named calves) relative to Day of Year, Total length of calf, and BAI of calf. 
Fig 2B: Relationship between standard deviation of  distance(m) between each mother and calf (colors represent different named calves) relative to Day of Year, Total length of calf, and BAI of calf.

Concluding thoughts

These results are monumental! We demonstrated the feasibility to use AI to create a model that can track gray whale pairs in drone footage, which is a fantastic tool that can be applied to updated datasets in the future. As more footage of gray whale mother-calf pairs are collected, this video can be quickly uploaded to SLEAP for model evaluation, predictions can be exported, and results subsequently included in the distance analysis to update our plots and increase our understanding. Our data currently provide a preliminary understanding of how the distance between mother-calf pairs changes with Day of Year, Total length, and BAI, but we are now able to continue updating our dataset as we collect more drone footage. 

I suppose you can say I did mislead you a bit with my title, as I have lost some SLEEP recently. But, not over video analysis per say but rather in the form of inspiration. Inspiration toward expanding my understanding of machine learning so that it can be applied toward answering pressing ecological questions. This project has only propelled me to dig my heels in and investigate further the potential of machine learning to analyze dense datasets for huge knowledge gains.

Fig 3A: Snapshot of Celest working in SLEAP GUI.

Acknowledgements

This project was made possible in partnership by the continuous support by Clara Bird, Dr. Leigh Torres, KC Bierlich, and the entire GEMM Lab!

References

Nielsen, M., Sprogis, K., Bejder, L., Madsen, P., & Christiansen, F. (2019). Behavioural development in southern right whale calves. Marine Ecology Progress Series629, 219–234. https://doi.org/10.3354/meps13125

Pereira, Talmo D., Nathaniel Tabris, Junyu Li, Shruthi Ravindranath, Eleni S. Papadoyannis, Z. Yan Wang, David M. Turner, et al. “SLEAP: Multi-Animal Pose Tracking.” Preprint. Animal Behavior and Cognition, September 2, 2020. https://doi.org/10.1101/2020.08.31.276246.

Torres, Nieukirk, S. L., Lemos, L., & Chandler, T. E. (2018). Drone Up! Quantifying Whale Behavior From a New Perspective Improves Observational Capacity. Frontiers in Marine Science, 5. https://doi.org/10.3389/fmars.2018.00319