Measure faster! New tools for automatically obtaining body length and body condition of whales from drone videos

Dr. KC Bierlich, Postdoctoral Scholar, OSU Department of Fisheries, Wildlife, & Conservation Sciences, Geospatial Ecology of Marine Megafauna Lab

Monitoring the body length and body condition of animals can help provide important information on the health status of individuals and their populations, and can even serve as early warning signs if a population is adapting to habitat changes or is at risk of collapse (Cerini et al., 2023). As discussed in previous blogs, drone-based photogrammetry provides a method for non-invasively collecting important size measurements of whales, such as for detecting differences in body condition and length between populations, and even diagnosing pregnancy. Thus, using drones to collect measurement data on the growth, body condition, and pregnancy rates of whales can help expedite population health assessments to elicit conservation and management actions.

However, it takes a long time to manually measure whales filmed in drone imagery. For every video collected, an analyst must carefully watch each video and manually select frames with whales in good positions for measuring (flat and straight at the surface). Once frames are selected, each image must then be ranked and filtered for quality before finally measuring using a photogrammetry software, such as MorphoMetriX. This entire manual processing pipeline ultimately delays results, which hinders the ability to rapidly assess population health. If only there was a way to automate this process of obtaining measurements…

Well now there is! Recently, a collaboration between researchers from the GEMM Lab, CODEX, and OSU’s Department of Engineering and Computer Science published a manuscript introducing automated methods for obtaining body length and body condition measurements (Bierlich et al., 2024). The manuscript describes two user-friendly models: 1) “DeteX”, which automatically detects whales in drone videos to output frames for measuring and 2) “XtraX”, which automatically extracts body length and body condition measurements from input frames (Figure 1). We found that using DeteX and XtraX produces measurements just as good as manual measurement (Coefficient of Variation < 5%), while substantially reducing the processing time by almost 90%. This increased efficiency not only saves hours (weeks!) of manual processing time, but enables more rapid assessments of populations’ health.

Future steps for DeteX and XtraX are to adapt the models so that measurements can be extracted from multiple whales in a single frame, which could be particularly useful for analyzing images containing mothers with their calf. We also look forward to adapting DeteX and XtraX to accommodate more species. While DeteX and XtraX was trained using only gray whale imagery, we were pleased to see that these models performed well when trialing on imagery of a blue whale (Figure 2). These results are encouraging because it shows that the models can be adapted to accommodate other species with different body shapes, such as belugas or beaked whales, with the inclusion of more training data.

We are excited to share these methods with the drone community and the rest of this blog walks through the features and steps for running DeteX and XtraX to make them even easier to use.
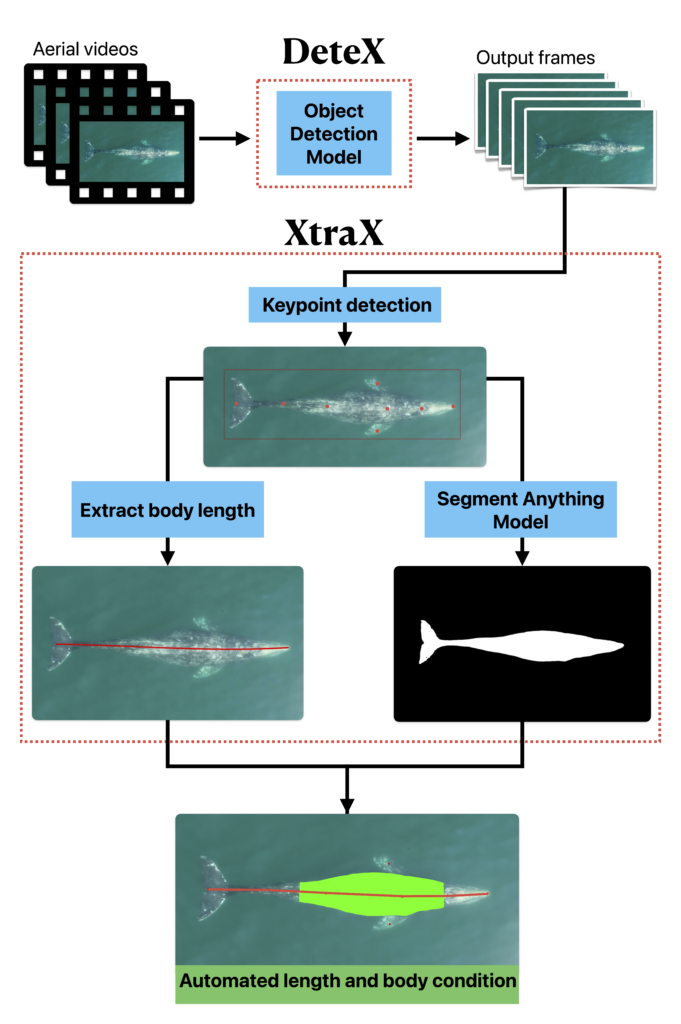
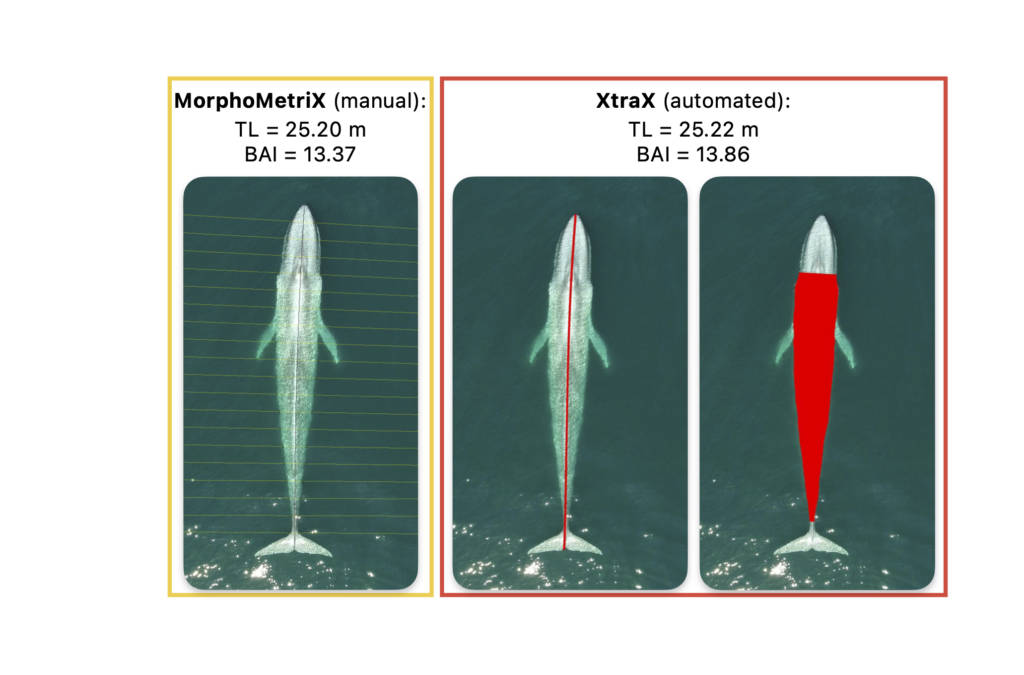
Figure 1. Overview of DeteX and XtraX for automatically obtaining body length and body condition measurements from drone-based videos.

Figure 2. Example comparing manual (MorphoMetriX) vs. automated (XtraX) measurements of a blue whale.

DeteX and XtraX walkthrough

Both DeteX and XtraX are web-based applications designed to be intuitive and user-friendly. Instructions to install and run DeteX and XtraX are available on the CODEX website. Once DeteX is launched, the default web-browser automatically opens the application where the user is asked to select 1) the folder containing the drone-based videos to analyze and 2) the folder to save output frames (Figure 3). Then, the user can select ‘start’ to begin. The default for DeteX is set to analyze the entire video from start to finish at one frame per second; if recording a video at 30 frames per second, the last (or 30th) frame is processed for each second in the video. There is also a “finetune” version of DeteX that offers users much more control, where they can change these default settings (Figure 4). For example, users can change the defaults to increase the number of frames processed per second (i.e., 10 instead of 1), to target a specific region in the video rather than the entire video, and adjust the “detection model threshold” to change the threshold of confidence the model has for detecting a whale. These specific features for enhanced control may be particularly helpful when there is a specific surfacing sequence that a user wants to have more flexibility in selecting specific frames for measuring.

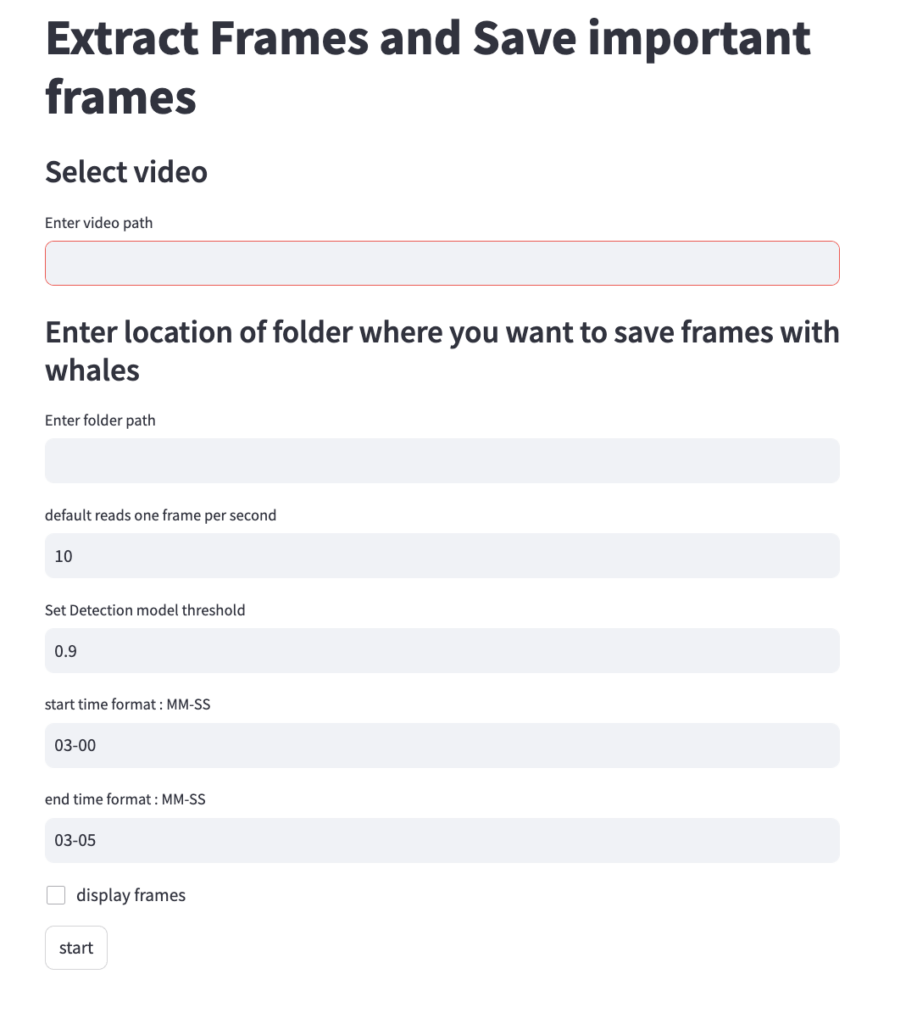
Figure 3. A screenshot of the DeteX web-based application interface.

Figure 4. The DeteX “finetune” version provides more control for users to change the default settings to target a specific region in the video (here between 3 min 00 sec and 3 min 05 sec), change the number of frames per second to process (now 10 per second), and the detection threshold, or level of confidence for identifying a whale in the video (now a higher threshold at 0.9 instead of the default at 0.8).

Once output frames are generated by DeteX, the user can select which frames to input into XtraX to measure. Once XtraX is launched, the default web-browser automatically opens the application where the user is asked to select 1) the folder containing the frames to measure and 2) the folder to save the output measurements. If the input frames were generated using DeteX, the barometric altitude is automatically extracted from the file name (note, that altitudes collected from a LiDAR altimeter can be joined in the XtraX output .csv file to then calculate measurements using this altitude). The image width (pixels) is automatically extracted from the input frame metadata. Users can then input specific camera parameters, such as sensor width (mm) and the focal length of the camera (mm), the launch height of the drone (i.e., if launching from hand when on a boat), and the region along the body to measure body condition (Figure 5). This region along the body is called the Head-Tail range and is identified as the area where most lipid storage takes place to estimate body condition. To run, the user selects “start”. XtraX then will output a .png file of each frame showing the keypoints (used for the body length measurement) and the shaded region (used for the body condition estimate) along the body to help visual results so users can filter for quality (Figure 6). XtraX also outputs a single .csv containing all the measurements (in meters and pixels) with their associated metadata.
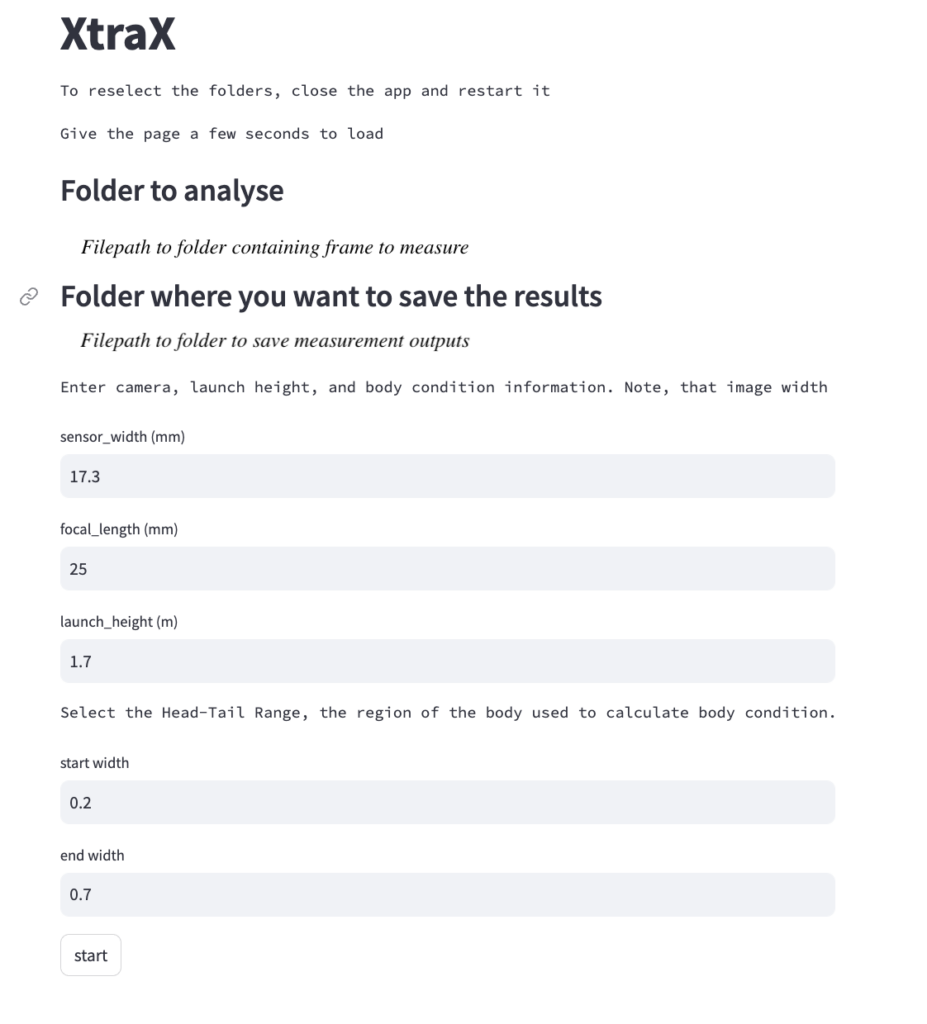
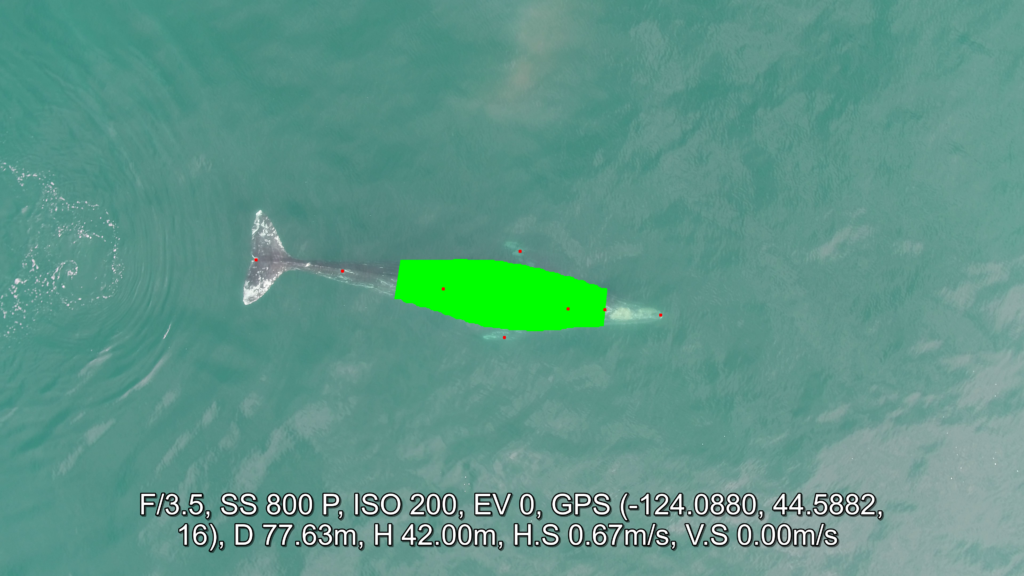
Figure 5. User interface for XtraX. The user specifies a folder containing the images to measure and a folder to save the outputs measurements, and then can enter in camera specifications, the launch height of the drone (to be added to the barometer altitude) and the range of body widths to include in the body condition measurement (in the case, 0.2 and 0.7 correspond to body region between widths 20% and 70% of the total length, respectively).

Figure 6. Example output from XtraX showing (red) keypoints along the body to measure body length and the (green) shaded region used for body condition.

We hope this walkthrough is helpful for researchers interested in using and adapting these tools for their projects. There is also a video tutorial available online. Happy (faster) measuring!

References

Bierlich, K. C., Karki, S., Bird, C. N., Fern, A., & Torres, L. G. (2024). Automated body length and body condition measurements of whales from drone videos for rapid assessment of population health. Marine Mammal Science, e13137. https://doi.org/10.1111/mms.13137

Cerini, F., Childs, D. Z., & Clements, C. F. (2023). A predictive timeline of wildlife population collapse. Nature Ecology & Evolution, 7(3), 320–331. https://doi.org/10.1038/s41559-023-01985-2

Disentangling the whys of whale entanglement

By Lindsay Wickman, Postdoctoral Scholar, Oregon State University Department of Fisheries, Wildlife, and Conservation Sciences, Geospatial Ecology of Marine Megafauna Lab

Previously on our blog, we mentioned  the concerning rise of humpback whale (Megaptera novaeangliae) entanglement in fishing gear on the US West Coast (see here and here). Gaining an improved understanding of the rate of entanglement and risk factors of humpback whales in Oregon are primary aims of the GEMM Lab’s SLATE and OPAL projects. In this post, I will discuss some reasons why whales get entangled. With whales generally regarded as intelligent, it is understandable to wonder why whales are unable to avoid these underwater obstacles.

Figure 1. Wrapping scars like these at the base of the flukes indicate this humpback whale was previously entangled. Photo taken under NOAA/NMFS permit #21678 to John Calambokidis.

Fishing lines are hard to detect underwater

Water clarity, depth, and time of day can all influence how visible a fishing line is underwater.  Since baleen whales lack the ability to discriminate color (Levenson et al., 2000; Peichl et al. 2001), the brightly colored yellow and red ropes that make it easier for fishermen to find their gear make it harder for whales to see it underwater. White or black ropes may stand out better for whales (Kot et al., 2012), but there’s not enough evidence yet to suggest they reduce entanglement rates.

Whales have excellent hearing, but this may still not be enough to ensure detection of underwater ropes. Even if whales can hear water currents flowing over the rope, this noise can easily be masked by other sounds like weather, surf, and passing boats. Fishing gear also has a weak acoustic signature (Leatherwood et al., 1977), or it may be at a frequency not heard by whales. So even though whales produce and listen for sounds to help locate prey (Stimpert et al., 2007) and communicate, any sound produced by fishing lines may not be sufficient to alert whales to its presence.

There are very few studies that examine the behavior of whales around fishing gear, but a study of minke whales (Balaenoptera acutorostrata) by Kot et al. (2017) provides an exception. Researchers observed whales slowing down as they approached their test gear, and speeding up once they were past it (Kot et al., 2017). While the scope of the study was too small to generalize about whales’ ability to detect fishing gear, it does suggest whales can detect fishing gear, at least some of the time. There is also likely some individual variation in this skillset. Less experienced, juvenile humpback whales, for example, may be at a higher risk of entanglement than adults (Robbins, 2012).

Distracted driving?

Just like distracted drivers are more likely to crash when texting or eating, whales may be more likely to get entangled when they are preoccupied with behaviors like feeding or socializing.

Evidence suggests feeding is especially risky for entanglement. An analysis of entanglements in the North Atlantic found that almost half (43%) of the humpback whales were entangled at the mouth, and the mouth was also the most common attachment point for North Atlantic right whales (Eubalaena glacialis, 77%; Johnson et al., 2005). In a study of minke whales in the East Sea of Korea, 80% of entangled whales had recently fed (Song et al, 2010). In many cases, entanglement at the mouth can severely restrict feeding ability, resulting in emaciation and/or death (Moore and van der Hoop, 2012).

Figure 2. A North Atlantic right whale with fishing gear attached at the mouth. Photo credit: NOAA Photo Library.

More whales, more heat waves, and more entanglements

On the US West Coast, the number of humpback whales has been increasing since the end of whaling (e.g., Barlow et al, 2011). With more whales in our waters, it makes sense that the number of entanglements will increase. Still, a larger population size is probably not the only reason for increasing entanglements.

Climate change, for example, may place whales in the areas with dense fishing gear much more often. A recent example of this was during 2014–2016, when a heatwave on the US West Coast led to a cascade of events that increased the likelihood of whale entanglements in California waters (Santora et al., 2020).

The increased temperatures led to a bloom of toxic diatoms, which delayed the commercial fishing season for Dungeness crabs in California. Unfortunately, the delay caused fishing to resume right as high numbers of whales were arriving from their annual migration from their breeding grounds. The wider ecosystem effects of the heat wave also meant humpback whales were feeding closer to shore — right where most crab pots are set. The combination of both the fisheries’ timing and the altered distribution of whales contributed to an unprecedented number of entanglements (Santora et al., 2020).

Whale entanglement is a concerning issue for fishermen, conservationists, and wildlife managers. By disentangling some of the whys of entanglement for humpback whales in Oregon, we hope our research can contribute to improved management plans that benefit both whales and the continuity of the Dungeness crab fishery. To learn more about these projects, visit the SLATE and OPAL pages, and subscribe to the blog for more updates.

Did you enjoy this blog? Want to learn more about marine life, research, and conservation? Subscribe to our blog and get a weekly message when we post a new blog. Just add your name and email into the subscribe box below.

Loading

References

Barlow, J., Calambokidis, J., Falcone, E.A., Baker, C.S., Burdin, A.M., Clapham, P.J., Ford, J.K., Gabriele, C.M., LeDuc, R., Mattila, D.K. and Quinn, T.J. (2011). Humpback whale abundance in the North Pacific estimated by photographic capture‐recapture with bias correction from simulation studies. Marine Mammal Science, 27(4), 793-818.

Johnson, A., Salvador, G., Kenney, J., Robbins, J., Kraus, S., Landry, S., and Clapham, P. (2005). Fishing gear involved in entanglements of right and humpback whales. Marine Mammal Science, 21, 635–645.

Kot, B.W., Sears, R., Anis, A., Nowacek, D.P., Gedamke, J. and Marshall, C.D. (2012). Behavioral responses of minke whales (Balaenoptera acutorostrata) to experimental fishing gear in a coastal environment. Journal of Experimental Marine Biology and Ecology, 413, pp.13-20.

Leatherwood, J.S., Johnson, R.A., Ljungblad, D.K., and Evans, W.E. (1977). Broadband Measurements of Underwater Acoustic Target Strengths of Panels of Tuna Nets. Naval Oceans Systems Center, San Diego, CA Tech, Rep. 126.

Levenson, D.H., Dizon, A., and Ponganis, P.J. (2000). Identification of loss-of-function mutations within the short wave-length sensitive cone opsin genes of baleen and odontocete cetaceans. Investigative Ophthalmology & Visual Science, 41, S610.

Moore, M. J., and van der Hoop, J. M. (2012). The painful side of trap and fixed net fisheries: chronic entanglement of large whales. Journal of Marine Sciences, 2012.

Peichl, L., Behrmann, and G., Kröger, R.H.H. (2001). For whales and seals the ocean is not blue: a visual pigment loss in marine mammals. European Journal of Neuroscience, 13, 1520–1528.

Robbins J. (2012). Scar-based inference Into Gulf of Maine humpback whale entanglement: 2010. Report EA133F0 9CN0253 to the Northeast Fisheries Science Center, National Marine Fisheries Service. Center for Coastal Studies, Provincetown, MA.

Santora, J. A., Mantua, N. J., Schroeder, I. D., Field, J. C., Hazen, E. L., Bograd, S. J., Sydeman, W. J., Wells, B. K., Calambokidis, J., Saez, L., Lawson, D., and Forney, K. A. (2020). Habitat compression and ecosystem shifts as potential links between marine heatwave and record whale entanglements. Nature Communications, 11(1).

Song, K.-J., Kim, Z.G., Zhang, C.I., Kim, Y.H. (2010). Fishing gears involved in entanglements of minke whales (Balaenoptera acutorostrata) in the east sea of Korea. Marine Mammal Science, 26, 282–295.

Stimpert, A.K., Wiley, D.N., Au, W.W.L., Johnson, M.P., Arsenault, R. (2007). “Megapclicks”: acoustic click trains and buzzes produced during night-time foraging of humpback whales (Megaptera novaeangliae). Biology Letters, 3, 467–470.

Good enough to eat: Dynamics of krill prey quality

By Rachel Kaplan, PhD candidate, Oregon State University College of Earth, Ocean, and Atmospheric Sciences and Department of Fisheries, Wildlife, and Conservation Sciences, Geospatial Ecology of Marine Megafauna Lab

The Northern California Current region feeds a taxonomically diverse suite of top predators, including numerous species of seabirds, fish, and marine mammals. Baleen whales such as blue, fin, and humpback whales make this productive area a long stop on their seasonal migration, drawn in large part by abundant krill, a shrimp-like zooplankton that serves as an important prey item.

Aspects of both quality and quantity determine whether a prey resource is advantageous for a predator. In the case of whales, sheer biomass is key. It takes a lot of tiny krill to sustain a large whale – literally tons for a blue whale’s daily diet (Goldbogen et al., 2015). Baleen whales are such big eaters that they actually reshape the ocean ecosystem around them (Savoca et al., 2021).

Figure 1. A blue whale lunge feeds on a shallow krill swarm. Read more here.

But the quality of prey, in addition to its quantity, is crucial to ener­getic profitability, and baleen whales must weigh both elements in their foraging decisions. The outcome of those calculations manifest in the diverse feeding strategies that whales employ across ecosystems. In the California Current region, blue whales prefer­entially target the larger, more lipid-rich krill Thysanoessa spinifera (Fiedler et al., 1998). In Antarctica, humpback whales target larger and reproductive krill with higher energetic value, if these extra-juicy varieties are available (Cade et al., 2022). Prey-switching, a strategy in which animals target prey based on relative availability, allows fin whales to  have a more broad diet than blue whales, which are obligate krill predators.

So, what makes krill of high enough quality for a whale to pursue – or low enough quality to ignore? Krill are widely distributed across the NCC region, so why do foraging whales target one krill patch over another?

That whale of a question combines behavior, foraging theory, biochemistry, physics, climate, and more. One key aspect is the composition of a given prey item. Just as for human diet, nutrients, proteins, and calories are where the rubber hits the road in an animal’s energetic budget. The energy density of prey items sets the cost of living for cetaceans, and shapes the foraging strategies they use (Goldbogen et al., 2015; Spitz et al., 2012). In the NCC, T. spinifera krill are more lipid-rich than Euphausia pacifica (Fisher et al., 2020). Pursuing more energy dense prey increases the profitability of a given mouthful and helps a whale offset the energy expended to earn it, including the costly hunt for prey on the foraging grounds (Videsen et al., 2023).

Krill are amazingly dynamic animals in their own right, and they have evolved life history strategies to accommodate a broad range of ocean conditions. They can even exhibit “negative growth,” shrinking their body length in response to challenging conditions or poor food quality. This plasticity in body size can allow krill to survive lean times – but from the perspective of a hungry whale, this strategy also shrinks the available biomass into smaller packages (Robertson & Bjorkstedt, 2020).

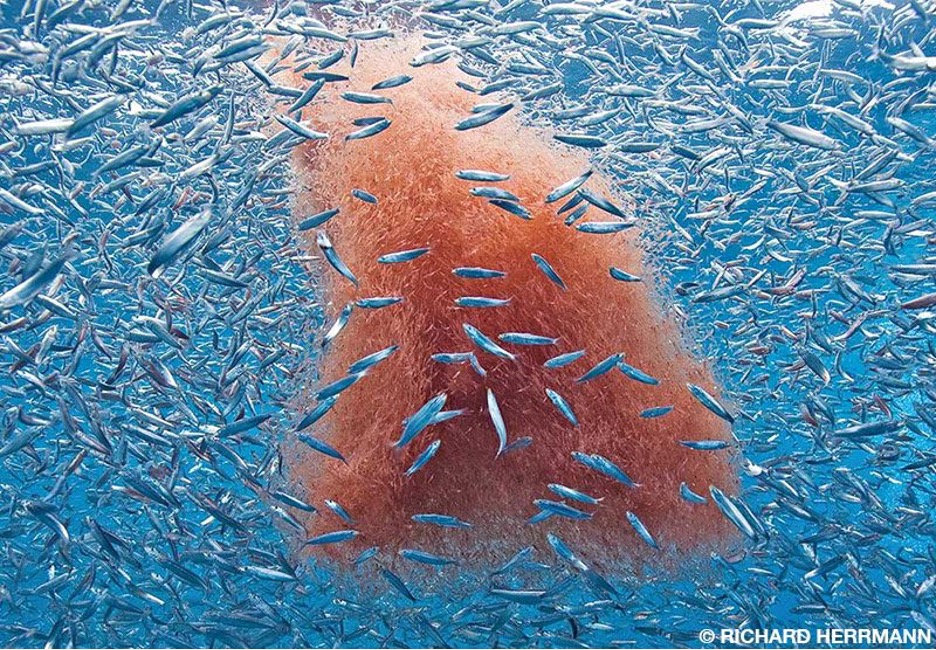
One reason why krill are such advantageous prey type for baleen whales is their tendency to aggregate into dense swarms that may contain hundreds of thousands of individuals. The large body size of baleen whales requires them to feed on such profitable patches (Benoit-Bird, 2024). The packing density of krill within aggregations determines how many a whale can capture in one mouthful, and drives patch selection, such as for blue whales in Antarctica (Miller 2019).

Figure 2. The dense swarms formed by krill make them a prime target for many predators, including these juvenile Pacific sardines. (Photo: Richard Herrmann)

However, even the juiciest, densest krill won’t benefit a foraging whale if the energy required to consume it outweighs the gains. The depth of krill in the water column shapes the acrobatic foraging maneuvers blue whales use to feed (Goldbogen et al., 2015), and is a key driver of patch selection (Miller et al., 2019). The horizontal distance between the whale and a new krill patch is important too. Foraging humpback whales adapt their movements to the hierarchical structure of the preyfield, and feeding on neighboring prey schools can reduce the energy and time expended during interpatch travel, increasing net foraging gain (Kirchner et al., 2018).

Prey quality is dynamic, shaped by environmental conditions, extreme events, and climate change processes (Gomes et al., 2024). We can’t yet fully predict how change will alter prey and predator relationships in the NCC region (Muhling et al., 2020), making every step toward understanding prey dynamics relative to environmental variability key to anticipating how whales will fare in an unknown future (Hildebrand et al., 2021). If you are what you eat, then learning more about krill prey quality will give us unique insights into the baleen whales that come from far and wide to the NCC foraging grounds.

Loading

References

Benoit-Bird, K. J. (2024). Resource Patchiness as a Resolution to the Food Paradox in the Sea. The American Naturalist, 203(1), 1–13. https://doi.org/10.1086/727473

Cade, D. E., Kahane-Rapport, S. R., Wallis, B., Goldbogen, J. A., & Friedlaender, A. S. (2022). Evidence for Size-Selective Predation by Antarctic Humpback Whales. Frontiers in Marine Science, 9, 747788. https://doi.org/10.3389/fmars.2022.747788

Fiedler, P. C., Reilly, S. B., Hewitt, R. P., Demer, D., Philbrick, V. A., Smith, S., Armstrong, W., Croll, D. A., Tershy, B. R., & Mate, B. R. (1998). Blue whale habitat and prey in the California Channel Islands. Deep Sea Research Part II: Topical Studies in Oceanography, 45(8–9), 1781–1801. https://doi.org/10.1016/S0967-0645(98)80017-9

Fisher, J. L., Menkel, J., Copeman, L., Shaw, C. T., Feinberg, L. R., & Peterson, W. T. (2020). Comparison of condition metrics and lipid content between Euphausia pacifica and Thysanoessa spinifera in the northern California Current, USA. Progress in Oceanography, 188. https://doi.org/10.1016/j.pocean.2020.102417

Goldbogen, J. A., Hazen, E. L., Friedlaender, A. S., Calambokidis, J., DeRuiter, S. L., Stimpert, A. K., & Southall, B. L. (2015). Prey density and distribution drive the three‐dimensional foraging strategies of the largest filter feeder. Functional Ecology, 29(7), 951–961. https://doi.org/10.1111/1365-2435.12395

Gomes, D. G. E., Ruzicka, J. J., Crozier, L. G., Huff, D. D., Brodeur, R. D., & Stewart, J. D. (2024). Marine heatwaves disrupt ecosystem structure and function via altered food webs and energy flux. Nature Communications, 15(1), 1988. https://doi.org/10.1038/s41467-024-46263-2

Hildebrand, L., Bernard, K. S., & Torres, L. G. (2021). Do Gray Whales Count Calories? Comparing Energetic Values of Gray Whale Prey Across Two Different Feeding Grounds in the Eastern North Pacific. Frontiers in Marine Science, 8. https://doi.org/10.3389/fmars.2021.683634

Kirchner, T., Wiley, D., Hazen, E., Parks, S., Torres, L., & Friedlaender, A. (2018). Hierarchical foraging movement of humpback whales relative to the structure of their prey. Marine Ecology Progress Series, 607, 237–250. https://doi.org/10.3354/meps12789

Miller, E. J., Potts, J. M., Cox, M. J., Miller, B. S., Calderan, S., Leaper, R., Olson, P. A., O’Driscoll, R. L., & Double, M. C. (2019). The characteristics of krill swarms in relation to aggregating Antarctic blue whales. Scientific Reports, 9(1), 16487. https://doi.org/10.1038/s41598-019-52792-4

Muhling, B. A., Brodie, S., Smith, J. A., Tommasi, D., Gaitan, C. F., Hazen, E. L., Jacox, M. G., Auth, T. D., & Brodeur, R. D. (2020). Predictability of Species Distributions Deteriorates Under Novel Environmental Conditions in the California Current System. Frontiers in Marine Science, 7. https://doi.org/10.3389/fmars.2020.00589

Robertson, R. R., & Bjorkstedt, E. P. (2020). Climate-driven variability in Euphausia pacifica size distributions off northern California. Progress in Oceanography, 188. https://doi.org/10.1016/j.pocean.2020.102412

Savoca, M. S., Czapanskiy, M. F., Kahane-Rapport, S. R., Gough, W. T., Fahlbusch, J. A., Bierlich, K. C., Segre, P. S., Di Clemente, J., Penry, G. S., Wiley, D. N., Calambokidis, J., Nowacek, D. P., Johnston, D. W., Pyenson, N. D., Friedlaender, A. S., Hazen, E. L., & Goldbogen, J. A. (2021). Baleen whale prey consumption based on high-resolution foraging measurements. Nature, 599(7883), 85–90. https://doi.org/10.1038/s41586-021-03991-5

Spitz, J., Trites, A. W., Becquet, V., Brind’Amour, A., Cherel, Y., Galois, R., & Ridoux, V. (2012). Cost of Living Dictates what Whales, Dolphins and Porpoises Eat: The Importance of Prey Quality on Predator Foraging Strategies. PLoS ONE, 7(11), e50096. https://doi.org/10.1371/journal.pone.0050096

Videsen, S. K. A., Simon, M., Christiansen, F., Friedlaender, A., Goldbogen, J., Malte, H., Segre, P., Wang, T., Johnson, M., & Madsen, P. T. (2023). Cheap gulp foraging of a giga-predator enables efficient exploitation of sparse prey. Science Advances, 9(25), eade3889. https://doi.org/10.1126/sciadv.ade3889

Kelp to whales: New GEMM Lab publication explores indirect effects of a classic trophic cascade on gray whales

By Lisa Hildebrand, PhD candidate, OSU Department of Fisheries, Wildlife, & Conservation Sciences, Geospatial Ecology of Marine Megafauna Lab

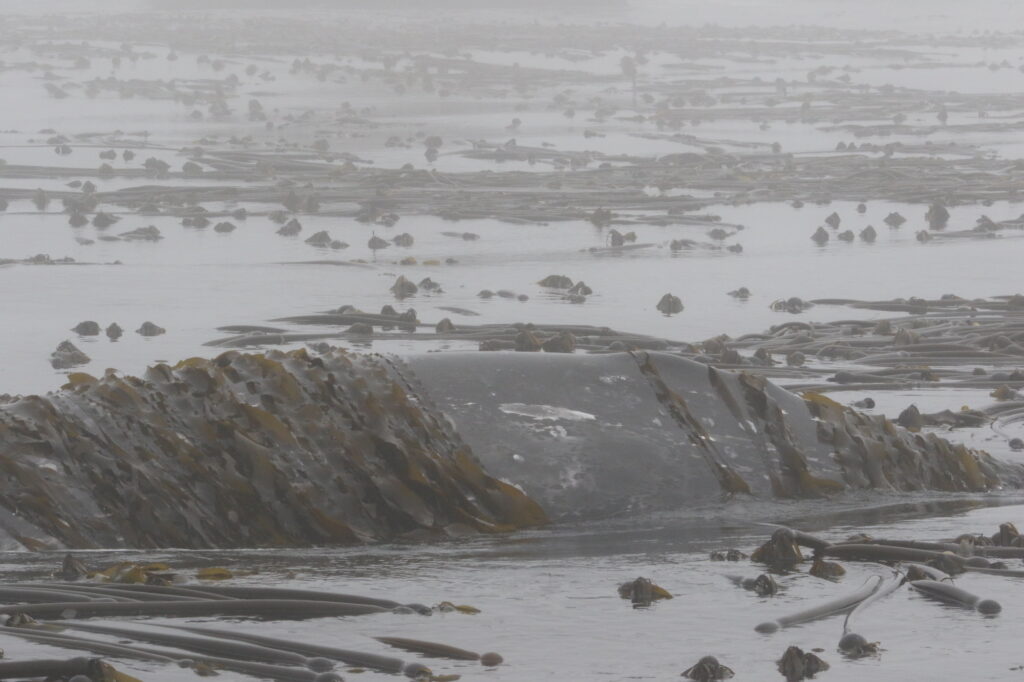
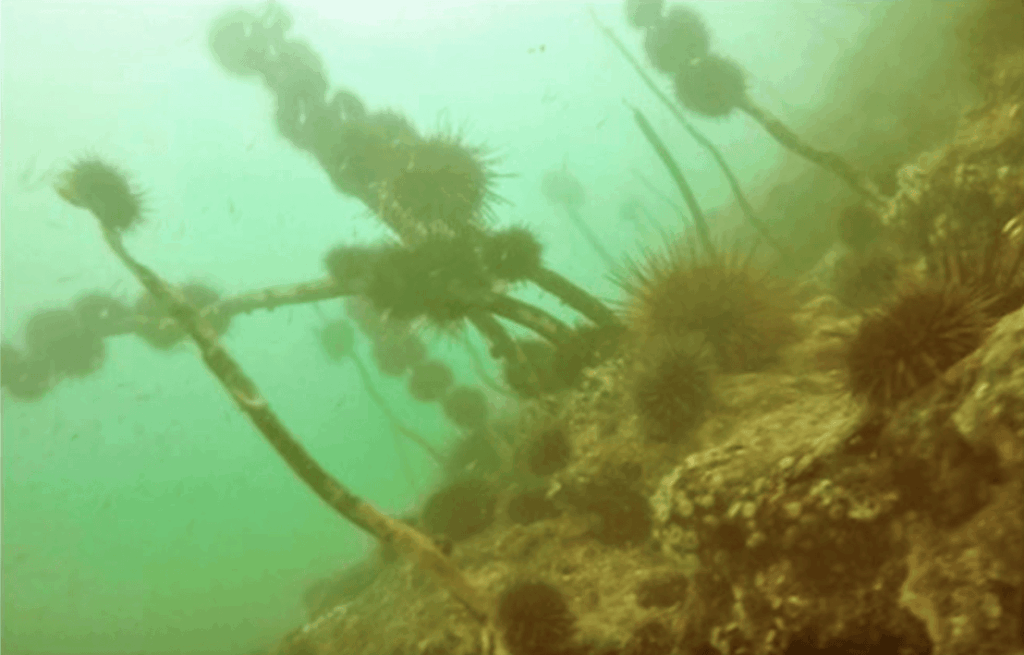
As many of our avid readers already know, the Pacific Coast Feeding Group (PCFG) of gray whales employs a wide range of foraging tactics to feed on a number of different prey items in various benthic substrate types (Torres et al. 2018). One example foraging tactic is when PCFG whales, particularly when they are in the Oregon portion of their feeding range, forage on mysid shrimp in and near kelp beds on rocky reefs. We have countless drone video clips of whales weaving their large bodies through kelp and many photographs of whales coming to the surface to breath completely covered in kelp, looking more like a sea monster than a whale (Figure 1). So, when former intern Dylan Gregory made an astute observation during the 2018 TOPAZ/JASPER field season in Port Orford about a GoPro video the field team collected that showed many urchins voraciously feeding on an unhealthy-looking kelp stalk (Figure 2a), it made us wonder if and how changes to kelp forests may impact gray whales. 

Fig 1. Gray whale surfacing in a large kelp patch. Photograph captured under NOAA/NMFS research permit #16111. Source: GEMM Lab.

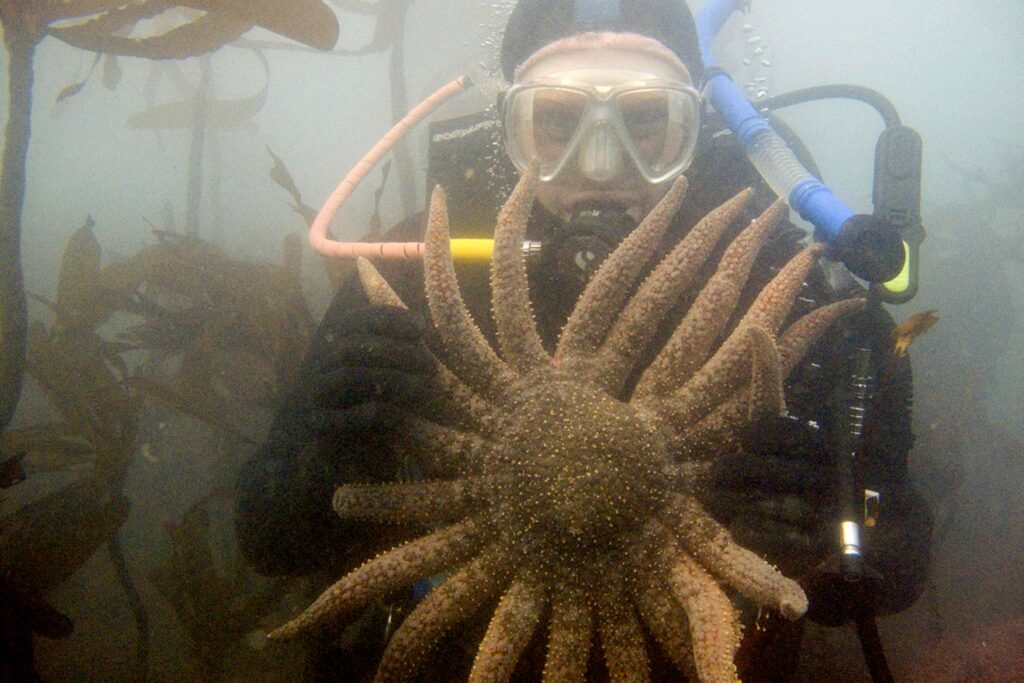
Kelp forests are widely used as a marine example of trophic cascades. Trophic cascades are trigged by the addition/removal of a top predator to/from a system, which causes changes further down the trophic chain. Sea urchins are common inhabitants of kelp forests and in a balanced, healthy system, urchin populations are regulated by predators as they behave cryptically by hiding in crevices in the reef and individual urchins feed passively on drift kelp that breaks off from larger plants. When we think about who controls urchins in kelp forests, we probably think of sea otters first. However, sea otters have been absent from Oregon waters for over a century (Kone et al. 2021), so who controls urchins here? The answer is the sunflower sea star (Figure 2b). Sunflower sea stars are large predators with a maximum arm span of up to 1 m! Unfortunately, a disease epidemic that started in 2013 known as sea star wasting disease caused 80-100% population decline of sunflower sea stars along the coastline between Mexico and Alaska (Harvell et al. 2019). Shortly thereafter, a record-breaking marine heatwave caused warm, nutrient-poor water conditions to persist in the northeast Pacific Ocean from 2014 to 2016 (Jacox et al. 2018). These co-occurring stressors caused unprecedented and long-lasting decline of a previously robust kelp forest in northern California (Rogers-Bennett & Catton 2019), where sea otters are also absent. Given the biogeographical similarity between southern Oregon and northern California and the observation made by Dylan in 2018, we decided to undertake an analysis of the eight years of data collected during the TOPAZ/JASPER project in Port Orford starting in 2016, to investigate the trends of four trophic levels (purple sea urchins, bull kelp, zooplankton, and gray whales) across space and time. The results of our study were published last week in Scientific Reports and I am excited to be able to share them with you today.

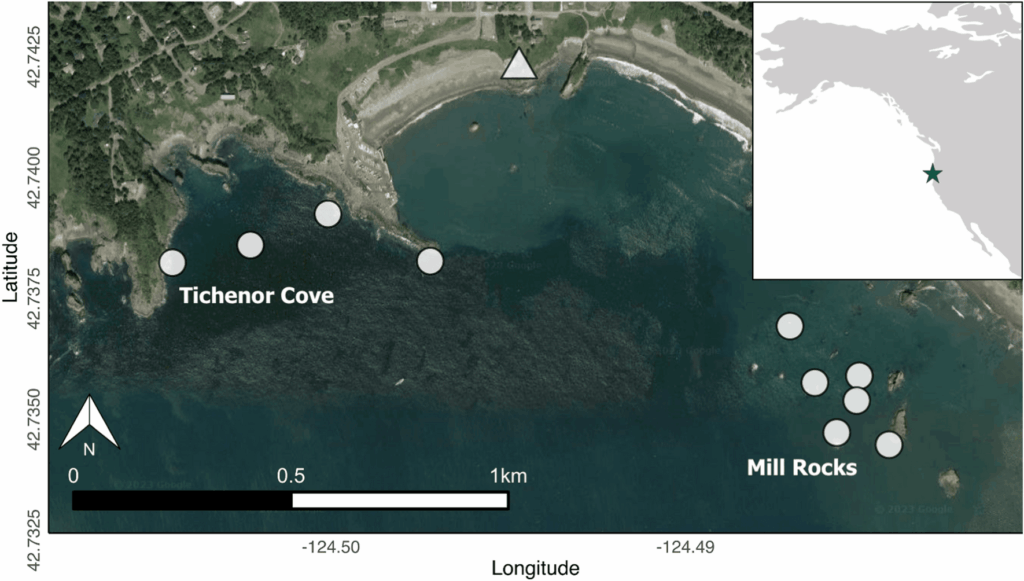
Every day during the TOPAZ/JASPER field season, two teams head out to collect data. One team is responsible for tracking gray whales from shore using a theodolite, while the other team heads out to sea on a tandem research kayak to collect prey data (Figure 3). The kayak team samples prey in multiple ways, including dropping a GoPro camera at each sampling station. When the project was first developed, the original goal of these GoPro videos was to measure the relative abundance of prey. Since the sampling stations occur on or near reefs that are shallow with dense surface kelp, traditional methods to assess prey density, such as using a boat with an echosounder, are not suitable options. Instead, GEMM Lab PI Leigh Torres, together with the first Master’s student on this project Florence Sullivan, developed a method to score still images extracted from the GoPro videos to estimate relative zooplankton abundance. However, after we saw those images of urchins feeding on kelp in 2018, we decided to develop another protocol that allowed us to use these GoPro videos to also characterize sea urchin coverage and kelp condition. Once we had occurrence values for all four species, we were able to dig into the spatiotemporal trends.

Figure 3. Map of Port Orford, USA study area showing the 10 kayak sampling stations (white circles) within the two study sites (Tichenor Cove and Mill Rocks). The white triangle represents the cliff top location where theodolite tracking of whales was conducted. Figure and caption taken from Hildebrand et al. 2024.

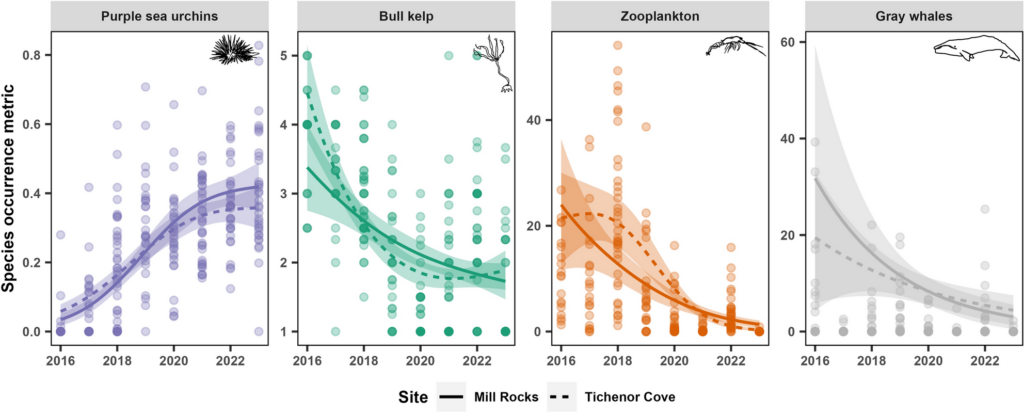
When we examined the trends for each of the four study species across years, we found that purple sea urchin coverage in both of our study sites within Port Orford increased dramatically within our study period (Figure 4). In 2016, the majority of our sampled stations contained no visible urchins. However, by 2020, we detected urchins at every sampling station. For kelp, we saw the reverse trend; in 2016 all sampling stations contained kelp that was healthy or mostly healthy. But by 2019, there were many stations that contained kelp in poor health or where kelp was absent entirely. Zooplankton and gray whales experienced similar temporal trends as the kelp, with their occurrence metrics (abundance and foraging time, respectively) having higher values at the start of our study period and declining steadily during the eight years. While the rise in urchin coverage across our study area occurred concurrently with the decrease in kelp condition, zooplankton abundance, and gray whale foraging, we wanted to explicitly test how these species are related to one another based on prior ecological knowledge.

Figure 4. Temporal trends of purple sea urchin coverage, bull kelp condition, relative zooplankton abundance, and gray whale foraging time by year across the eight-year study period (2016–2023), from the generalized additive models. The colored ribbons represent approximate 95% confidence intervals. Line types represent the two study sites, Mill Rocks (MR; solid) and Tichenor Cove (TC; dashed). All curves are statistically significant (P < 0.05). Figure and caption taken from Hildebrand et al. 2024.

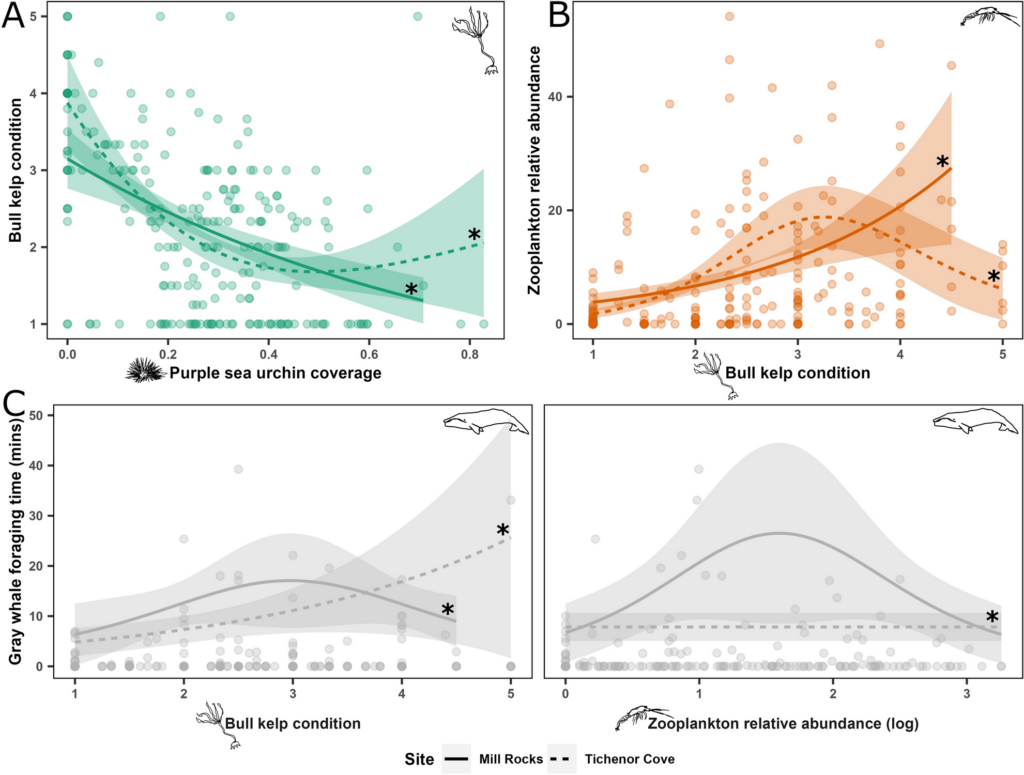
To test whether urchin coverage had an effect on kelp condition, we hypothesized that increased urchin coverage would be correlated with reduced kelp condition based on the decades of research that has established a negative relationship between the two when a trophic cascade occurs in kelp forest systems. Next, we wanted to test whether kelp condition had an effect on zooplankton abundance and hypothesized that increased kelp condition would be correlated with increased zooplankton abundance. We based this hypothesis on several pieces of prior knowledge, particularly as they pertain to mysid shrimp: (1) high productivity within kelp beds provides food for mysids, including kelp zoospores (VanMeter & Edwards 2013), (2) current velocities are one third slower inside kelp beds compared to outside (Jackson & Winant 1983), which might support the retention of mysids within kelp beds since they are not strong swimmers, and (3) the kelp canopy may serve as potential protection for mysids from predators (Coyer 1984). Finally, we wanted to test whether both kelp condition and zooplankton abundance have an effect on gray whales and we hypothesized that increased values for both would be correlated with increased gray whale foraging time. While the reasoning behind our hypothesized correlation between zooplankton prey and gray whales is obvious (whales eat zooplankton), the reasoning behind the kelp-whale connection may not be. We speculated that since kelp habitat may aggregate or retain zooplankton prey, gray whales may use kelp as an environmental cue to find prey patches. 

When we tested our hypotheses through generalized additive models, we found that increased urchin coverage was significantly correlated with decreased kelp condition in both study sites, providing evidence that a shift from a kelp forest to an urchin barren may have occurred in the Port Orford area. Additionally, increased kelp condition was correlated with increased zooplankton abundance, supporting our hypothesis that kelp forests are an important habitat and resource for nearshore zooplankton prey. Interestingly, this relationship was bell-shaped in one of our two study sites, suggesting that there are other factors besides healthy bull kelp that influence zooplankton abundance, which likely include upwelling dynamics, habitat structure, and local oceanographic characteristics. For the whale model, we found that increased kelp condition was significantly correlated with increased gray whale foraging time, which may corroborate our hypothesis that gray whales use kelp as an environmental cue to locate prey. Zooplankton abundance was significantly correlated with gray whale foraging time in one of our two sites. Once again, this relationship was bell-shaped, which suggests other factors influence gray whale foraging time, including prey quality (Hildebrand et al. 2022) and density.

Figure 5. Effects derived from trophic path generalized additive models of purple sea urchin coverage on kelp condition (A), kelp condition on relative zooplankton abundance (B), and kelp condition and relative zooplankton abundance on gray whale foraging time (C). The colored ribbons represent approximate 95% confidence intervals. Line types represent the two study sites, Mill Rocks (MR; solid) and Tichenor Cove (TC; dashed). Curves with asterisks indicate statistically significant (P < 0.05) relationships. Figure and caption taken from Hildebrand et al. 2024.

Our results highlight the potential larger impacts of reduced gray whale foraging time as a result of these trophic dynamics may cause at the individual and population level. If an area that was once a reliable source of food (like Port Orford) is no longer favorable, then whales likely search for other areas in which to feed. However, if the areas affected by these dynamics are widespread, then individuals may spend more time searching for, and less time consuming, prey, which could have energetic consequences. While our study took place in a relatively small spatial area, the trophic dynamics we documented in our system may be representative of patterns across the PCFG range, given ecological and topographic similarities in habitat use patterns. In fact, in the years with the lowest kelp, zooplankton, and whale occurrence (2020 and 2021) in Port Orford, the GRANITE field team also noted low whale numbers and minimal surface kelp extent in the central Oregon field site off of Newport. However, ecosystems are resilient. We are hopeful that the dynamics we documented in Port Orford are just short-term changes and that the system will return to its former balanced state with less urchins, more healthy bull kelp, zooplankton, and lots of feeding gray whales.

If you are interested in getting a more detailed picture of our methods and analysis, you can read our open access paper here: https://www.nature.com/articles/s41598-024-59964-x

Did you enjoy this blog? Want to learn more about marine life, research, and conservation? Subscribe to our blog and get a weekly message when we post a new blog. Just add your name and email into the subscribe box below.

Loading

References

Coyer, J. A. (1984). The invertebrate assemblage associated with the giant kelp, Macrocystis pyrifera, at Santa Catalina Island, California: a general description with emphasis on amphipods, copepods, mysids, and shrimps. Fishery Bulletin, 82(1), 55-66.

Harvell, C. D., Montecino-Latorre, D., Caldwell, J. M., Burt, J. M., Bosley, K., Keller, A., … & Gaydos, J. K. (2019). Disease epidemic and a marine heat wave are associated with the continental-scale collapse of a pivotal predator (Pycnopodia helianthoides). Science advances, 5(1), eaau7042.

Hildebrand, L., Sullivan, F. A., Orben, R. A., Derville, S., & Torres, L. G. (2022). Trade-offs in prey quantity and quality in gray whale foraging. Marine Ecology Progress Series, 695, 189-201.

Jackson, G. A., & Winant, C. D. (1983). Effect of a kelp forest on coastal currents. Continental Shelf Research, 2(1), 75-80.

Jacox, M. G., Alexander, M. A., Mantua, N. J., Scott, J. D., Hervieux, G., Webb, R. S., & Werner, F. E. (2018). Forcing of multi-year extreme ocean temperatures that impacted California Current living marine resources in 2016. Bull. Amer. Meteor. Soc, 99(1).

Kone, D. V., Tinker, M. T., & Torres, L. G. (2021). Informing sea otter reintroduction through habitat and human interaction assessment. Endangered Species Research, 44, 159-176.

Rogers-Bennett, L., & Catton, C. A. (2019). Marine heat wave and multiple stressors tip bull kelp forest to sea urchin barrens. Scientific reports, 9(1), 15050.

Torres, L. G., Nieukirk, S. L., Lemos, L., & Chandler, T. E. (2018). Drone up! Quantifying whale behavior from a new perspective improves observational capacity. Frontiers in Marine Science, 5, 319.

VanMeter, K., & Edwards, M. S. (2013). The effects of mysid grazing on kelp zoospore survival and settlement. Journal of Phycology, 49(5), 896-901.