The costs and benefits of automated behavior classification

Clara Bird, PhD Student, OSU Department of Fisheries, Wildlife, and Conservation Sciences, Geospatial Ecology of Marine Megafauna Lab

“Why don’t you just automate it?” This is a question I am frequently asked when I tell someone about my work. My thesis involves watching many hours of drone footage of gray whales and meticulously coding behaviors, and there are plenty of days when I have asked myself that very same question. Streamlining my process is certainly appealing and given how wide-spread and effective machine learning methods have become, it is a tempting option to pursue. That said, machine learning is only appropriate for certain research questions and scales, and it’s important to consider these before investing in using a new tool.

The application of machine learning methods to behavioral ecology is called computational ethology (Anderson & Perona, 2014). To identify behaviors from videos, the model tracks individuals across video frames and identifies patterns of movement that form a behavior. This concept is similar to the way we identify a whale as traveling if it’s moving in a straight line and as foraging if it’s swimming in circles within a small area (Mayo & Marx, 1990, check out this blog to learn more). The level of behavioral detail that the model is able to track  depends on the chosen method (Figure 1, Pereira et al., 2020). These methods range from tracking each animal as a simple single point (called a centroid) to tracking the animal’s body positioning in 3D (this method is called pose estimation), which range from providing less detailed to more detailed behavior definitions. For example, tracking an individual as a centroid could be used to classify traveling and foraging behaviors, while pose estimation could identify specific foraging tactics. 
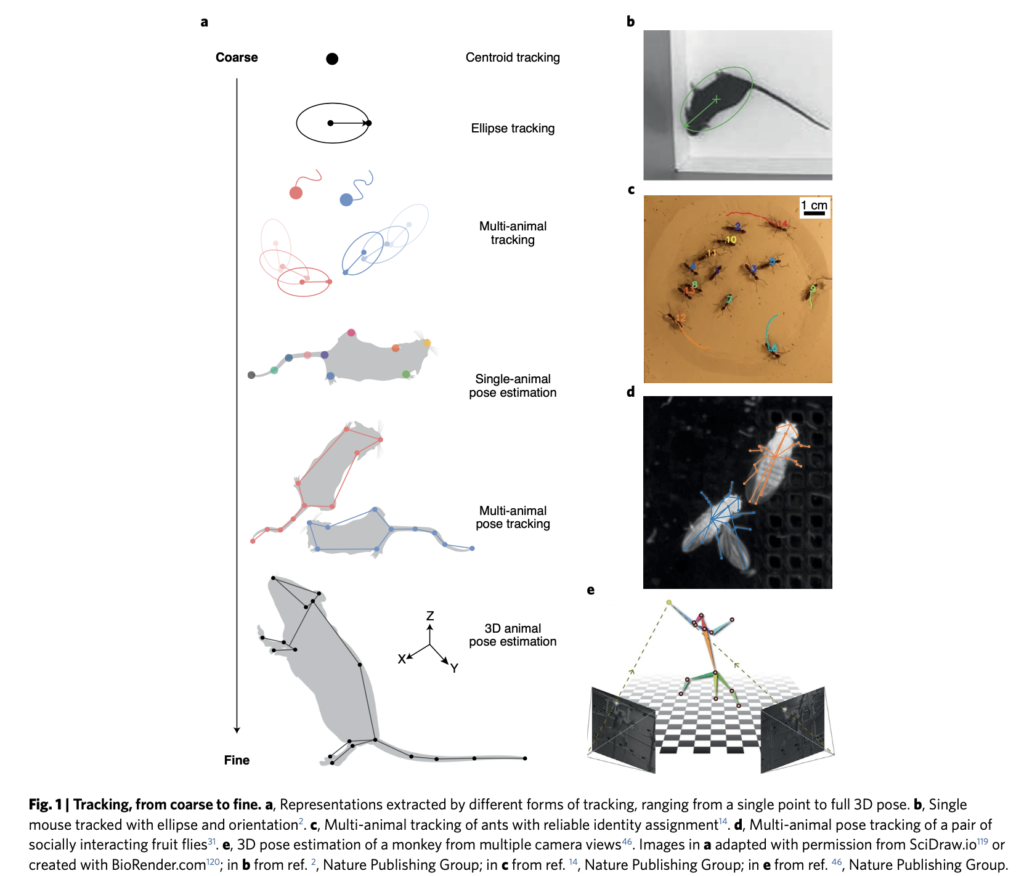
Figure 1. Figure from Pereira et al. (2020) illustrating the different methods of animal behavior tracking that are possible using machine learning.

Pose estimation involves training the machine learning algorithm to track individual anatomical features of an individual (e.g., the head, legs, and tail of a rat), meaning that it can define behaviors in great detail. A behavior state could be defined as a combination of the angle between the tail and the head, and the stride length. 

For example, Mearns et al. (2020) used pose estimation to study how zebrafish larvae in a lab captured their prey. They tracked the tail movements of individual larvae when presented with prey and classified these movements into separate behaviors that allowed them to associate specific behaviors with prey capture (Figure 2). The authors found that these behaviors occurred in a specific sequence, that the behaviors kept the prey within the larvae’s line of sight, and that the sequence was triggered by visual cues.  In fact, when they removed the visual cue of the prey, the larvae terminated the behavior sequence, meaning that the larvae are continually choosing to do each behavior in the sequence, rather than the sequence being one long behavior event that is triggered only by the initial visual cue. This study is a good example of the applicability of machine learning models for questions aimed at kinematics and fine-scale movements. Pose estimation has also been used to study the role of facial expression and body language in rat social communication (Ebbesen & Froemke, 2021). 

Figure 2. Excerpt from figure 1 of Mearns et al. (2020) illustrating (A) the camera set up for their experiment, (B) how the model tracked the eye angles and tail of the larvae fish, (C) the kinematics extracted from the footage. In panel (C) the top plot shows how the eyes converged on the same object (the prey) during prey capture event, the middle plot shows when the tail was curved to the left or the right, and the bottom plot shows the angle of the tail tip relative to the body.

While previous machine learning methods to track animal movements required individuals to be physically marked, the current methods can perform markerless tracking (Pereira et al., 2020). This improvement has broadened the kinds of studies that are possible. For example, Bozek et al., (2021) developed a model that tracked individuals throughout an entire honeybee colony and showed that certain individual behaviors were spatially distributed within the colony (Figure 3). Machine learning enabled the researchers to track over 1000 individual bees over several months, a task that would be infeasible for someone to do by hand. 

Figure 3. Excerpt from figure 1 of Bozek et al., (2021) showing how individual bees and their trajectories were tracked.

These studies highlight that the potential benefits of using machine learning when studying fine scale behaviors (like kinematics) or when tracking large groups of individuals. Furthermore, once it’s trained, the model can process large quantities of data in a standardized way to free up time for the scientists to focus on other tasks.

While machine learning is an exciting and enticing tool, automating behavior detection via machine learning could be its own PhD dissertation. Like most things in life, there are costs and benefits to using this technique. It is a technically difficult tool, and while applications exist to make it more accessible, knowledge of the computer science behind it is necessary to apply it effectively and correctly. Secondly, it can be tedious and time consuming to create a training dataset for the model to “learn” what each behavior looks like, as this step involves manually labeling examples for the model to use. 

As I’ve mentioned in a previous blog, I came quite close to trying to study the kinematics of gray whale foraging behaviors but ultimately decided that counting fluke beats wasn’t necessary to answer my behavioral research questions. It was important to consider the scale of my questions (as described in Allison’s blog) and I think that diving into more fine-scale kinematics questions could be a fascinating follow-up to the questions I’m asking in my PhD. 

For instance, it would be interesting to quantify how gray whales use their flukes for different behavior tactics. Do gray whales in better body condition beat their flukes more frequently while headstanding? Does the size of the fluke affect how efficiently they can perform certain tactics? While these analyses would help quantify the energetic costs of different behaviors in better detail, they aren’t necessary for my broad scale questions. Consequently, taking the time to develop and train a pose estimation machine learning model is not the best use of my time.

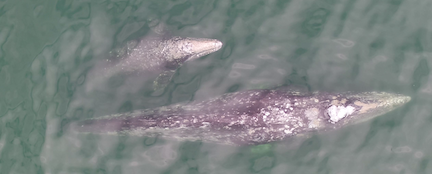
That being said, I am interested in applying machine learning methods to a specific subset of my dataset. In social behavior, it is not only useful to quantify the behaviors exhibited by each individual but also the distance between them. For example, the distance between a mom and her calf can be indicative of the calves’ dependence on its mom (Nielsen et al., 2019). However, continuously measuring the distance between two individuals throughout a video is tedious and time intensive, so training a machine learning model could be an effective use of time. I plan to work with an intern this summer to develop a machine learning model to track the distance between pairs of gray whales in our drone footage and then relate this distance data with the manually coded behaviors to examine patterns in social behavior (Figure 4).  Stay tuned to learn more about our progress!

Figure 4. A mom and calf pair surfacing together. Image collected under NOAA/NMFS permit #21678

Did you enjoy this blog? Want to learn more about marine life, research, and conservation? Subscribe to our blog and get a weekly alert when we make a new post! Just add your name into the subscribe box on the left panel.  

References

Anderson, D. J., & Perona, P. (2014). Toward a Science of Computational Ethology. Neuron84(1), 18–31. https://doi.org/10.1016/j.neuron.2014.09.005

Bozek, K., Hebert, L., Portugal, Y., Mikheyev, A. S., & Stephens, G. J. (2021). Markerless tracking of an entire honey bee colony. Nature Communications12(1), 1733. https://doi.org/10.1038/s41467-021-21769-1

Ebbesen, C. L., & Froemke, R. C. (2021). Body language signals for rodent social communication. Current Opinion in Neurobiology68, 91–106. https://doi.org/10.1016/j.conb.2021.01.008

Mayo, C. A., & Marx, M. K. (1990). Surface foraging behaviour of the North Atlantic right whale, Eubalaena glacialis , and associated zooplankton characteristics. Canadian Journal of Zoology68(10), 2214–2220. https://doi.org/10.1139/z90-308

Mearns, D. S., Donovan, J. C., Fernandes, A. M., Semmelhack, J. L., & Baier, H. (2020). Deconstructing Hunting Behavior Reveals a Tightly Coupled Stimulus-Response Loop. Current Biology30(1), 54-69.e9. https://doi.org/10.1016/j.cub.2019.11.022

Nielsen, M., Sprogis, K., Bejder, L., Madsen, P., & Christiansen, F. (2019). Behavioural development in southern right whale calves. Marine Ecology Progress Series629, 219–234. https://doi.org/10.3354/meps13125

Pereira, T. D., Shaevitz, J. W., & Murthy, M. (2020). Quantifying behavior to understand the brain. Nature Neuroscience23(12), 1537–1549. https://doi.org/10.1038/s41593-020-00734-z
Inference, and the intersection of ecology and statistics

By Dawn Barlow, PhD student, OSU Department of Fisheries and Wildlife, Geospatial Ecology of Marine Megafauna Lab

Recently, I had the opportunity to attend the International Statistical Ecology Conference (ISEC), a biennial meeting of researchers at the interface of ecology and statistics. I am a marine ecologist, fascinated by the interactions between animals and the dynamic ocean environment they inhabit. If you had asked me five years ago whether I thought I would ever consider myself a statistician or a computer programmer, my answer would certainly have been “no”. Now, I find myself studying the ecology of blue whales in New Zealand using a variety of data streams and methodologies, but a central theme for my dissertation is species distribution modeling. Species distribution models (SDMs) are mathematical algorithms that correlate observations of a species with environmental conditions at their observed locations to gain ecological insight and predict spatial distributions of the species (Fig. 1; Elith and Leathwick 2009). I still can’t say I would identify as a statistician, but I have a growing appreciation for the role of statistics to gain inference in ecology.

Figure 1. A schematic of a species distribution model (SDM) illustrating how the relationship between mapped species and environmental data (left) is compared to describe “environmental space” (center), and then map predictions from a model using only environmental predictors (right). Note that inter-site distances in geographic space might be quite different from those in environmental space—a and c are close geographically, but not environmentally. The patterning in the predictions reflects the spatial autocorrelation of the environmental predictors. Figure reproduced from Elith and Leathwick (2009).

Before I continue, let’s take a look at just a few definitions from Merriam-Webster’s dictionary:

Statistics: a branch of mathematics dealing with the collection, analysis, interpretation, and presentation of masses of numerical data

Ecology: a branch of science concerned with the interrelationship of organisms and their environments

Inference: a conclusion or opinion that is formed because of known facts or evidence

Ecological data are notoriously noisy, messy, and complex. Statistical tests are meant to help us understand whether a pattern in the data is different from what we would expect through random chance. When we study how organisms interact with one another and their environment, it is impossible to completely capture all elements of the ecosystem. Therefore, ecology is a field ripe with challenges for statisticians. How do we quantify a meaningful biological signal amidst all the noise? How can we gain inference from ecological data to enhance knowledge, and how can we use that knowledge to make informed predictions? Marine mammals are notoriously difficult to study. They inhabit an environment that is relatively inaccessible and inhospitable to humans, they occur in low numbers, they are highly mobile, and they are rarely visible. All ecological data are difficult and noisy and riddled with small sample sizes, but counting trees presents fewer logistical challenges than counting moving whales in an ever-changing open-ocean setting. Therefore, new methodologies in areas like species distribution modeling are often developed using large, terrestrial datasets and eventually migrate to applications in the marine environment (Robinson et al. 2011).

Many presentations I attended at the conference were geared toward moving beyond correlative SDMs. SDMs were developed to correlate species occurrence patterns with features of the environment they inhabit (e.g. temperature, precipitation, terrain, etc.). However, those relationships do not actually explain the underlying mechanism of why a species is more likely to occur in one environment compared to another. Therefore, ecological statisticians are now using additional information and modeling approaches within SDMs to incorporate information such as species co-occurrence patterns, population demographic information, and physiological constraints. Building SDMs to include such process-explicit information allows us to make steps toward understanding not just when and where a species occurs, but why.

Machine learning is an area that continues to advance and open doors to new applications in ecology. Machine learning approaches differ fundamentally from classical statistics. In statistics, we formulate a hypothesis, select the appropriate model to test that hypothesis (for example, linear regression), then test how well the data fit the model (“Is the relationship linear?”), and test the strength of that inference (“Is the linear pattern different from what we would expect due to random chance?”). Machine learning, on the other hand, does not use a predetermined notion of relationships between variables. Rather, it tries to create an algorithm that fits the patterns in the data. Statistics asks how well the data fit a model, and machine learning asks how well a model fits the data.

Machine learning approaches allow for very complex relationships to be included in models and can be excellent for making predictions. However, sometimes the relationships fitted by a machine learning algorithm are so complex that it is not possible to infer any ecological meaning from them. As one ISEC presenter put it, in machine learning “the computer learns but the scientist does not”. The most important thing when selecting your methodology is to remember your question and your goal. Do you want to understand the mechanism of why an animal is where it is? Or do you not need to understand the driver, but rather want to make the best predictions of where an animal will be? In my case, the answer to that question differs from one of my PhD chapters to the next. We want to understand the functional relationships between oceanography, krill availability, and blue whale distribution (Barlow et al. 2020), and subsequently we want to develop forecasting models that can reliably predict blue whale distribution to inform conservation efforts (Fig. 2).

Figure 2. An example predictive map of where we expect blue whales to be distributed based on environmental conditions. Warmer colors represent areas with a higher probability of blue whale occurrence, and the blue crosses represent locations where blue whales were observed.

ISEC was an excellent opportunity for me to break out of my usual marine mammal-centered bubble and get a taste of what is happening on the leading edge of statistical ecology. I learned about the latest approaches and innovations in species distribution modeling, and in the process I also learned about trees, koalas, birds, and many other organisms from around the world. A fun bonus of attending a methods-focused conference is learning about completely new study species and systems. There are many ways of approaching an ecological question, gaining inference, and making predictions. I look forward to incorporating the knowledge I gained through ISEC into my own research, both in my doctoral work and in applications of new methods to future research projects.

Figure 3. The virtual conference photo of all who attended the biennial International Statistical Ecology Conference. Thank you to the organizers, who made it a truly excellent and engaging conference experience!

References

Barlow, D.R., Bernard, K.S., Escobar-Flores, P., Palacios, D.M., and Torres, L.G. 2020. Links in the trophic chain: Modeling functional relationships between in situ oceanography, krill, and blue whale distribution under different oceanographic regimes. Mar. Ecol. Prog. Ser. doi:https://doi.org/10.3354/meps13339.

Elith, J., and Leathwick, J.R. 2009. Species Distribution Models: Ecological Explanation and Prediction Across Space and Time. Annu. Rev. Ecol. Evol. Syst. 40(1): 677–697. doi:10.1146/annurev.ecolsys.110308.120159.

Robinson, L.M., Elith, J., Hobday, A.J., Pearson, R.G., Kendall, B.E., Possingham, H.P., and Richardson, A.J. 2011. Pushing the limits in marine species distribution modelling: Lessons from the land present challenges and opportunities. doi:10.1111/j.1466-8238.2010.00636.x.