By Lisa Hildebrand, PhD student, OSU Department of Fisheries, Wildlife, & Conservation Sciences, Geospatial Ecology of Marine Megafauna Lab
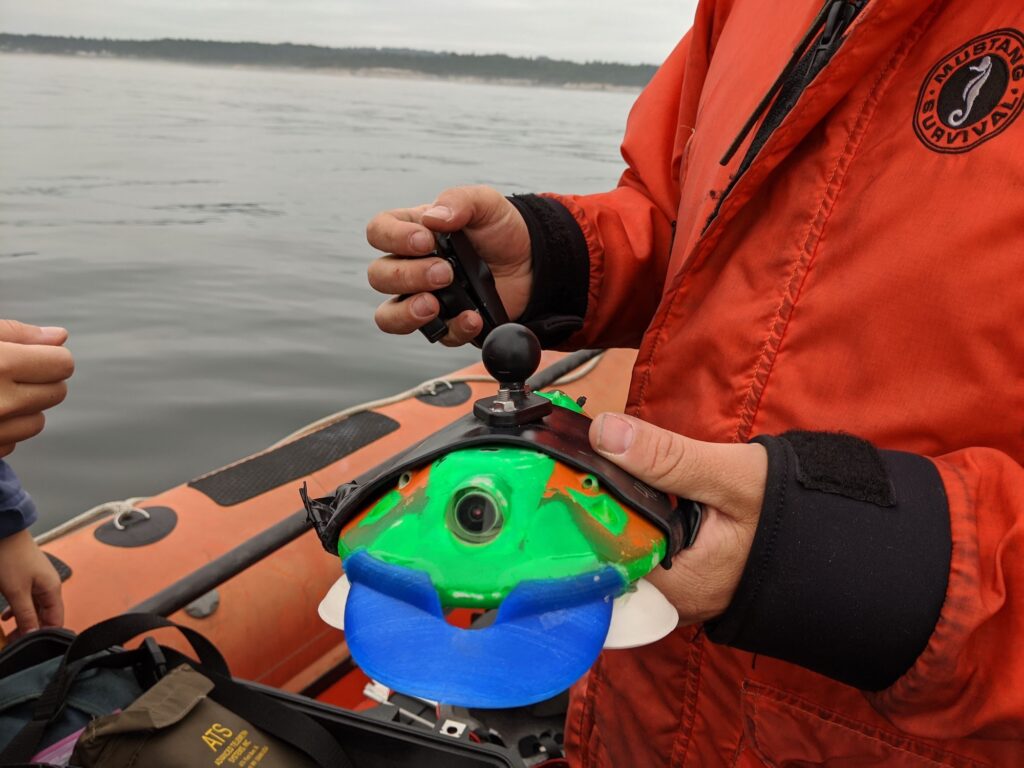
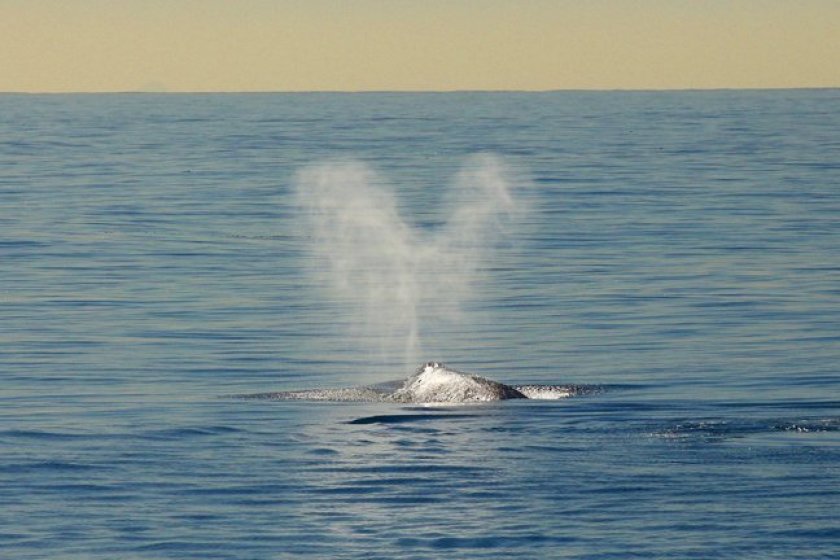
Tagging a whale is no easy feat, nor is it without some impact to the whale – no matter how minimized through the use of non-penetrating suction cup tags. Yet, in August 2021 the GEMM Lab initiated a new phase in our research on gray whales, aimed at obtaining a better understanding of the underwater lives and energetics of a gray whale (Figure 1, top image). We captured some amazing data through these specialized, non-invasive tags that provide a brief window into their world and physiology. The video recordings from the tags showed us whales digging their heads into the benthos generating billowing clouds of sediment, likely exploiting desirable prey patches (Figure 1, middle images). We also saw foraging whales undertake dizzying spins and headstands for hours, demonstrating the fascinating maneuverability and flexibility of gray whales (Figure 1, bottom image). But what is motivating us to capture this information?
The GEMM Lab has researched the ecology and physiology of Pacific Coast Feeding Group (PCFG) gray whales since 2015. Our efforts have filled crucial knowledge gaps to better understand this sub-group of the Eastern North Pacific (ENP) gray whale population. We now know that gray whale body condition increases throughout a foraging season and can fluctuate considerably between years (Soledade Lemos et al. 2020). Additionally, body condition varies significantly by reproductive state, with calves and pregnant females displaying higher body conditions (Soledade Lemos et al. 2020). We have also validated and quantified fecal steroid and thyroid hormone metabolite concentrations, providing us with thresholds to identify a stressed vs. a not stressed whale based on its hormone levels (Lemos et al. 2020). These validations have allowed us to make correlations between poor body condition and the steroid hormone cortisol which confirm that slim whales are stressed, while chubby whales are relaxed (Lemos et al. 2021). These physiological results are particularly salient in the light of our recent findings that PCFG gray whales select prey quality over prey quantity when foraging (Hildebrand et al. in review) and that the caloric content of available prey species in the PCFG range vary significantly (Hildebrand et al. 2021).
While we have addressed several fundamental questions about the PCFG in the last 7 years, answering one question has led to asking 10 more questions – a common pattern in science. Given that we know (1) PCFG whales improve their body condition over the course of the foraging season (Soledade Lemos et al. 2020), (2) PCFG females are able to successfully give birth to and wean calves (Calambokidis & Perez 2017), and (3) certain prey in the PCFG region are of higher caloric value than prey in the ENP Arctic foraging grounds (Hildebrand et al. 2021), a big question that we continue to scratch our heads about is why does the PCFG sub-group have such a small abundance (~250 individuals; Calambokidis et al. 2017) in comparison to the much larger ENP population (~21,000 individuals; Stewart & Weller 2021). Several hypotheses have been suggested including that the energetic costs of feeding may differ between ENP and PCFG whales, with the latter having to expend more energy to obtain prey due to the different foraging behaviors employed (Torres et al. 2018) to obtain diverse prey types, thus justifying the larger abundance of the ENP (Hildebrand et al. 2021).
Quantifying the energetic cost of baleen whale behaviors is not simple. However, the development of animal-borne tags has allowed scientists to make big strides regarding behavioral cost quantification. The majority of this work has focused on rorqual whales (i.e., blue, humpback, fin whales; e.g., Goldbogen et al. 2013; Cade et al. 2016) as their characteristic lunge-feeding strategy produces a distinct signal in the accelerometer sensors integrated within the tags, making feeding events easier to identify. Gray whales, unlike rorquals, do not lunge-feed. ENP gray whales predominantly feed benthically; diving down to the benthos where they turn onto their side and suction mouthfuls of soft sediment (mud) that contains amphipods that they filter out of the mud (Nerini & Oliver 1983). PCFG whales feed benthically as well, but they also use a number of other feeding behaviors to obtain a variety of prey in a variety of benthic habitats, including headstands, bubble blasts, and sharking (Torres et al. 2018). The above-mentioned gray whale feeding behaviors involve much subtler movements than the powerful, distinctive lunges displayed by rorquals, yet they undoubtedly still incur some energetic cost to the whales. However, exactly how energetically costly the various gray whale feeding behaviors are remains unknown.

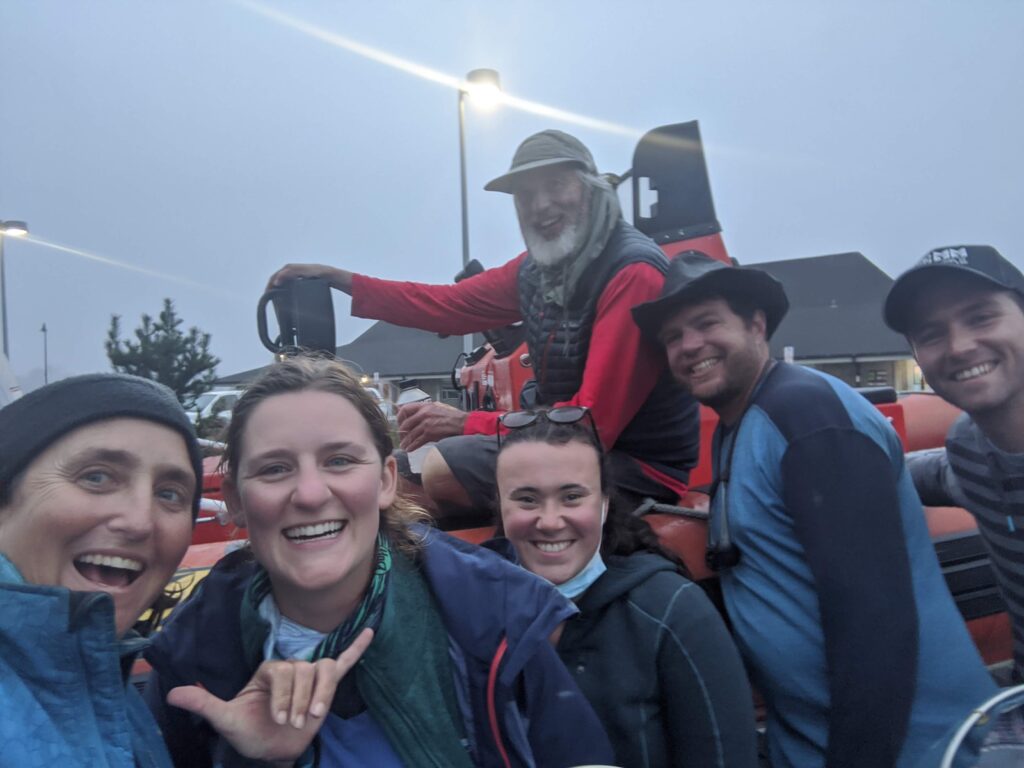
This knowledge gap is one of the reasons why the GEMM Lab initiated a new project in close collaboration with Dr. Dave Cade from Stanford University and John Calambokidis from Cascadia Research Collective to quantify and understand the energetics and underwater behavior of gray whales using suction-cup tags. The project was kick-started with a very successful pilot effort the week of August 16th this year. Tags were placed on the backs of three different PCFG gray whales with a long carbon fiber pole and attached to the whales with four suction cups. The tags recorded video, position, accelerometry, and magnetometry data, which we will use to recreate the animal’s movements (pitch, roll), heading, trackline, and environment. Although the weather forecast did not look promising for most of the week, we lucked out with perfect conditions for one day during which we managed to deploy three tags on three different gray whales that are well-known, long-term study animals of the GEMM Lab. The tags stayed on the whales for 1-6 hours and were all recovered (including an adventurous trip up the Alsea River which involved a kayak deployment!).
Dr. Cade spent the rest of the week teaching GEMM Lab PI Leigh Torres, University of British Columbia Master’s student Kate Colson (who is co-advised by Leigh and Dr. Andrew Trites), and myself the intricacies of data download, processing, and preliminary analysis of the tag data. For her Master’s research, Kate will develop a bioenergetics model for the PCFG sub-group that includes data on foraging energetics (estimated from the tag data) and prey availability in the PCFG foraging range. I plan on using the tag data to assess behavior patterns of PCFG whales relative to habitat as part of my PhD research. All together analysis of the data from these short-term tag deployments will help us get closer to understanding the behavioral choices, habitat needs, and energetic trade-offs of whales living in a rapidly changing ocean. With the success of this pilot effort, we plan to conduct another suction-cup tagging effort next summer to hopefully capture and explore more mysterious underwater behaviors of the PCFG.

This project was funded by sales and renewals of the special Oregon whale license plate, which benefits MMI. We gratefully thank all the gray whale license plate holders, who made this research effort possible.
Literature cited
Cade, D. E., Friedlaender, A. S., Calambokidis, J., & Goldbogen, J. A. 2016. Kinematic diversity in rorqual whale feeding mechanisms. Current Biology 26(19):2617-2624. doi:10.1016/j.cub.2016.07.037.
Calambokidis, J., & Perez, A. 2017. Sightings and follow-up of mothers and calves in the PCFG and implications for internal recruitment. IWC Report SC/A17/GW/04 for the Workshop on the Status of North Pacific Gray Whales (La Jolla: IWC).
Calambokidis, J., Laake, J., & Perez, A. 2017. Updated analysis of abundance and population structure of seasonal gray whales in the Pacific Northwest, 1996-2015. IWC Report SC/A17/GW/05 for the Workshop on the Status of North Pacific Gray Whales (La Jolla: IWC).
Goldbogen, J. A., Friedlaender, A. S., Calambokidis, J., McKenna, M. F., Simon, M., & Nowacek, D. P. 2013. Integrative approaches to the study of baleen whale diving behavior, feeding performance, and foraging ecology. BioScience 63(2):90-100. doi:10.1525/bio.2013.63.2.5.
Hildebrand, L., Bernard, K. S., & Torres, L. G. 2021. Do gray whales count calories? Comparing energetic values of gray whale prey across two different feeding grounds in the eastern North Pacific. Frontiers in Marine Science 1008. doi:10.3389/fmars.2021.683634.
Lemos, L. S., Olsen, A., Smith, A., Burnett, J. D., Chandler, T. E., Larson, S., Hunt, K. E., & Torres, L. G. 2021. Stressed and slim or relaxed and chubby? A simultaneous assessment of gray whale body condition and hormone variability. Marine Mammal Science. doi:10.111/mms.12877.
Lemos, L.S., Olsen, A., Smith, A., Chandler, T.E., Larson, S., Hunt, K., and L.G. Torres. 2020. Assessment of fecal steroid and thyroid hormone metabolites in eastern North Pacific gray whales. Conservation Physiology 8:coaa110.
Nerini, M. K., & Oliver, J. S. 1983. Gray whales and the structure of the Bering Sea benthos. Oecologia 59:224-225. doi:10.1007/bf00378840.
Soledade Lemos, L., Burnett, J. D., Chandler, T. E., Sumich, J. L., & Torres, L. G. 2020. Intra- and inter-annual variation in gray whale body condition on a foraging ground. Ecosphere 11(4):e03094.
Stewart, J. D., & Weller, D. W. 2021. Abundance of eastern North Pacific gray whales 2019/2020. Department of Commerce, NOAA Technical Memorandum NMFS-SWFSC-639. United States: NOAA. doi:10.25923/bmam-pe91.
Torres, L.G., Nieukirk, S.L., Lemos, L., and T.E. Chandler. 2018. Drone Up! Quantifying Whale Behavior From a New Perspective Improves Observational Capacity. Frontiers in Marine Science: https://doi.org/10.3389/fmars.2018.00319.


