Burning it down

By Leila S. Lemos, PhD Candidate in Wildlife Sciences, Fisheries and Wildlife Department, OSU

As you might know, the GEMM Lab (Geospatial Ecology of MARINE Megafauna Laboratory) researches the marine environment, but today I am going to leave the marine ecosystem aside and I will discuss the Amazon biome. As a Brazilian, I cannot think of anything else to talk about this week than the terrifying fire that is burning down the Amazon forest in this exact minute.

For some context, the Amazon biome is known as the biome with the highest biodiversity in the world (ICMBio, 2019). It is the largest biome in Brazil, accounting for ~49% of the Brazilian territory. This biome houses the biggest tropical forest and hydrographic basin in the world. The Amazon forest also extends through eight other countries: Bolivia, Colombia, Ecuador, Guiana, French Guiana, Peru, Suriname and Venezuela. To date, at least 40,000 plant species, 427 mammals, 1,300 birds, 378 reptiles, more than 400 amphibians, around 3,000 freshwater fishes, and around 100,000 invertebrate species have been described by scientists in the Amazon, comprising more than 1/3 of all fauna species on the planet (Da Silva et al. 2005, Lewinsohn and Prado 2005). And, these numbers are likely to increase; According to Patterson (2000), one new genus and eight new species of Neotropical mammals are discovered each year in the region.

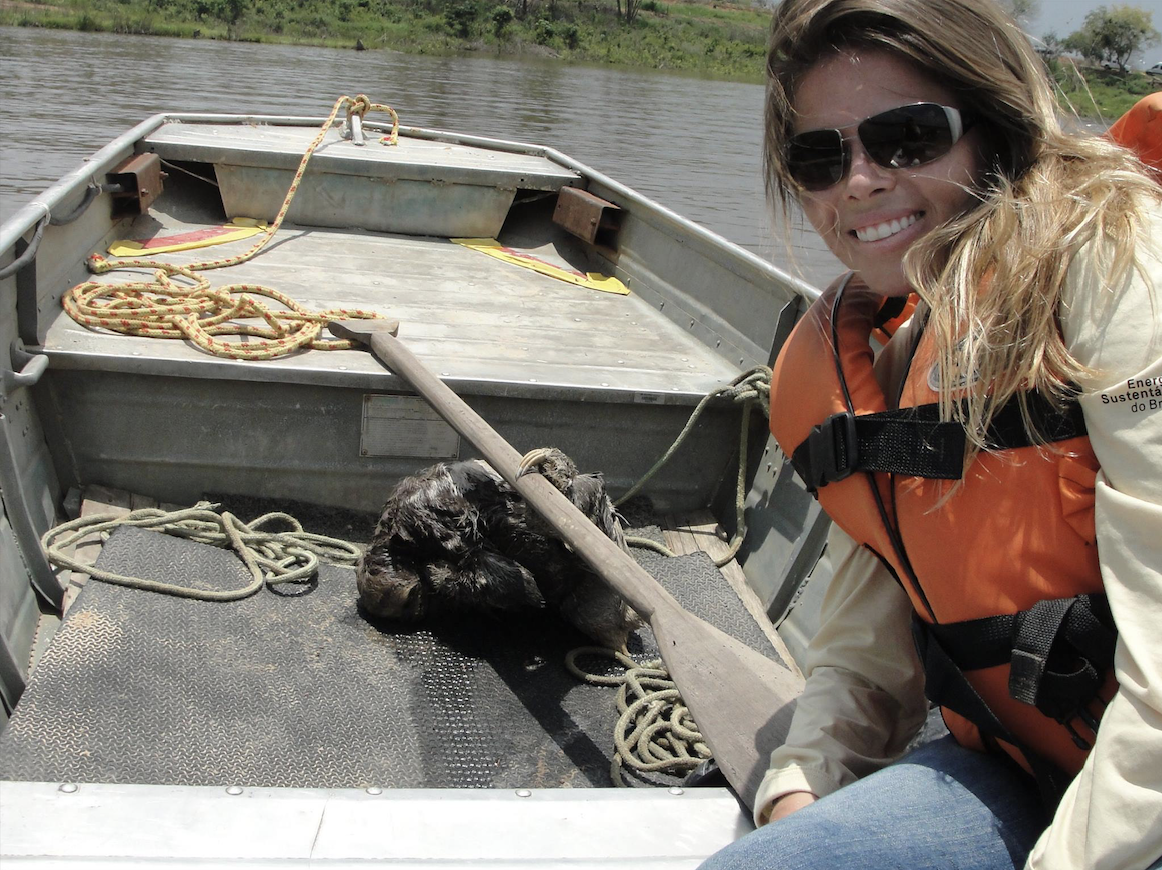
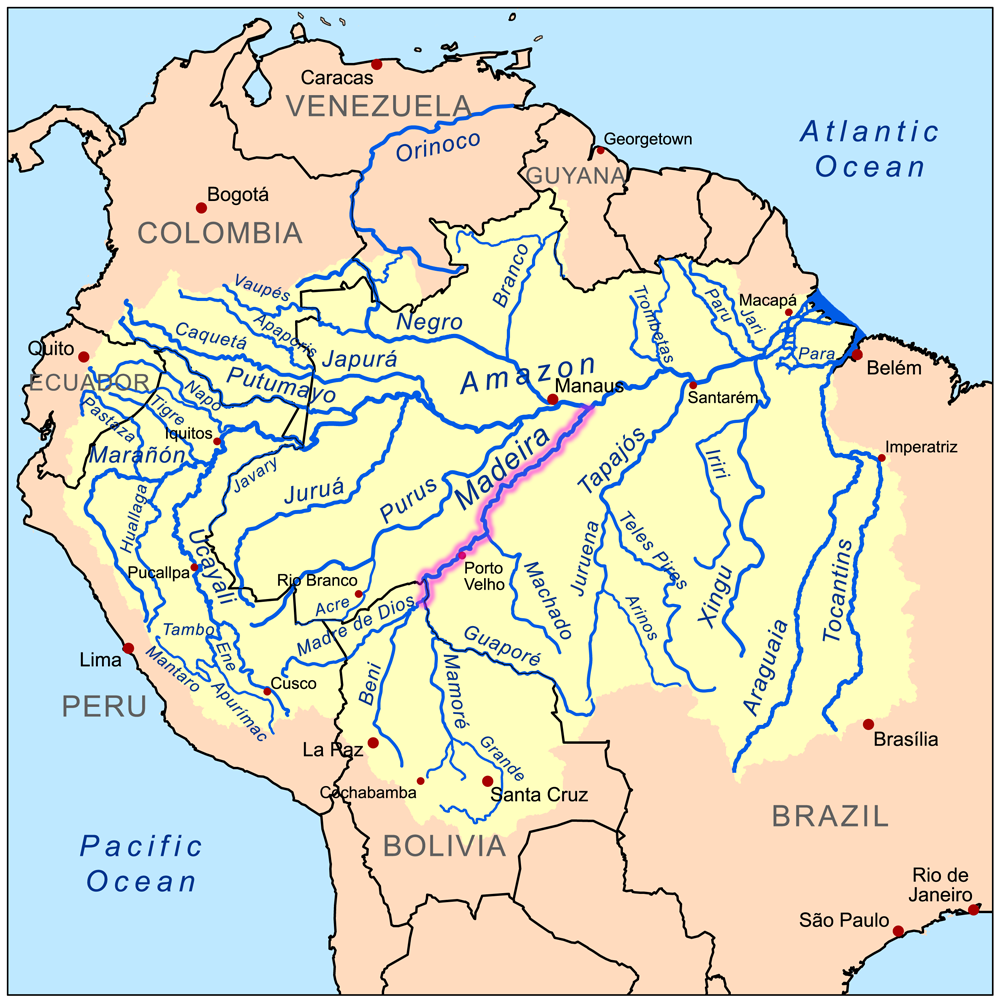
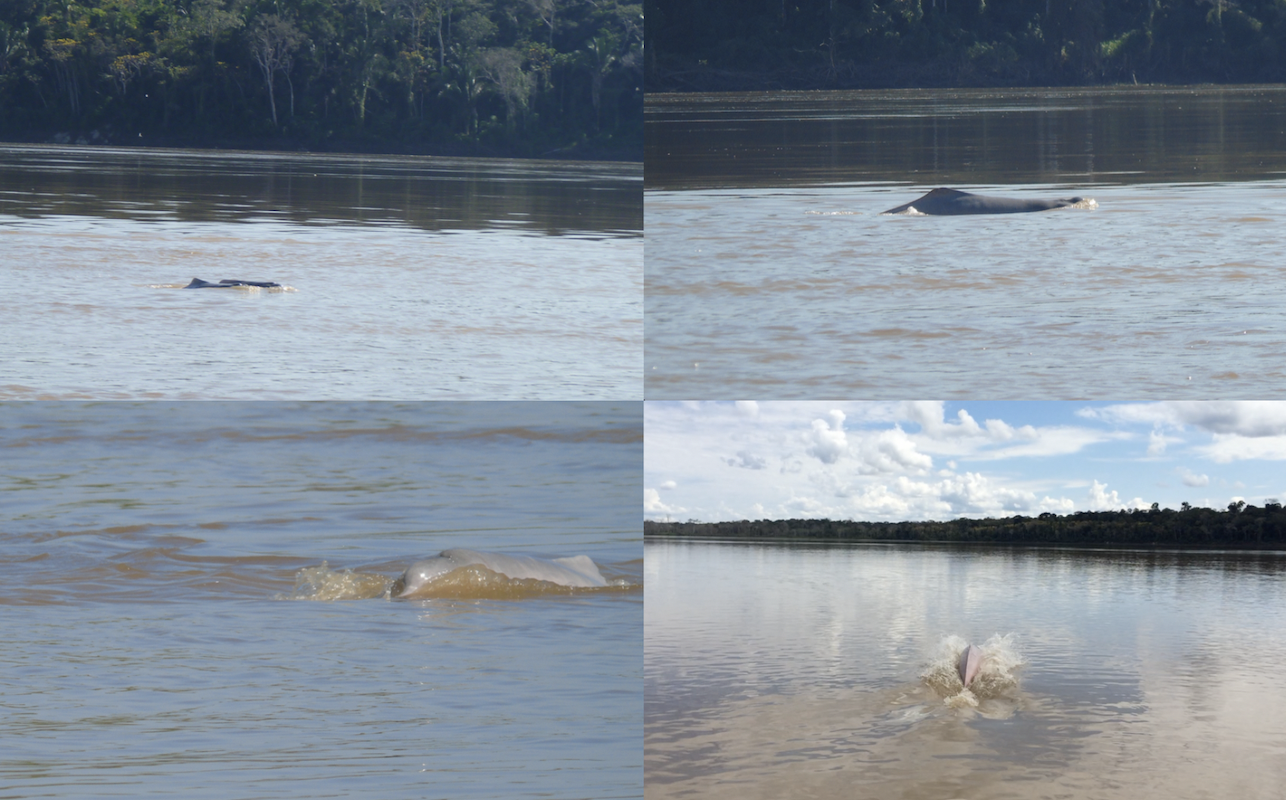
I feel very connected to the Amazon as I worked as an environmental consultant and field coordinator in 2014 and 2015 (Figs. 1 and 2) along the Madeira river (or “Wood” river) in Rondonia, Brazil (Fig. 3). I monitored Amazon river dolphins (Inia geoffrensis; Fig. 4), a species considered endangered by the IUCN Red List in 2018 (Da Silva et al. 2018). The Madeira river originates in Bolivia and flows into the great Amazon river, comprising one of its main tributaries (Fig. 3).
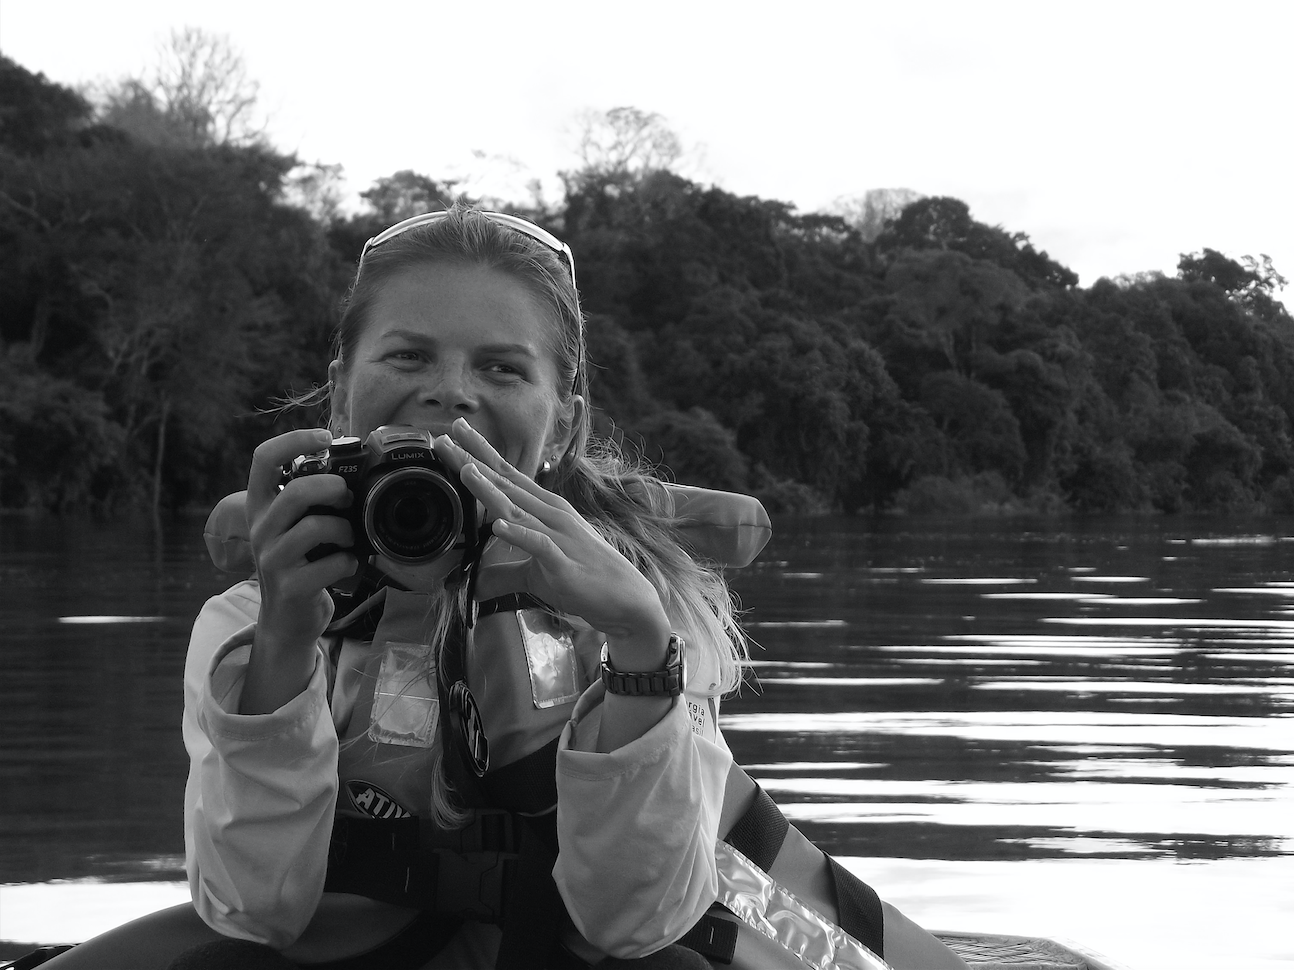
Figure 1: Me, working along the Madeira river, Rondonia, Brazil, in 2015.
Source: Laura K. Honda, 2015.
Figure 2: Me, helping to rescue a sloth from the Madeira river, Rondonia, Brazil, in 2014.
Source: Roberta Lanziani, 2014.
Figure 3: The Amazon hydrographic basin, with the Madeira river highlighted.
Source: Wikipedia, 2019.
Figure 4: Amazon river dolphins (I. geoffrensis) along the Madeira river, Rondonia, Brazil.
Source: Leila S. Lemos, 2014; 2015.

Here is also a video where you can see some Amazon river dolphins along the Madeira river:

Source: Leila S. Lemos, 2014; 2015.

In addition to the dolphins, I witnessed the presence of many other fauna specimens like birds (including macaws and parrots), monkeys, alligators and sloths (Fig. 5). The biodiversity of the Amazon is unquestionable.
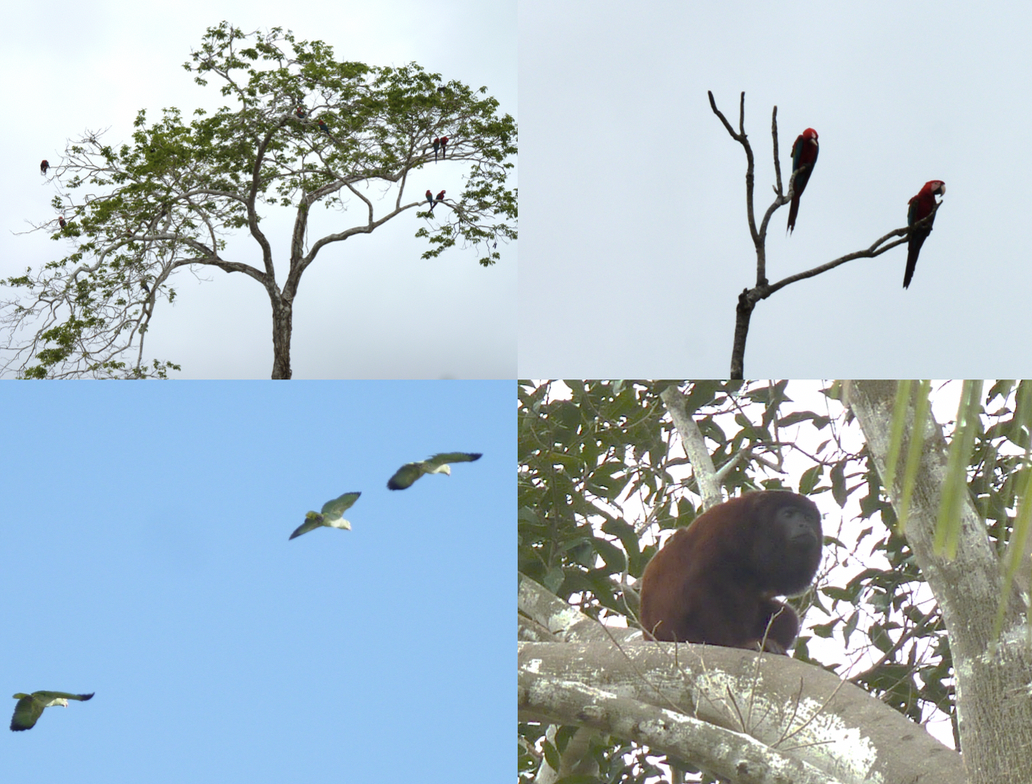
Figure 5: Macaws (Ara chloropterus), parrots (Amazona sp.) and the Guariba monkey or brown howler (Allouatta guariba) along the Madeira river, Rondonia, Brazil.
Source: Leila S. Lemos

Other than its great biodiversity, the Amazon is known as the “lungs of the Earth”, which is an erroneous statement since plants consume as much oxygen as they produce (Malhi et al. 2008, Malhi 2019). But still, the Amazon forest is responsible for 16% of the oxygen produced by photosynthesis on land and 9% of the oxygen on the global scale (Fig. 6). This seems a small percentage, but it is still substantial, especially because the plants use carbon dioxide during photosynthesis, which accounts for a 10% reduction of atmospheric carbon dioxide. Thus, imagine if there was no Amazon rainforest. The rise in carbon dioxide would be enormous and have serious implications on the global climate, surpassing safe temperature boundaries for many regions.
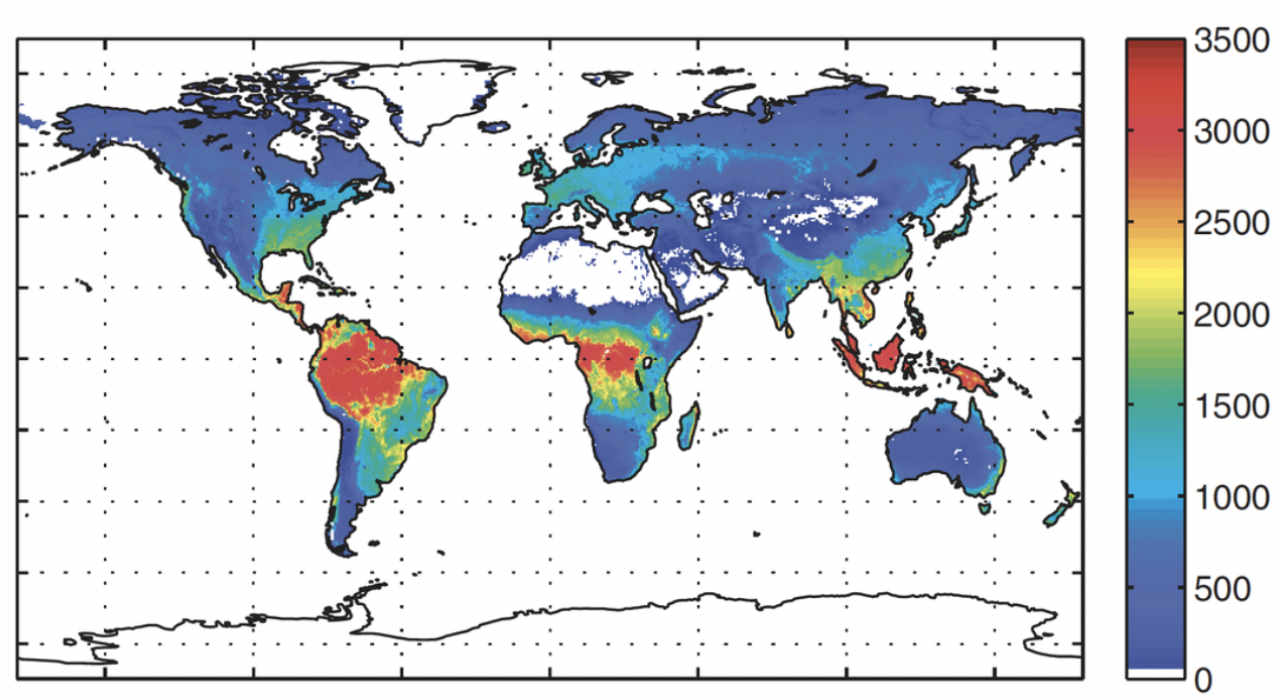
Figure 6: Total photosynthesis of each major land biome. This value is multiplied by 2.67 to convert to total oxygen production. Hence total oxygen production by photosynthesis on land is around 330 Pg of oxygen per year. The Amazon (just under half of the tropical forests) is around 16% of this, around 54 Pg of oxygen per year.
Source: Malhi 2019.

Unfortunately, this scenario is not really far from us. Even though deforestation indices have fallen in the last 15 years, fire incidence associated with droughts and carbon emissions have increased (Aragão et al. 2018; Fig. 7).
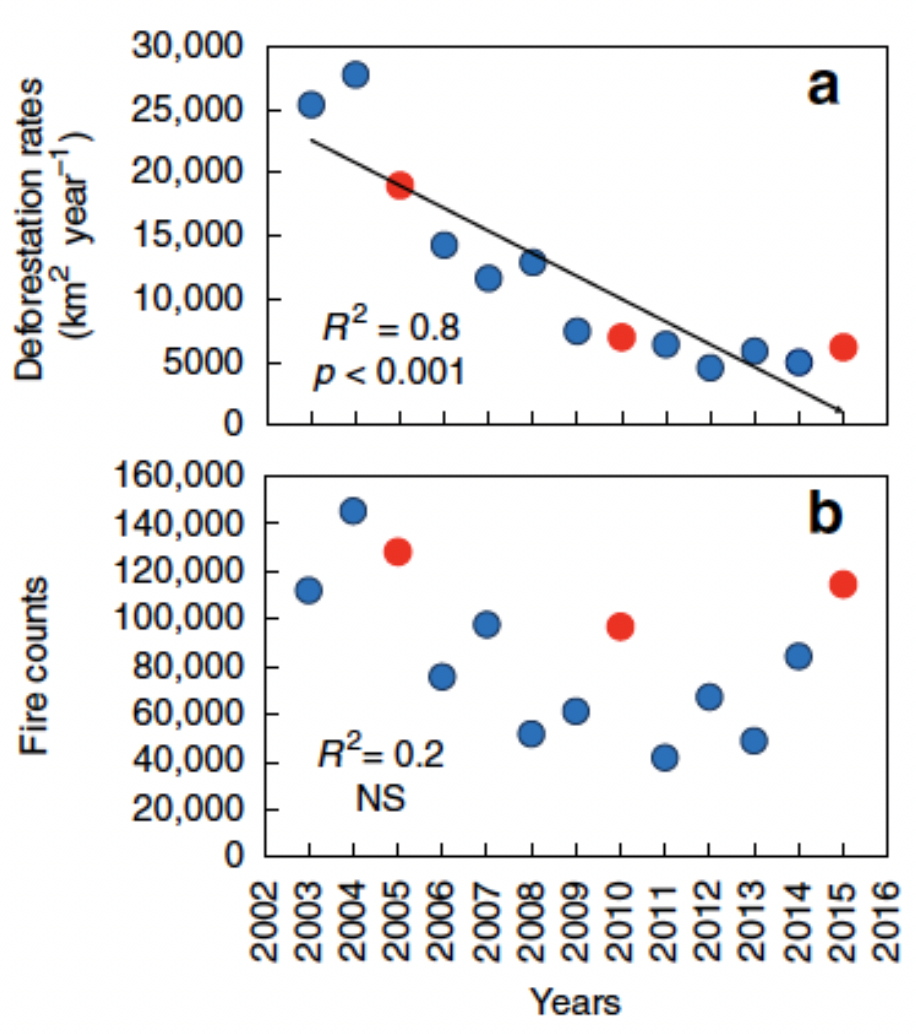
Figure 7: Linear trends (2003–2015) of annual (a) deforestation rates, and (b) active fires counts in the Brazilian Amazon. Red circles indicate the analyzed drought years by Aragão et al. (2018).
Source: Aragão et al. 2018.

Since August 2019, the Amazon forest has experienced extreme fire outbreaks (Figs. 8 and 9). Around 80,000 fires occurred only in 2019. Despite 2019 not being an extreme drought year, the period of January-August 2019 is characterized by an ~80% increase in fires compared to the previous year (Wagner and Hayes 2019). The intensification of the fires has been linked to the Brazilian President’s incentive to “open the rainforest to development”. Leaving politics aside, the truth is that the majority of these fires have been set by loggers and ranchers seeking to clear land to expand the agro-cattle area (Yeung 2019).
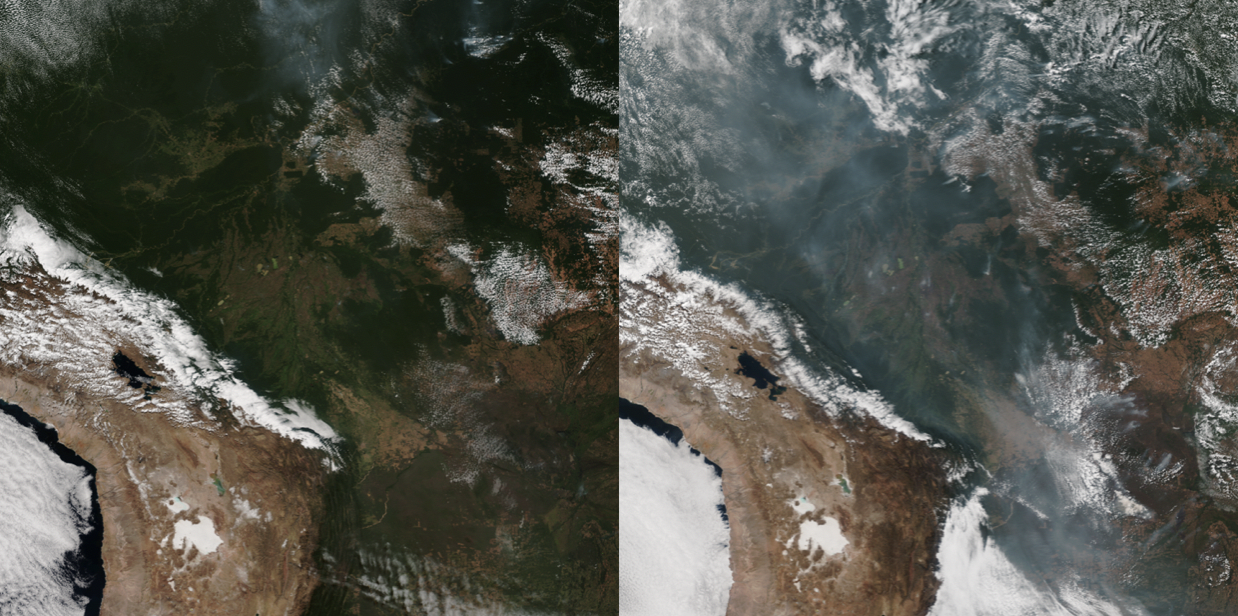
Figure 8: The Amazon in July 28: just clouds; and in August 22: choked with smoke.
Source: NOAA, in: Wagner and Hayes, 2019.
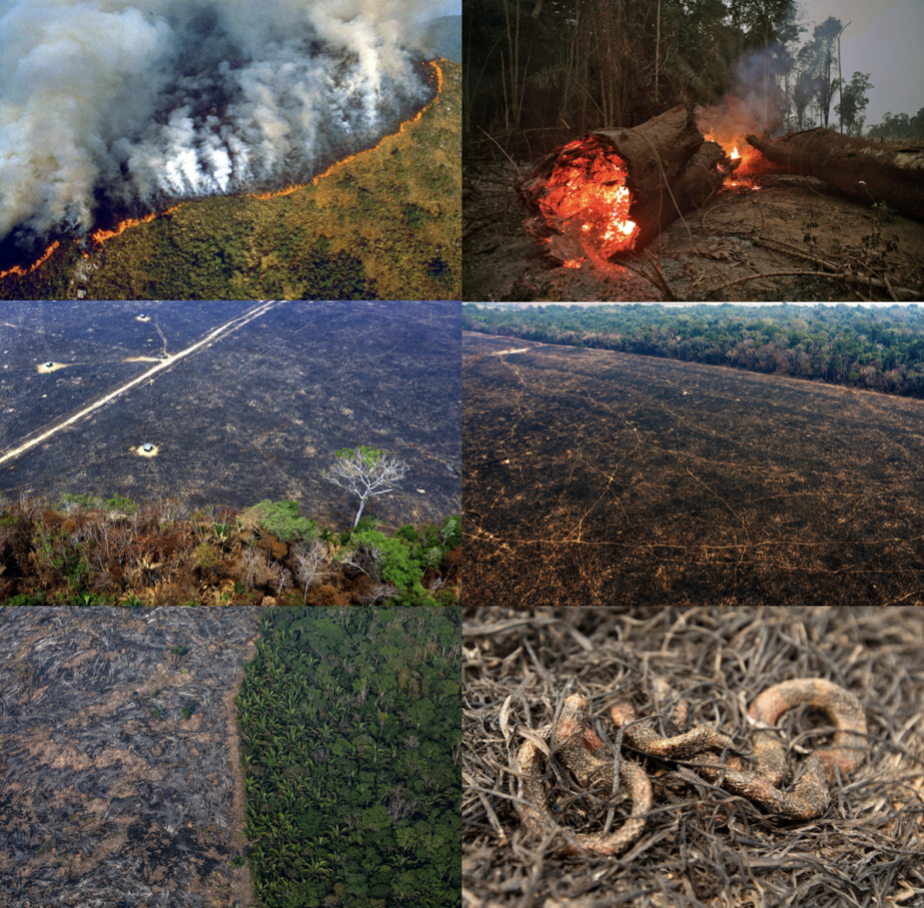
Figure 9: Images showing some of the destruction caused by the fires in the Amazon region in 2019.
Source: Buzz Feed News 2019, Sea Mashable 2019.

Here you can see some videos showing the extension of the problem:

Video 1 – by NBC News:

Video 2 – a drone footage by The Guardian:

I consider myself lucky for the opportunity to have worked in the Amazon rainforest before these chaotic fires have destroyed so much biodiversity. The Amazon is a crucial home for countless animal and plant species, and to ~900,000 indigenous individuals that live in the region. They are all at risk of losing their homes and lives. We are all at risk of global warming.

References

Aragão LEOC, Anderson LO, Fonseca MG, Rosan TM, Vedovato LB, Wagner FH, Silva CVJ, Silva Junior CHL, Arai E, Aguiar AP, Barlow J, Berenguer E, Deeter MN, Domingues LG, Gatti L, Gloor M, Malhi Y, Marengo JA, Miller JB, Phillips OL, and Saatchi S. 2018. 21stCentury drought-related fires counteract the decline of Amazon deforestation carbon emissions. Nature Communications 9(536):1-12.

Buzz Feed News. 2019. These Heartbreaking Photos Show The Devastation Of The Amazon Fires. Retrieved 1 September 2019 from https://www.buzzfeednews.com/article/gabrielsanchez/photos-trending-devastation-amazon-wildfire

Da Silva JMC, Rylands AB, and Da Fonseca GAB. 2005. The Fate of the Amazonian Areas of Endemism. Conservation Biology 19(3):689-694.

Da Silva V, Trujillo F, Martin A, Zerbini AN, Crespo E, Aliaga-Rossel E, and Reeves R. 2018. Inia geoffrensis. The IUCN Red List of Threatened Species 2018: e.T10831A50358152. http://dx.doi.org/10.2305/IUCN.UK.2018-2.RLTS.T10831A50358152.en. Downloaded on 27 August 2019.

ICMBio. 2019. Amazônia. Retrieved 26 August 2019 from http://www.icmbio.gov.br/portal/unidades deconservacao/biomas-brasileiros/amazonia

Lewinsohn TM, and Prado PI. 2005. How Many Species Are There in Brazil? Conservation Biology 19(3):619.

Malhi Y. 2019. does the amazon provide 20% of our oxygen? Travels in ecosystem science. Retrieved 29 August 2019 from http://www.yadvindermalhi.org/blog/does-the-amazon-provide-20-of-our-oxygen

Malhi Y., Roberts JT, Betts RA, Killeen TJ, Li W, Nobre CA. 2008. Climate Change, Deforestation, and the Fate of the Amazon. Science 319:169-172.

Patterson BD. 2000. Patterns and trends in the discovery of new Neotropical mammals. Diversity and Distributions, 6, 145-151.

Sea Mashable. 2019. The Amazon forest is burning to the ground. Here’s how it happened and what you can do to help. Retrieved 1 September 2019 from https://sea.mashable.com/culture/5813/the-amazon-forest-is-burning-to-the-ground-heres-how-it-happened-and-what-you-can-do-to-help

Wagner M, and Hayes M. 2019. Wildfires rage in the Amazon. CNN. Retrieved 26 August 2019 from https://www.cnn.com/americas/live-news/amazon-wildfire-august-2019/index.html

Wikipedia. 2019. Madeira river. Retrieved 29 August 2019 from https://en.wikipedia.org/wiki/Madeira_River

Yeung J. 2019. Blame humans for starting the Amazon fires, environmentalists say. CNN. Retrieved 26 August 2019 from https://www.cnn.com/2019/08/22/americas/amazon-fires-humans-intl-hnk-trnd/index.html

Where the Wild Things Are

By Dylan Gregory, GEMM Lab summer 2018 intern, OSU undergraduate transfer

In ecology, biodiversity is a term often touted for its key importance in stable ecosystems. Every organism plays its role in the constant struggle of nature, competing and cooperating with each other for survival. The sun provides the initial energy to primary producers, herbivores eat those producers, and predators then eat the consumers. The food chain is a simplistic way to look at how ecosystems work, and of course, it is more like an intricate web of interactions. Fungus and plants work together to trade nutrients and create a vast network of fertile soils; kelp forests provide habitats and food for a variety of prey that marine predators feed on. There are checks and balances between all these organisms that give breath into the beauty and color we see in ecosystems around the world. And, here in Port Orford is no exception. Coming to the project I expected to see some whales, of course. However only three weeks in and I’ve been absolutely astounded with the amount of marine biodiversity we’ve experienced. These past three weeks have been nothing if, well, wild.

Eschrichtius robustus, The Gray Whale

There was no doubt we would see gray whales, that is what we are here for after all, and studying them in the field has been an incredibly enlightening experience. Watching an animal every day for weeks really gets you into their head. You start to connect with them and think about their behaviors in different ways. You begin to realize that the individuals have unique quirks, habits and tendencies. For example, one whale would feed quickly for a time, and then seem to run out of energy and “log” itself, floating on the surface, taking multiple breaths in succession to recover before diving back down. Many whales come from the south, to feed in Mill Rocks before moving to Tichenor Cove, and then leave our study region through “Hell’s Gate” to the North, often resting a moment, taking multiple breaths and then launching into the open sea. Still, when you think you know these whales, they surprise you with an alarming unpredictability, making tracking them a new experience every day.

Figure 1 A gray whale surprised us by surfacing right next to our kayak during a routine zooplankton sampling. The site has shown to have a significant amount of zooplankton and it must have been very interested in the prey available, completely ignoring our presence. Photo by Haley Kent.

The whale in Fig. 1 surprised us, and honestly, being so close to it was as humbling as it was awesome. I expected to see whales, but never expected such a close encounter. These gentle giants are one of our not so distant relatives in the ocean. Many of us do this kind of research for more than just the science and the data. Many of us do it for the connection we feel to our mammal family.

Phoca vitulina richardii, The Pacific Harbor Seal

I absolutely adore these harbor seals! They’re well known for their friendliness towards humans as their dopey little heads pop up out of the water to greet you with a curious look in their eyes. They like to bob in the surf and stare at us while we’re out sampling in the kayak. At first, we got quite excited seeing one, often startling them as we’d squeal “seal!” to each other and they’d dip back under and scurry away. Now though, they seem more comfortable being around our kayak (Fig. 2).

Figure 2 This harbor seal surfaced next to Haley and me shortly before the whale in Fig 1. We named him Courage, as he stuck around and kept us company during the whole encounter. Photo by Haley Kent.

One day a seal followed Lisa and Hayleigh around the jetty on their way back from sampling, swimming around the kayak and investigating them. Out in Mill Rocks, we often see them stretching on top of the rocks, seemingly doing a little yoga session while basking in the morning sun. Despite their cute and cuddly appearance, they are still predators. With plenty of fish to eat and make them happy, these harbor seals are quite plentiful themselves, and I’d like to think we’ve become quite good friends with the little guys.

Tursiops truncatus, The Bottlenose Dolphin

Figure 3 A shot of the dorsal fin seen on August 9th in Mill Rocks. Photo by Dylan Gregory.

One morning we were in Mill Rocks and a large cloud of fog moved in, so we decided to wait it out before making our passage to Tichenor Cove. While sitting there, enjoying a snack, we noticed some dorsal fins popping up about 100 meters from us. Caught by surprise, Haley and I scrambled for our cameras and lo and behold, we noticed they were a small pod of dolphins! Two adults and a calf. Unfortunately, as you can see from our pictures, it is difficult to identify what species they were exactly.

Figure 4 The head and rostrum of the dolphin seen in Mill Rocks on August 9th. Photo by Dylan Gregory.

After communicating with Lisa and Leigh, we have decided that their dorsal fins were far too big and curved to be harbor porpoises (Fig. 3), and the intersection of the head and rostrum seem to have the classic look of a bottlenose dolphin (Fig. 4).

If these were in fact bottlenose dolphins, why are they here in Port Orford, Oregon? It’s uncommon for them to be so far north in our colder waters. Were they foraging for food? Finding refuge from predators? Is it because our waters are becoming warmer? A sighting like this gives more weight to how climate change is affecting our oceans and how marine animals are responding by adapting their migratory and feeding behaviors.

Pisaster and Pycnopodia, The Common Sea Star and the Sunflower Star

Figure 5 Pisaster sea stars and anemones on a rock in Mill Rocks. No Pycnopodia (often called sunflower stars for their many legs) have been spotted in our study zone. Photo by Haley Kent.

One of the coolest aspects of living at the Port Orford Field Station is the fact that we have access to a lot of engagement with other scientists. For instance, we were able to attend a webinar about Sea Star Wasting Disease (SSWD) research currently happening at OSU by Post Doc Sarah Gravem. In a nutshell, a bacterial disease has been infecting sea stars along the west coast, causing a rapid plummet in their populations. Pisaster and Pycnopodia (Fig. 5) have been particularly affected. They are keystone predators, and as such, hold an important role in intertidal ecosystems. Feeding on snails, urchins, other sea stars and various mollusks, these sea stars maintain species populations and allow for a diverse and stable intertidal zone, which then supports many other near shore marine species. While SSWD’s cause is relatively unknown, Pisaster seems to be recovering while Pycnopodia is still struggling. I’ve even heard some anecdotal reports that fishermen here in Port Orford have noticed the lack of Pycnopodia as well, but they are rather pleased that these “ragmops” have stopped mucking up their lines and crab pots.

Below the Surface

There is a charm to the deep, a mystery and wonder that has captured the imagination of humans ad nauseam. Stories, movies, music and masterpieces of art have been inspired by The Abyss. Below the surface lies a diverse world teeming with life, full of questions and answers to be found. While marine mammals are why we’re here, there’s an entirely different environment under the water that is unseen from the safety of our dry, oxygen rich air. Our research doesn’t involve any diving, and so our eyes under the water are a GoPro camera attached to a downrigger on our kayak. Although designed to measure zooplankton community density, we’ve seen quite a bit more than itty bitty sea bugs in the depths of our little harbor here in Port Orford.

Strongylocentrotus purpuratus, The Purple Sea Urchin

Urchins are known for their bright colors and spiny ball like exterior. Close relatives to the sea stars, urchins inhabit the intertidal zones and also take residence within kelp beds. During our kayak training, we passed by some rocks near the cliffs and it was an awesome sight seeing the diversity of intertidal critters such as anemones, sea stars and sea urchins. However, a week into data collection, we have noticed something startling: a large quantity of the urchins cover the seafloor and the kelp, or at least what was left of the kelp (Fig. 6).

Figure 6 Sea Urchins decimating a kelp bed in Tichenor Cove. Photo captured from GoPro footage.

Sea urchins are important members in their communities. They graze on algae and control it from overwhelming the waters, but when left unchecked urchins can completely decimate kelp beds. This pattern is often referred to as “urchin barrens”. Sea otters and sea stars are the urchin’s main predator, and due to the absence of otters and the emergence of SSWD, the occurrence of urchin barrens has risen. An assessment of the reintroduction of the sea otters to Oregon by Dominique Kone, a GEMM Lab graduate student, is underway, and there is a lot of new research on SSWD, both of which could support the ‘ecosystem control’ of urchin populations. We’ve already spotted the urchins wreaking their havoc on the kelp in two separate sites in Tichenor Cove. Since gray whales primarily feed within these kelp beds, this increase in urchin populations is something that we are monitoring. An urchin barren can happen quickly and causes significant ecosystem damage, so this is not something to ignore. If we lose the kelp, it’s easy to imagine that we may lose the whales.

Alopias vulpinus, The Thresher Shark

Figure 7 A thresher shark spotted in Tichenor Cove in Port Orford, OR. Photo captured by GoPro footage.

By far, the most exciting thing I’ve seen so far has been this lovely creature (Fig. 7). The thresher shark usually inhabits the oceanic and coastal zones in tropical and temperate waters. They feed on pelagic schooling fish, squid and sometimes even shorebirds. They attack by whipping their tails (which grow to be the size of their body!) at their prey to stun them. Threshers are on the IUCN Red List of Threatened Species as “Vulnerable” due to their declining populations. They are often hunted for shark fin soup, or by trophy hunters due to their elegant and unique tails.

Haley, our resident shark enthusiast, was able to tell that this shark was a female by the lack of claspers (male appendages) on her pelvic fin. Why was she here though? During the summer, threshers will migrate to colder yet productive northern waters to feed, and on some rare occasions, such as this one, they will come closer to shore. Perhaps she was chasing prey into the harbor and found it to be full of yummy food, or she is a juvenile, which often stay near the continental shelf.

Either way, we were all surprised and excited to see such an exotic and beautiful species of shark caught on camera in our study zone. She even does a little strut in front of the GoPro camera, showing off her beautiful caudal fin!

Protecting our Wilds      

These are only a few examples of the many different animals at work in Port Orford’s ecosystem. Perhaps the biodiversity here is why this is such a hot spot for our whale friends. The productive and lively waters have shown us so many critters, and likely many more we have yet to see. But alas, we have three more weeks of data collection and new discoveries, and I couldn’t be more excited.

“It is a curious situation that the sea, from which life first arose should now be threatened by the activities of one form of that life. But the sea, though changed in a sinister way, will continue to exist; the threat is rather to life itself.”

– Rachel Carson, The Sea Around Us

This experience only drives me further into my pursuit of ecological research. I believe it’s incredibly important to understand the world and how it functions, and to do so before it’s too late. All too often we have breakthrough discoveries in science because something has already fallen apart. Ecosystems are fragile, and climate change, pollution, and other anthropogenic disturbances all have an impact which damage and alter ecosystems and the services they provide. However, it’s an impact we can control with a fundamental understanding of how nature works. With a little hope, some integrity, and a whole lot of passion, I believe we have the power to truly make a difference.

Managing Oceans: the inner-workings of marine policy

By Alexa Kownacki, Ph.D. Student, OSU Department of Fisheries and Wildlife, Geospatial Ecology of Marine Megafauna Lab

When we hear “marine policy” we broadly lump it together with environmental policy. However, marine ecosystems differ greatly from their terrestrial counterparts. We wouldn’t manage a forest like an ocean, nor would we manage an ocean like a forest. Why not? The answer to this question is complex and involves everything from ecology to politics.

Oceans do not have borders; they are fluid and dynamic. Interestingly, by defining marine ecosystems we are applying some kind of borders. But water (and all its natural and unnatural content) flows between these ‘ecosystems’. Marine ecosystems are home to a variety of anthropogenic activities such as transportation and recreation, in addition to an abundance of species that represent the three major domains of biology: Archaea, Bacteria, and Eukarya. Humans are the only creatures who “recognize” the borders that policymakers and policy actors have instilled. A migrating gray whale does not have a passport stamped as it travels from its breeding grounds in Mexican waters to its feeding grounds in the Gulf of Alaska. In contrast, a large cargo ship—or even a small sailing vessel—that crosses those boundaries is subjected to a series of immigration checkpoints. Combining these human and the non-human facets makes marine policy complex and variable.

The eastern Pacific gray whale migration route includes waters off of Mexico, Canada, and the United States. Source: https://www.learner.org/jnorth/tm/gwhale/annual/map.html

Environmental policy of any kind can be challenging. Marine environmental policy adds many more convoluted layers in terms of unknowns; marine ecosystems are understudied relative to terrestrial ecosystems and therefore have less research conducted on how to best manage them. Additionally, there are more hands in the cookie jar, so to speak; more governments and more stakeholders with more opinions (Leslie and McLeod 2007). So, with fewer examples of successful ecosystem-based management in coastal and marine environments and more institutions with varied goals, marine ecosystems become challenging to manage and monitor.

A visual representation of what can happen when there are many groups with different goals: no one can easily get what they want. Image Source: The Brew Monks

With this in mind, it is understandable that there is no official manual on policy development.  There is, however, a broadly standardized process of how to develop, implement, and evaluate environmental policies: 1) recognize a problem 2) propose a solution 3) choose a solution 4) put the solution into effect and 4) monitor the results (Zacharias pp. 16-21). For a policy to be deemed successful, specific criteria must be met, which means that a common policy is necessary for implementation and enforcement. Within the United States, there are a multiple governing bodies that protect the ocean, including the National Oceanic and Atmospheric Administration (NOAA), Environmental Protection Agency (EPA), Fish and Wildlife Service (USFWS), and the Department of Defense (DoD)—all of which have different mission statements, budgets, and proposals. To create effective environmental policies, collaboration between various groups is imperative. Nevertheless, bringing these groups together, even those within the same nation, requires time, money, and flexibility.

This is not to say that environmental policy for terrestrial systems, but there are fewer moving parts to manage. For example, a forest in the United States would likely not be an international jurisdiction case because the borders are permanent lines and national management does not overlap. However, at a state level, jurisdiction may overlap with potentially conflicting agendas. A critical difference in management strategies is preservation versus conservation. Preservation focuses on protecting nature from use and discourages altering the environment. Conservation, centers on wise-use practices that allow for proper human use of environments such as resource use for economic groups. One environmental group may believe in preservation, while one government agency may believe in conservation, creating friction amongst how the land should be used: timber harvest, public use, private purchasing, etc.

Linear representation of preservation versus conservation versus exploitation. Image Source: Raoof Mostafazadeh

Furthermore, a terrestrial forest has distinct edges with measurable and observable qualities; it possesses intrinsic and extrinsic values that are broadly recognized because humans have been utilizing them for centuries. Intrinsic values are things that people can monetize, such as commercial fisheries or timber harvests whereas extrinsic values are things that are challenging to put an actual price on in terms of biological diversity, such as the enjoyment of nature or the role of species in pest management; extrinsic values generally have a high level of human subjectivity because the context of that “resource” in question varies upon circumstances (White 2013). Humans are more likely to align positively with conservation policies if there are extrinsic benefits to them; therefore, anthropocentric values associated with the resources are protected (Rode et al. 2015). Hence, when creating marine policy, monetary values are often placed on the resources, but marine environments are less well-studied due to lack of accessibility and funding, making any valuation very challenging.

The differences between direct (intrinsic) versus indirect (extrinsic) values to biodiversity that factor into environmental policy. Image Source: Conservationscienceblog.wordpress.com

Assigning a cost or benefit to environmental services is subjective (Dearborn and Kark 2010). What is the benefit to a child seeing an endangered killer whale for the first time? One could argue priceless. In order for conservation measures to be implemented, values—intrinsic and extrinsic—are assigned to the goods and services that the marine environment provides—such as seafood and how the ocean functions as a carbon sink. Based off of the four main criteria used to evaluate policy, the true issue becomes assessing the merit and worth. There is an often-overlooked flaw with policy models: it assumes rational behavior (Zacharias 126). Policy involves relationships and opinions, not only the scientific facts that inform them; this is true in terrestrial and marine environments. People have their own agendas that influence, not only the policies themselves, but the speed at which they are proposed and implemented.

Tourists aboard a whale-watching vessel off of the San Juan Islands, enjoying orca in the wild. Image Source: Seattle Orca Whale Watching

One example of how marine policy evolves is through groups, such as the International Whaling Commission, that gather to discuss such policies while representing many different stakeholders. Some cultures value the whale for food, others for its contributions to the surrounding ecosystems—such as supporting healthy seafood populations. Valuing one over the other goes beyond a monetary value and delves deeper into the cultures, politics, economics, and ethics. Subjectivity is the name of the game in environmental policy, and, in marine environmental policy, there are many factors unaccounted for, that decision-making is incredibly challenging.

Efficacy in terms of the public policy for marine systems presents a challenge because policy happens slowly, as does research. There is no equation that fits all problems because the variables are different and dynamic; they change based on the situation and can be unpredictable. When comparing institutional versus impact effectiveness, they both are hard to measure without concrete goals (Leslie and McLeod 2007). Marine ecosystems are open environments which add an additional hurdle: setting measurable and achievable goals. Terrestrial environments contain resources that more people utilize, more frequently, and therefore have more set goals. Without a problem and potential solution there is no policy. Terrestrial systems have problems that humans recognize. Marine systems have problems that are not as visible to people on a daily basis. Therefore, terrestrial systems have more solutions presented to mitigate problems and more policies enacted.

As marine scientists, we don’t always immediately consider how marine policy impacts our research. In the case of my project, marine policy is something I constantly have to consider. Common bottlenose dolphins are protected under the Marine Mammal Protection Act (MMPA) and inhabit coastal of both the United States and Mexico, including within some Marine Protected Areas (MPA). In addition, some funding for the project comes from NOAA and the DoD. Even on the surface-level it is clear that policy is something we must consider as marine scientists—whether we want to or not. We may do our best to inform policymakers with results and education based on our research, but marine policy requires value-based judgements based on politics, economics, and human objectivity—all of which are challenging to harmonize into a succinct problem with a clear solution.

Two common bottlenose dolphins (coastal ecotype) traveling along the Santa Barbara, CA shoreline. Image Source: Alexa Kownacki

References:

Dearborn, D. C. and Kark, S. 2010. Motivations for Conserving Urban Biodiversity. Conservation Biology, 24: 432-440. doi:10.1111/j.1523-1739.2009.01328.x

Leslie, H. M. and McLeod, K. L. (2007), Confronting the challenges of implementing marine ecosystem‐based management. Frontiers in Ecology and the Environment, 5: 540-548. doi:10.1890/060093

Munguia, P., and A. F. Ojanguren. 2015. Bridging the gap in marine and terrestrial studies. Ecosphere 6(2):25. http://dx.doi.org/10.1890/ES14-00231.1

Rode, J., Gomez-Baggethun, E., Krause, M., 2015. Motivation crowding by economic payments in conservation policy: a review of the empirical evidence. Ecol. Econ. 117, 270–282 (in this issue).

White, P. S. (2013), Derivation of the Extrinsic Values of Biological Diversity from Its Intrinsic Value and of Both from the First Principles of Evolution. Conservation Biology, 27: 1279-1285. doi:10.1111/cobi.12125

Zacharias, M. 2014. Marine Policy. London: Routledge.


What it looks like when science meets management decisions

Dr. Leigh Torres
GEMM Lab, OSU, Marine Mammal Institute

It’s often difficult to directly see the application of our research to environmental management decisions. This was not the case for me as I stepped off our research vessel Tuesday morning in Wellington and almost directly (after pausing for a flat white) walked into an environmental court hearing regarding a permit application for iron sands mining in the South Taranaki Bight (STB) of New Zealand (Fig. 1). The previous Thursday, while we surveyed the STB for blue whales, I received a summons from the NZ Environmental Protection Authority (EPA) to appear as an expert witness regarding blue whales in NZ and the potential impacts of the proposed mining activity by Trans-Tasman Resources Ltd. (TTR) on the whales. As I sat down in front of the four members of the EPA Decision Making Committee, with lawyers for and against the mining activity sitting behind me, I was not as prepared as I would have liked – no business clothes, no powerpoint presentation, no practiced summary of evidence. But, I did have new information, fresh perspective, and the best available knowledge of blue whales in NZ. I was there to fill knowledge gaps, and I could do that.

Figure 1. Distribution map of blue whale sightings (through Nov 2016) in the South Taranaki Bight (STB) of New Zealand, color-coded by month. Also identified are the current locations of oil and gas platforms (black flags) and the proposed area for seabed mining (yellow polygon). The green stars denote the location of our hydrophones within the STB that record blue whale vocalizations. The source of the upwelling plume at Kahurangi Point, on the NW tip of the South Island, is also identified.

For over an hour I was questioned on many topics. Here are a few snippets:

Why should the noise impacts from the proposed iron sands mining operation on blue whales be considered when seismic survey activity produces noise 1,000 to 100,000 times louder?

My answer: Seismic survey noise is very loud, but it’s important to note that seismic and mining noises are two different types of sound sources. Seismic surveys noise is an impulsive noise (a loud bang every ~8 seconds), while the mining operation will produce non-impulsive (continuous) sound. Also, the mining operation will likely be continuous for 32 years. Therefore, these two sound sources are hard to compare. It’s like comparing the impacts of listening to pile driving for a month, and listening to a vacuum cleaner for 32 years. What’s important here is to considering the cumulative effects of both these noise sources occurring at the same time: pile driving on top of vacuum cleaner.


How many blue whales have been sighted within 50 km of the proposed mining site?

My answer: Survey effort in the STB has been very skewed because most marine mammal sighting records have come from marine mammal observers aboard seismic survey vessels that primarily work in the western regions of the STB, while the proposed mining site is in the eastern region. So at first glance at a distribution map of blue whale sightings (Fig. 1) we may think that most of the blue whales are found in the western region of the STB, but this is incorrect because we have not accounted for survey effort.

During our past three surveys in the STB we have surveyed closer to the proposed mining site. In 2014 our closest point of survey approach to the mining site was 26 km, and our closest sighting was 63 km away. In 2016, we found no whales north of 40’ 30” in the STB and the closest sighting was 107 km away from the proposed mining site, but this was a different oceanographic year due to El Niño conditions. During this recent survey in 2017, our closest point of survey approach to the proposed mining site was 22 km, and our closest sighting was 29 km, with a total of 9 sightings of 16 blue whales within 50 km of the proposed mining site. With all reported sighting records of blue whales tabulated, there have been 16 sightings of 33 blue whales within 50 km of the proposed mining site. Considering the minimal survey effort in this region, this is actually a relatively high number of blue whale sighting records near the proposed mining site.

Additionally, we have a hydrophone located 18.8 km from the proposed mining site. We have only analyzed the data from January through June 2016 so far, but during this period we have an 89% daily detection rate of blue whale calls.


Why are blue whales in the STB and where else are they found in NZ?

My answer: A  wind-driven upwelling system occurs off Kahurangi Point (Fig. 1) along the NW coast of the South Island. This upwelling brings nutrient rich deep water to the surface where it meets the sunlight causing primary productivity to begin. Currents push these productive plumes of water into the STB and zooplankton, such as krill that is the main prey item of blue whales, aggregate in these productive areas to feed on the phytoplankton. Blue whales spend time in the STB because they depend on the predictability of these large krill aggregations in the STB to feed efficiently.

Sightings of blue whales have been reported in other areas around New Zealand, but nowhere with regular frequency or abundance. There may be other areas where blue whales feed occasionally or regularly in New Zealand waters, but these areas have not been documented yet. We don’t know very much about these newly documented New Zealand blue whales, yet what we do know is that the STB is an important foraging area for these animals.


Questions like these went on and on, and I was probed with many insightful questions. Yet, the question that sticks with me now was asked by the Chair of the Decision Making Committee regarding the last sentence in my submitted evidence where I remarked on the importance of recognizing the innate right of animals to live in their habitat without disturbance. “This sounds like an absolute statement,” claimed the Chair, “like no level of disturbance is tolerable”. I was surprised by the Chair’s focus on this statement over others. I reiterated my opinion that we, as a society, need to recognize the right of all animals to live in undisturbed habitats whenever we consider any new human activity. “That’s why we are all here today”, I explained to the committee, “to recognize and evaluate the potential impacts of TTR’s proposed mining operation on blue whales, and other animals, in the STB”. Undisturbed habitat may not always be achievable, but when we make value-based decisions regarding permitting industrial projects we need to recognize biodiversity’s right to live in uncompromised environments.

I do not envy this Decision Making Committee, as over three weeks they are hearing evidence from all sides on a multitude of topics from environmental, to economic, to cultural impacts of the proposed mining operation. They will be left with the very hard task of balancing all this information and deciding to approve or decline the mining permit, which would be a first in NZ and may open the floodgates of seabed mining in the country. My only hope is that our research on blue whales in NZ over the last five years has filled knowledge gaps, allowing the Decision Making Committee to fully appreciate the importance of the STB habitat to NZ blue whales, and appropriately consider the potential impacts of TTR’s proposed mining activities on this unique population.

A blue whale surfaces in a calm sea in the South Taranaki Bight of New Zealand (Photo L. Torres).

Understanding How Nature Works

By: Erin Pickett, MS student, Oregon State University

They were climbing on their hands and knees along a high, narrow ridge that was in places only two inches wide. The path, if you could call it that, was layered with sand and loose stones that shifted whenever touched. Down to the left was a steep cliff encrusted with ice that glinted when the sun broke down through the thick clouds. The view to the right, with a 1,000ft drop, wasn’t much better.

The Invention of Nature by Andrea Wulf

This is a description of Alexander von Humboldt and the two men that accompanied him when attempting to summit Chimborazo, which in 1802 was believed to be the highest mountain in the world. The trio was thwarted about 1,000 ft from the top of the peak by an impassable crevice but set a record for the highest any European had ever climbed. This was a scientific expedition. With them the men brought handfuls of scientific instruments and Humboldt identified and recorded every plant and animal species along the way. Humboldt was an explorer, a naturalist, and an observer of everything. He possessed a memory that allowed him to recount details of nature that he had observed on a mountain in Asia, and find patterns and connections between that mountain and another in South America. His perspective of nature as being interconnected, and theories as to why and how this was so, led to him being called the father of Ecology. In less grandeur terms, Humboldt was a biodiversity explainer.

Humboldt sketched detailed images like this one of Chimborazo, which allowed him to map vegetation and climate zones and identify how these and other patterns and processes were related. Source: http://www.mappingthenation.com/blog/alexander-von-humboldt-master-of-infographics/

In a recent guest post on Carbon Brief, University of Connecticut Professor Mark Urban summarized one of his latest publications in the journal Science, and called on scientists to progress from biodiversity explainers to biodiversity forecasters.  Today, as global biodiversity is threatened by climate change, one of our greatest scientific problems has become accurately forecasting the responses of species and ecosystems to climate change. Earlier this month, Urban and his colleagues published a review paper in Science titled “Improving the forecast for biodiversity under climate change”. Many of our current models aimed at predicting species responses to climate change, the authors noted, are missing crucial data that hamper the accuracy and thus the predictive capabilities of these models. What does this mean exactly?

Say we are interested in determining whether current protected areas will continue to benefit the species that exist inside their boundaries over the next century. To do this, we gather basic information about these species: what habitat do they live in, and where will this habitat be located in 100 years? We tally up the number of species currently inhabiting these protected areas, figure out the number of species that will relocate as their preferred habitat shifts (e.g. poleward, or higher in elevation) and then we subtract those species from our count of those who currently exist within the boundaries of this protected area. Voilà, we can now predict that we will lose up to 20% of the species within these protected areas over the next 100 years*.  Now we report our findings to the land managers and environmental groups tasked with conserving these species and we conclude that these protected areas will not be sufficient and they must do more to protect these species. Simple right? It never is.

This predication, like many others, was based on a correlation between these species ranges and climate. So what are we missing? In their review, Urban et al. outline six key factors that are commonly left out of predictive models, and these are: species interactions, dispersal, demography, physiology, evolution and environment (specifically, environment at appropriate spatiotemporal scales) (Figure 1). In fact, they found that more than 75% of models aimed at predicting biological responses to climate change left out these important biological mechanisms. Since my master’s project is centered on species interactions, I will now provide you with a little more information about why this specific mechanism is important, and what we might have overlooked by not including species interactions in the protected area example above.

Figure 1: Six critical biological mechanisms missing from current biodiversity forecasts. Source: Urban et al. 2016

I study Adelie and gentoo penguins, two congeneric penguin species whose breeding ranges overlap in a few locations along the Western Antarctic Peninsula. You can read more about my research in previous blog posts like this one. Similar to many other species around the world, both of these penguins are experiencing poleward range shifts due to atmospheric warming. The range of the gentoo penguin is expanding farther south than ever before, while the number of Adelie penguins in these areas is declining rapidly (Figure 2). A correlative model might predict that Adelie penguin populations will continue to decline due to rising temperatures, while gentoo populations will increase. This model doesn’t exactly inform us of the underlying mechanisms behind what we are observing. Are these trends due to habitat shifts? Declines in key prey species? Interspecific competition? If Adelie populations are declining due to increased competition with other krill predators (e.g. gentoo penguins), then any modelling we do to predict future Adelie population trends will certainly need to include this aspect of species interaction.

Figure 2. A subset of the overall range of Adelie and gentoo penguins and their population trends at my study site at Palmer Station 1975-2014. Source: https://www.allaboutbirds.org/on-the-antarctic-peninsula-scientists-witness-a-penguin-revolution/

Range expansion can result in novel or altered species interactions, which ultimately can affect entire ecosystems. Our prediction above that 20% of species within protected areas will be lost due to habitat shifts does not take species interactions into account. While some species may move out of these areas, others may move in. These new species may potentially outcompete those who remain, resulting in a net loss of species larger than originally predicted. Urban et al. outline the type of data needed to improve the accuracy of predictive models. They openly recognize the difficulties of such a task but liken it to the successful, collective effort of climate scientists over the past four decades to improve the predictive capabilities of climate forecasts.

As a passionate naturalist and philosopher, there is no doubt Humboldt would agree with Urban et al.’s conclusion that “ultimately, understanding how nature works will provide innumerable benefits for long-term sustainability and human well-being”. I encourage you to read the review article yourself if you’re interested in more details on Urban et al.’s views of a ‘practical way forward’ in the field of biodiversity forecasting. For a historical and perhaps more romantic account of the study of biodiversity, check out Andrea Wulf’s biography of Alexander von Humboldt, called The Invention of Nature.

 *This is an oversimplified example based off of a study on biodiversity and climate change in U.S. National parks (Burns et al. 2003)

References:

Burns, C. E., Johnston, K. M., & Schmitz, O. J. (2003). Global climate change and mammalian species diversity in US national parks. Proceedings of the National Academy of Sciences100(20), 11474-11477.

Urban, M. 14 September 2016. Carbon Brief. Guest post: How data is key to conserving wildlife in a challenging environment. From: https://www.carbonbrief.org/guest-post-data-key-conserving-wildlife-changing-climate (Accessed: 22 September 2016)

Urban, M. C., Bocedi, G., Hendry, A. P., Mihoub, J. B., Pe’er, G., Singer, A., … & Gonzalez, A. (2016). Improving the forecast for biodiversity under climate change. Science353(6304), aad8466.

Wulf, A. (2015). The Invention of Nature: Alexander Von Humboldt’s New World. Knopf Publishing Group.