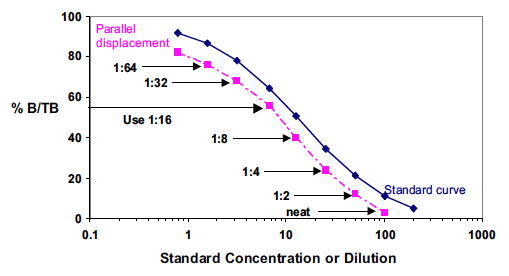
Figure 6: Example of a good parallelism test. The dark blue line indicates the standard curve; the pink line indicates a good parallelism test, showing a parallel displacement; and the ratios in black indicate the dilution factors.
Source: Brown et al. (2005)