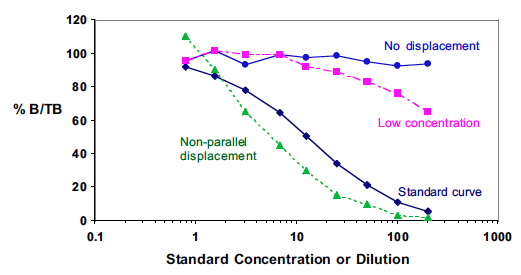
Figure 7: Examples of bad parallelism tests. The dark blue line indicates the standard curve; the light blue line is an example of no displacement; the pink line is an example of low concentration of the sample; and the green line is an example of non-parallel displacement.
Source: Brown et al. (2005)