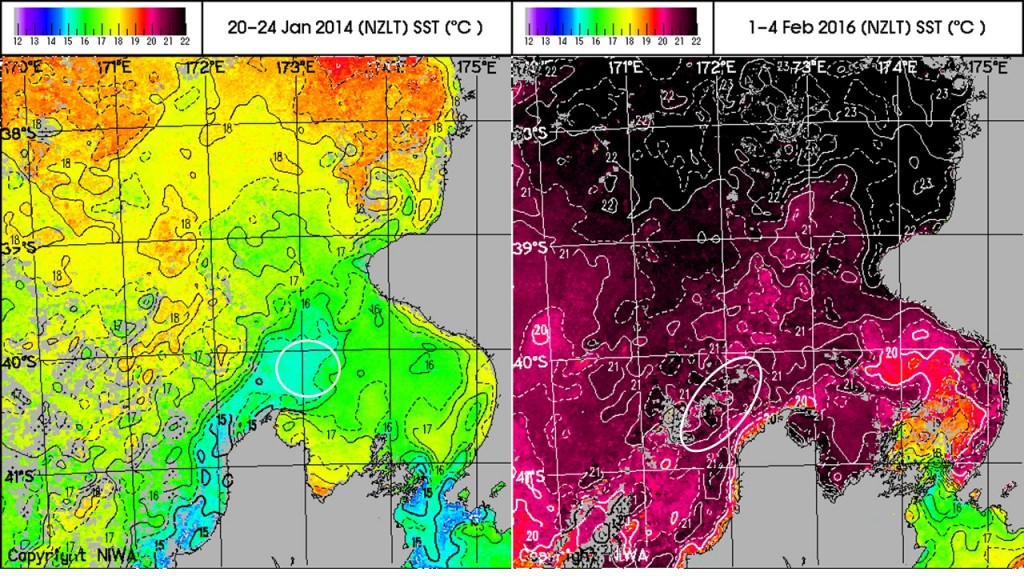
Figure 1. A comparison of satellite images of sea surface temperature (SST) in the South Taranaki Bight region of New Zealand between late January 2014 and early February 2016. The white circles on each image denote where the majority of blue whales were encountered during each field season.