How do you identify “an expert”? The answer to this question is more complex than you might think. Most of us might think of people with multiple degrees or extensive experience in a specific field as experts. However, as our guest this week is discovering, experts can be people with passion, people with connections or people with specific job titles. Recognizing the enacted and relationally valued characteristics of an expert is essential to creating systems where experts that reflect a community’s ideas and values are the ones making the decisions. One example is the community of people around and connected to the Puget Sound watershed region and the jurisdiction of the Puget Sound Partnership: an area spanning 12 counties and 28 recognized Tribal Nations. Large restoration efforts are underway to restore Puget Sound and prime the ecosystem for climate adaptation. These efforts hinge on not just access to climate adaptation knowledge, but who is recognized to apply such knowledge and the social structures to shape its uptake.
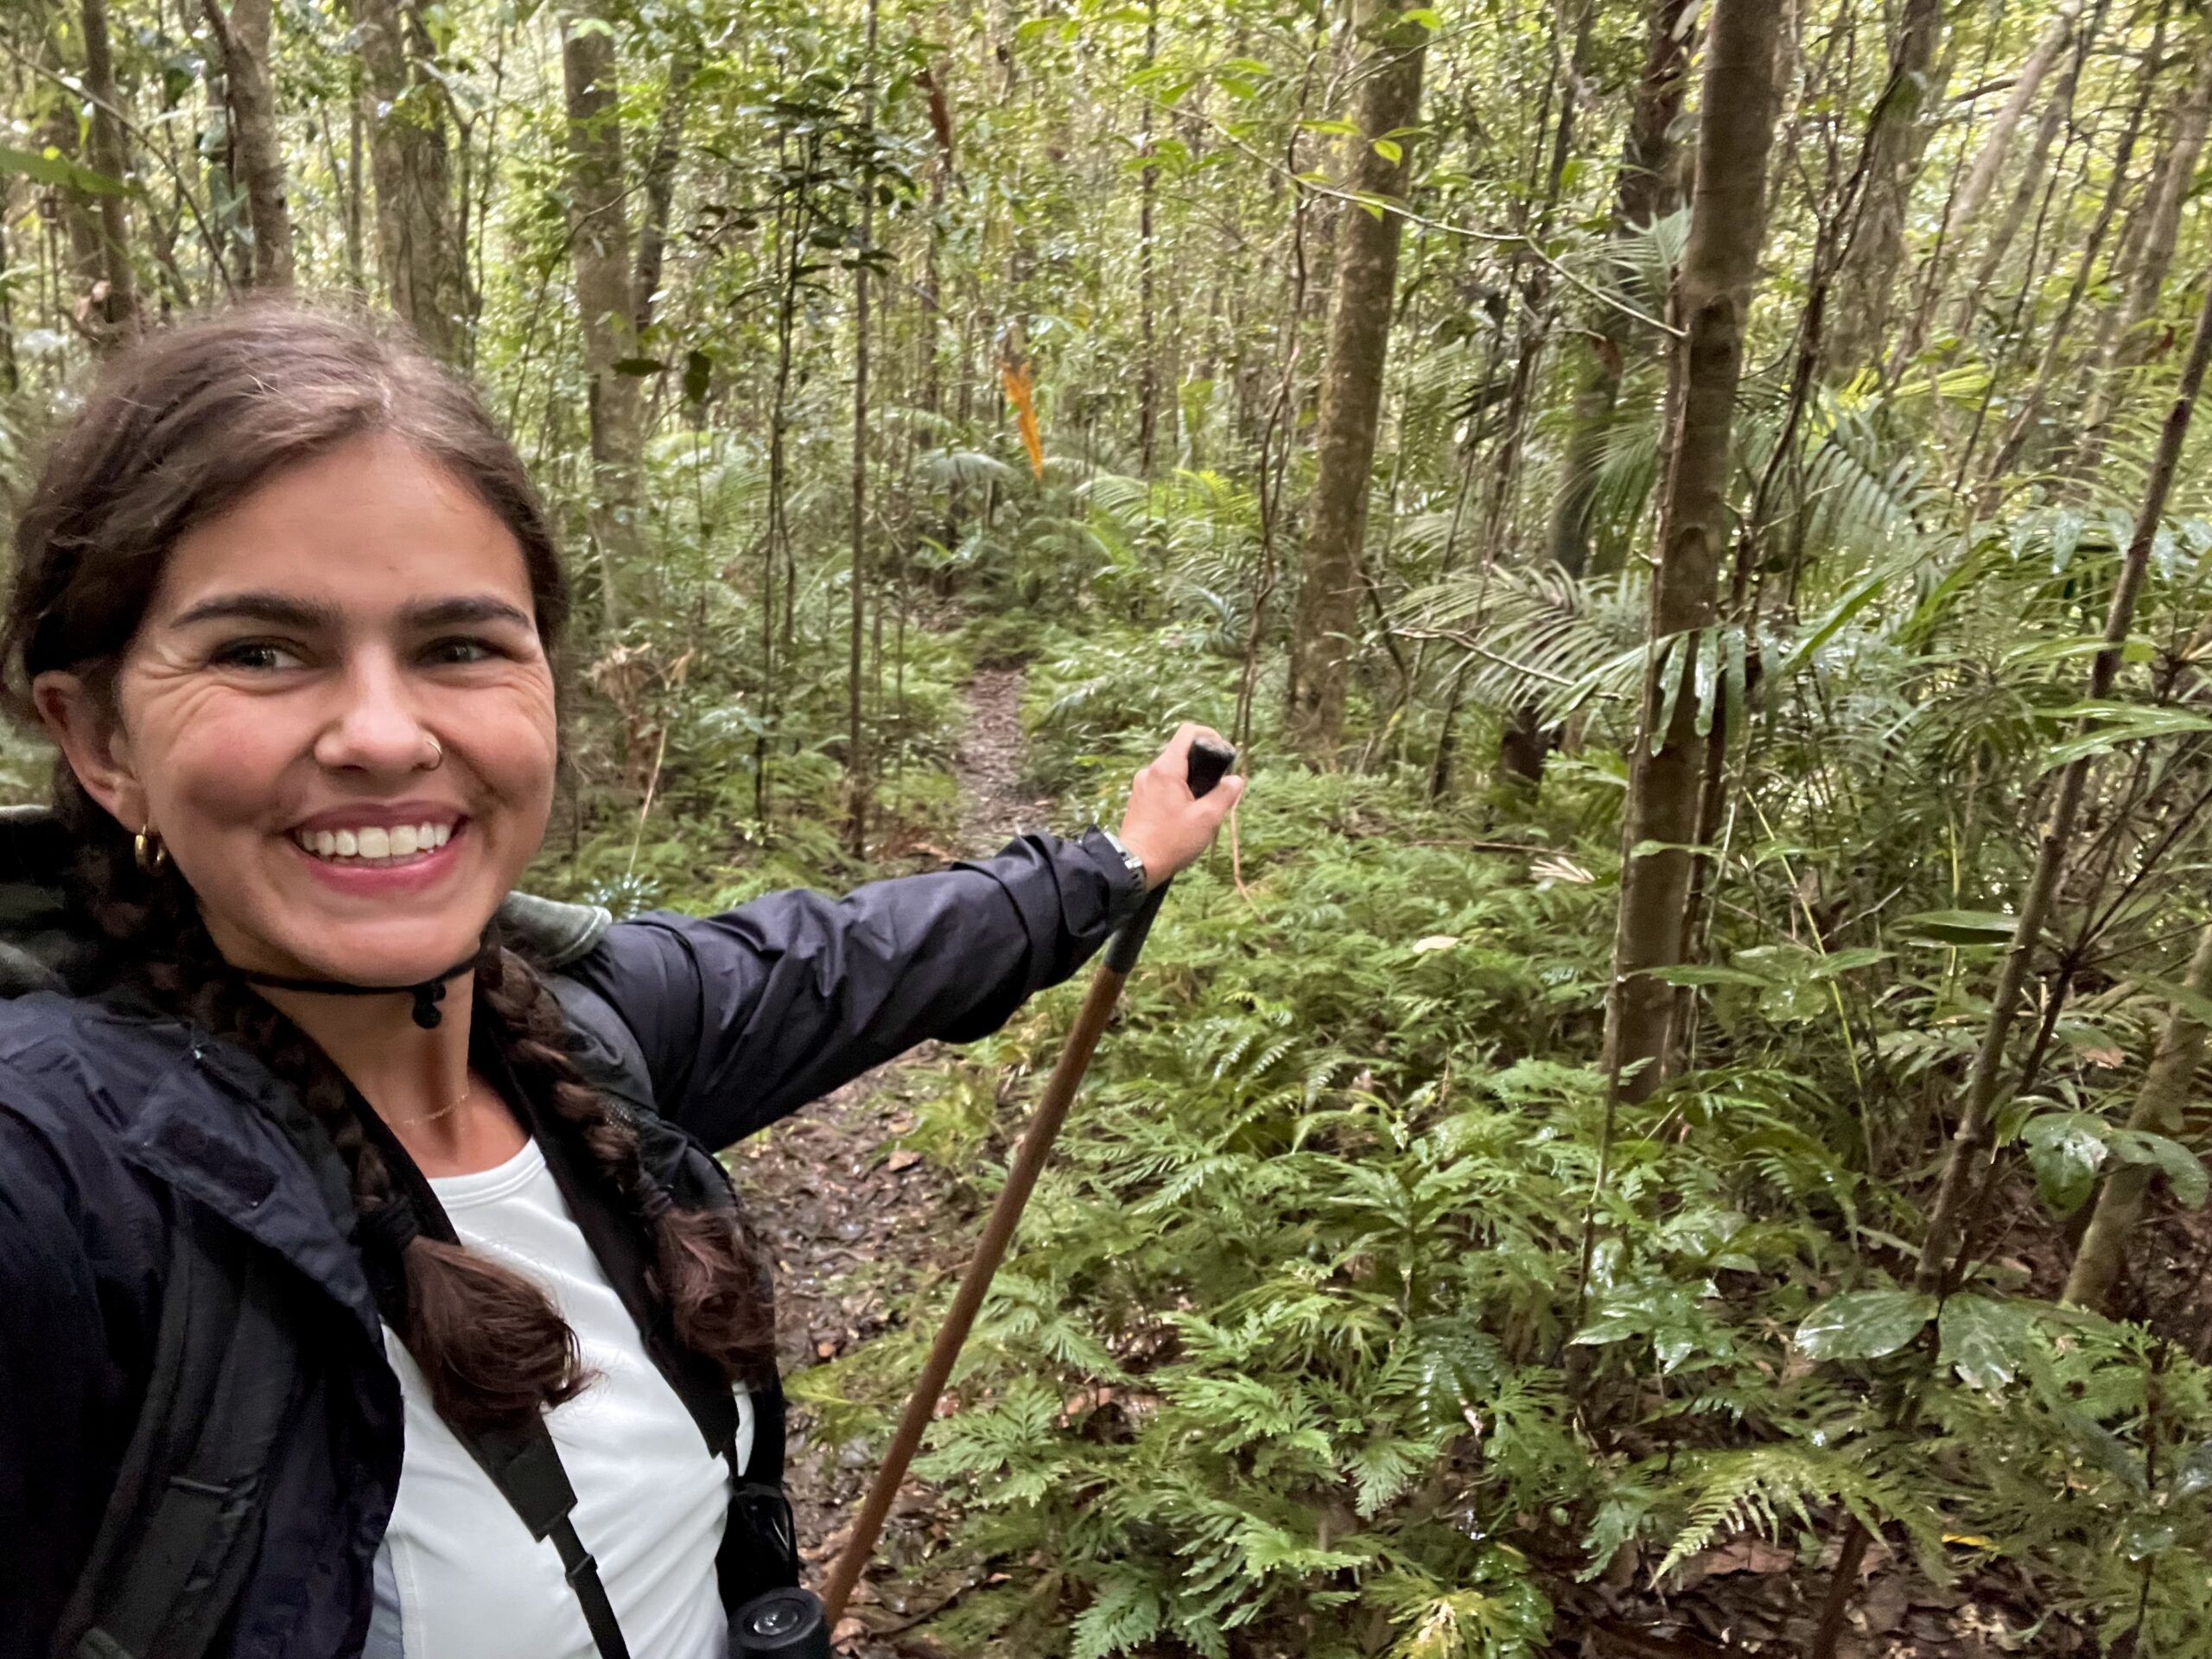
Our guest this week is Krista Harrington, a 4th year PhD Candidate in the Department of Fisheries, Wildlife, and Conservation Sciences. Krista utilizes political ecology and science, technology, and society theory in environmental natural resource management. During her Bachelor’s degree, Master’s degree and time spent working in wildlife conversation, she kept asking herself “who are we going to for expertise?”. This question ultimately shaped the path of her PhD work and is how she is contributing to restoring Puget Sound.
Tune into 88.7 KBVR Corvallis this Sunday (Nov. 23rd) @ 7pm to hear Krista explain her approach to understanding how the Puget Sound community defines what an expert looks like and how they are developing effective pathways for expert integration into climate adaptation strategies.
The Oregon Coast is known for its ruggedness and harsh weather, but also offers a prime opportunity to spot gray whales on their migratory paths. These majestic marine mammals undertake one of the largest migrations of any animal, traveling from the Arctic to Baja California to breed before heading back north along this “whale super-highway.” Despite having the mechanisms to feed in the water column, these benthic specialists prefer bottom feeding, scooping up sand from the seafloor and filtering out invertebrate prey through their baleen, likely targeting locations of high caloric content. However, along the coast of the Pacific Northwest, a behavior known as ‘prey switching’ has been observed, where gray whales feed in the water column instead of their preferred benthic prey, amphipods. Our upcoming guest, Taylor Azizeh, a first-year Ph.D. student at the Marine Mammal Institute, explores what may be driving this prey switching behavior.
Polar regions are among the top locations to be impacted by climate change, which Taylor suspects may be responsible for grey whales switching from benthic to pelagic prey. Changes in bottom water temperature and sediment grain size may result in habitats less favorable for amphipods, leading whales to seek food elsewhere. In response to warming, the distribution of other predators may shift to where they compete for the same food source, or the reduced sea ice cover could result in more productive pelagic waters. How do gray whales, these benthic specialists, adapt to changing food availability?
Gray whale populations often experience boom and bust cycles or unknown mortality events, with the most recent one currently underway. Taylor’s research on the foraging plasticity of gray whales is not only timely, but also employs a holistic approach using a combination of methods to assess the big picture. She plans to use stable isotopes to provide information on what whales are feeding on, but only when combined with GPS tags tracking movement and drone photogrammetry measuring body conditions can one understand where and why. Taylor plans to utilize this combination to ask big picture questions such as whether they’re feeding in areas of high biomass, if they return to those same areas, and how much adaptability can individual gray whales display?
At its core, Taylor’s research delves into the adaptability of gray whales. Gray whales have survived the ice ages, proving their ability to deal with harsh conditions, and Taylor hypothesizes they may be more flexible than we currently understand.
To learn more about Taylor’s passion for these charismatic animals of ecological, social, and cultural importance, the adventure which led here to grad school—from Costa Rica to Ecuador, Denmark, and London—tune in to KBVR 88.7 FM this Sunday, Nov. 3. You can listen to the episode anywhere you listen to your podcasts, including on KBVR, Spotify, Apple, or anywhere else!
There’s a big difference between human time and Earth–or soil–time. It’s what makes climate impacts so difficult to imagine, and climate solutions so challenging to fully realize. Take it from someone who knows: Adrian Gallo has spent the last decade studying the very idea of “permanence.”
It took an entire day to dig a 1x1x1 meter perfectly square soil pit in the HJ Andrews Experimental Forest outside of Eugene, Oregon. It’s a terribly cumbersome process, but you get much better data from this sampling method compared the conventional methods and the photos are better.
Adrian has dug through a lot of dirt. As a recent PhD graduate in soil science, his research focused on the carbon sequestration potentials of soil. Soil holds about twice as much carbon as our atmosphere. If you factor in permafrost (frozen soils in cold regions that are rapidly thawing) then soil holds nearly three times more carbon than both the atmosphere and all vegetation combined. And that’s a lot.
Let’s back up a second for a quick carbon cycle overview: plants use CO2 to produce sugars through photosynthesis. Microbes eat these sugars, inhaling oxygen and respiring CO2, and when plants and soil decay, they release carbon dioxide back into the atmosphere. There’s a delicate balance between soil being a carbon sink (absorbing more carbon than it releases) or a carbon source (the opposite). More carbon dioxide in the atmosphere = more greenhouse gasses; more climate uncertainty.
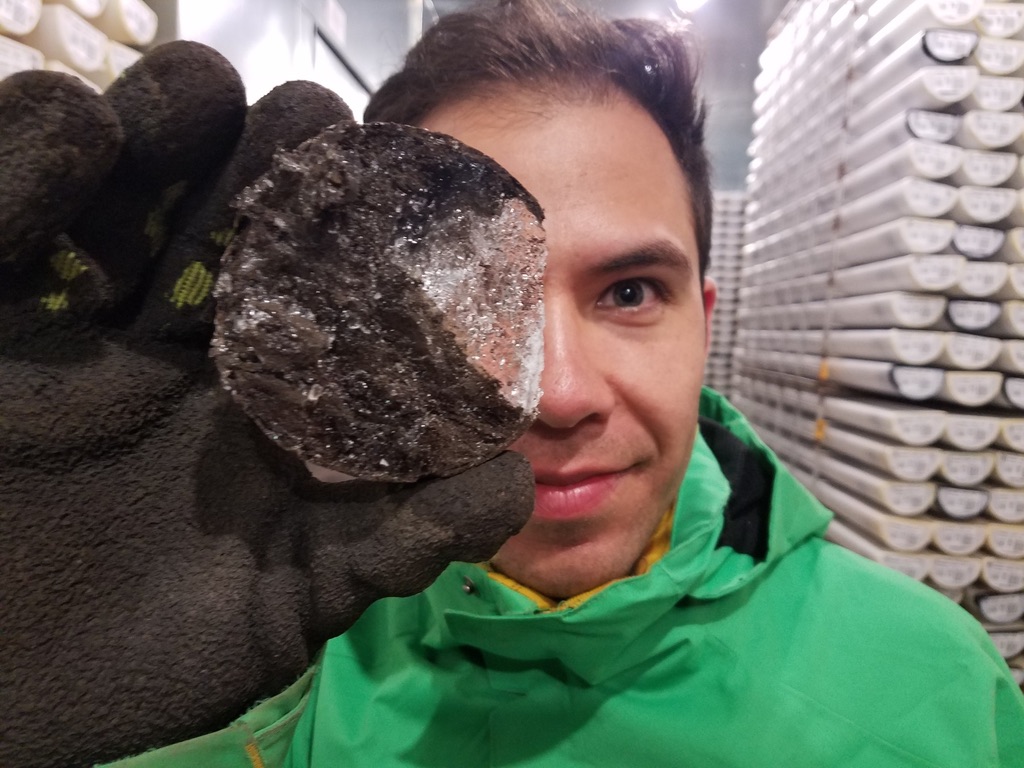
Some of Adrian’s soil samples included sites in Alaska where the ground is permanently frozen year around, leading to pockets of frozen water, leading to the presence of an “ice wedge” seen here. In order to preserve the integrity (physical, chemical, and biological) of these unique soils, sampling and processing had to occur in a walk in freezer.
Soil’s a tricky thing to study. The age of carbon stored in soil ranges widely. Some plant-derived carbon enters the soil and cycles back into the atmosphere in a number of hours, but other soil carbon can remain underground for thousands of years. And around 12,000 years ago (right around the end of the last ice age) soils used to hold nearly 10% more organic carbon than they do now. Most of that carbon loss came along with the spread of industrial agriculture in the last 200 years. If we could regain some of that carbon storage capacity, we’d have a powerful natural climate solution.
Adrian examined soil cores from nearly 40 representative ecosystems across North America. Adrian’s research was unique in not only its depth (at below 30 cm they tested beyond most existing soil research) but also its length (part of a 30 year project).
The findings? First, soil can indeed be a natural climate solution, but only if farmers can be convinced to alter their land management practices in perpetuity. Many land management practices to prevent carbon escape have been largely the same since the Dust Bowl (minimize tilling, plant natural windbreaks, cover crops, etc) but the expense has not made the switch financially worthwhile. To incentivize farmers, the emerging carbon market allows farm managers to get paid for the carbon they store by selling credits to large companies wanting to offset their emissions. It’s an interesting idea, but also plagued with problems. Big corporations are eager to market themselves as more climate friendly, which often leads to greenwashing. But more importantly, there’s a big question over how long this carbon needs to stay in the soil in order for it to count as a credit. It’s easier to motivate a farmer to alter their land management for 30 years–but that’s thinking in human time, not soil time, and that shortsightedness has some dire consequences, even if moving in the right direction. Now try convincing farmers to use these practices for 100 years–still not on the same scale as soil, but certainly getting closer, and an even tougher sell.
Second, much to Adrian’s and the other researchers’ surprise, there seemed to be a homogenizing effect in endmembers of the soil. No matter what plant types grew aboveground, the distribution of plant-end-members was largely the same, from grasslands to mountain ranges. Adrian coined this term “ecosystem inertia” and it’s still not known why exactly this happens.
When you think of a coral reef, what do you picture? Perhaps you imagine colorful branching structures jutting out of rock and the sea floor, with flourishing communities of fish swimming about. Or if you’ve been paying attention to news about global warming for the past decade or two, maybe you picture desolate expanses of bleached corals, their bone-like structures eerily reminiscent of a mass graveyard.
What you might not picture is a zoomed-in view of the coral ecosystem: the multitude of bacteria, fungi, viruses, and algae that occupy the intricate crevices of every coral. While corals are indeed animals in their own right, they belong to a complex symbiotic relationship with these microorganisms: the algae, which are more specifically dinoflagellates, provide energy to the coral through the process of photosynthesis. Bacteria occupying the mucus layers cycle nutrients and play a role in defense against pathogen invasion through the production of antimicrobial peptides.
One lesser-known member of this community, or the coral ‘holobiont’ as it is called, are the viruses. It’s probable that, like other members of the holobiont, they contribute to the health of the coral in some way, but this role is as of yet unclear. Our guest this week is Emily Schmeltzer, a fifth year PhD student in the Vega Thurber lab in the Department of Microbiology, and these elusive viruses are exactly what she is trying to uncover.
Emily Schmeltzer, PhD candidate in Rebecca Vega-Thurber’s lab, takes a sample of a coral
“We don’t know a ton about viruses on coral reefs,” says Schmeltzer. “ We know that some probably cause disease or mortality through infections, but we don’t really know exactly what a lot of them are doing, because marine viral ecology is such a relatively new field,” she explains.
It’s not surprising: viruses, while the most abundant and diverse entity on earth, are incredibly tiny and difficult to detect in environments where other organisms also thrive. Part of the challenge is that they have no universally conserved genes: that is, no easy way to tell the genes from viruses apart from the genes of other organisms. When studying bacteria, a gene called the 16S rRNA gene can be used as a sort of ‘name tag’ – every bacteria has this gene, whereas other organisms do not. There’s no such thing for viruses, making them difficult to study if you don’t already know what you’re looking for.
Schmeltzer is studying the viruses that live on corals and their response to climate change. To do this, her PhD research has involved a massive spatiotemporal study (spatio = across different locations, temporal = across multiple time points) looking at nearly 400 individual coral colonies of three different species over 3 years. All of these colonies are off the coast of the Moorea, a small island in French Polynesia in the South Pacific. The ultimate goal of the project is to contribute to the ongoing data collection for the Moorea Coral Reef Long Term Ecological Research project, and to characterize virus community diversity and potential function in the health of these corals.
Studying coral reefs is a big leap for Schmeltzer, who hails from the land-locked deserts of New Mexico. She was always interested in biology, which she attributes to her dad bringing home dead scorpions to look at together when she was a child. Arthropods ultimately ended up becoming her first research subjects: as an undergraduate at the University of New Mexico, she worked in an insect and spider taxonomy lab, before pivoting to working on West Nile virus.
So how did this insect-loving desert-dweller end up studying viruses that live on corals in the ocean? To learn more about Schmeltzer’s career trajectory, her love of corals, and the challenges of viral research, tune in to Inspiration Dissemination this Sunday, April 2nd at 7 PM. Listen live at 88.7 FM or on the live stream, or catch the episode after the show wherever you get your podcasts!
During winter months, a few days after the full moon, thousands of fish make their way to the warm tropical waters off the west coast of Little Cayman, Cayman Island. Nassau Grouper are typically territorial and don’t interact often, but once per year, they gather in the same spot where they all spawn to carry on the tradition of releasing gametes, in the hopes that some of them will develop to adulthood and carry on the population.
Our guest this week is Janelle Layton, a Masters (and soon to be PhD) student in Dr. Scott Heppel’s lab in the Department of Fisheries, Wildlife, and Conservation Sciences. Janelle’s research focuses on this grouper, which is listed as near threatened under the Endangered Species Act. Overfishing has been the largest threat to Nassau Grouper populations, but another threat looms: warming waters due to climate change. This threat is what Janelle is interested in studying – how does the warming water temperature affect the growth and development of grouper larvae?
Janelle with a curious sea turtle
Each winter Janelle travels to this aggregation site in the Cayman Islands, where these large groups of grouper (grouper groups?) aggregate for a few days to reproduce. During this time, she collects thousands of fertilized Nassau Grouper eggs to take back to the lab and study. These eggs will develop in varying water temperatures for 6 days, where each day a subset of samples are preserved for future analysis.
Spawning groupers
So far, Janelle is finding that the larvae raised in higher temperatures tend to demonstrate not only an increase in mortality, but an increase in variability in mortality. What does this mean? Basically, eggs from some females are able to survive and develop under these stressful conditions better than eggs from other females – so is there a genetic component to being able to survive these temperature increases?
The answer may lie in proteins
Aside from development and mortality, Janelle is investigating this theory by measuring the expression of heat shock proteins in the fertilized eggs and larvae. Heat shock proteins are expressed in response to environmental stressors such as increased temperatures, and can be measured through RNA sequencing. The expression of these proteins might hold the key to understanding why some grouper are more likely to survive than others. Janelle’s work is a collaborative effort between Oregon State University, Scripps Institute of Oceanography, Reef Environmental Education Foundation and the Cayman Islands Department of Environment.
To learn more about Nassau Grouper, heat shock proteins, and what it’s like being a Black woman in marine science, tune into Janelle’s episode this upcoming Sunday, March 12th at 7 PM! Be sure to listen live on KBVR 88.7FM, or download the podcast if you missed it. You can also catch Janelle on TikTok or at her website.
Coral reef ecosystems offer a multitude of benefits, ranging from coastline protection from storms and erosion to a source of food through fishing or harvest. In fact, it is estimated that over half a billion people depend on reefs for food, income, and/or protection. However, coral reefs face many threats in our rapidly changing world. Climate change and nutrient input due to run-off from land are two stressors that can affect coral health. How exactly do these stressors impact corals? This week’s guest Alex Vompe is trying to figure that out!
Alex is a 4th year PhD candidate in the Department of Microbiology at OSU, where he is co-advised by Dr. Becky Vega-Thurber and Dr. Tom Sharpton. The goal of Alex’s research is to understand how coral microbe communities change over time and across various sources of stress. While the microbial communities of different coral species can differ, typically under normal, non-stressed conditions, they look quite similar. However, once exposed to a stressor, changes start to arise in the microbial community between different coral species, which can have different outcomes for the coral host. This pattern has been coined the ‘Anna Karenina principle’ whereby all happy corals are alike, however as soon as things start to go wrong, corals suffer differently.
Alex is testing how this Anna Karenina principle plays out for three different coral species (Acropora retusa, Pocillopora verrucosa [also known as cauliflower coral], Porites lobata [also known as lobe coral]) in the tropical Pacific Ocean. The stressors that Alex is investigating are reduction in herbivory and introduction of fertilizer. A big source of stress for reefs is when fish populations are low, which results in a lack of grazing by fish on macroalgae. In extreme situations, macroalgae can overgrow a coral reef completely and outcompete it for light and resources. Fertilizers contain a whole host of nutrients with the intent of increasing plant growth and production on land. However, these fertilizers run-off from land into aquatic ecosystems which can often be problematic for aquatic flora and fauna.
How is Alex testing the effects of these stressors on the corals? He is achieving this both in-situ and in the lab. Alex and his lab conduct field work on coral reefs off the island of Moorea in French Polynesia. Here, they have set up experimental apparatus in the ocean on coral reefs (via scuba diving!) to simulate the effects of reduced herbivory and fertilizer introduction. This field work is conducted three times a year. When not under the water surface, Alex sets up aquaria experiments on land in Moorea using coral fragments, which he has been able to grow in order to investigate the microbial communities more closely. These samples then get processed in the lab at OSU for genomic analysis and Alex uses bioinformatics to investigate the coral microbiome dynamics.
Alex underwater in Moorea
Curious to know more about Alex’s research? Listen live on Sunday, October 23, 2022 at 7 PM on KBVR 88.7FM. Missed the live show? You can download the episode on our Podcast Pages! Also, feel free to follow Alex on Twitter (@AVompe) and Instagram (@vompedomp) to learn more about him and his research.
Around 80,000 years ago, the Earth was in the middle of the late Pleistocene era, and much of Canada and the northern part of the United States was blanketed in ice. The massive Laurentide Ice Sheet covered millions of square miles, and in some places, up to 2 miles thick. Over vast timescales this ice sheet advanced its way across the continent slowly, gouging out what we now know as the Great Lakes, carving the valleys, depositing glacial tills, and transforming the surface geology of much of the southern part of Canada and northern US. Further west, the Cordilleran ice sheet stretched across what is now Alaska, British Columbia, and the northern parts of the Western US, compressing the ground under its massive weight. As these ice sheets depressed the land beneath them, the Earth’s crust bulged outwards, and as the planet warmed and the ice sheets began to melt, the pressure was released, returning the crust underneath to its previous shape. As this happened, ocean water flowed away, resulting in lower sea levels locally, but higher levels across the other side of the planet.
The effects of massive bodies of ice forming, moving, and melting are far from negligible in their impact on the overall geology of the region, the sea level throughout history, and the patterns of a changing climate. Though there are only two ice sheets on the planet today, deducing the ancient patterns and dynamics of ice sheets can help researchers fill the geological record and even make predictions about what the planet might look like in the future. Our guest on Inspiration Dissemination this week is PhD candidate and researcher Schmitty Thompson, of the Department of Geology in CEOAS. Thompson is ultimately trying to answer questions about ice distribution, sea levels, and other unknown parameters that the geologic record is missing during two different ice age warming periods. Their research is very interdisciplinary – Thompson has degrees in both math and geology, and also uses a lot of data science, computer science, and physics in their work. They are using computer modeling to figure out just what the shorelines looked like during this time period around 80,000 years ago.
Schmitty Thompson, fourth year PhD candidate with Jessica Creveling in the Geology Department.
“I use models because the geologic record is pretty incomplete – the further back you go, the less complete it is. So by matching my models to the existing data, we can then infer more information about what the shoreline was like,” they explain. To do this accurately, Thompson feeds the model what the ice sheets looked like over the course of around 250,000 years. They also need to incorporate other inputs to the model to get an accurate picture – variables such as the composition of the interior of the Earth, the physics of Earth’s interior, and even the ice sheets’ own gravitational pull (ice sheets are so massive they exert a gravitational pull on the water around them!)
Using math to learn about ice
The first equation to describe global changes in sea level was published in 1976, with refining throughout the 90s and early 2000s. Thompson’s model builds on these equations in two versions: one which can run in about 10 minutes on their laptop, and another which can take multiple weeks and must run on a supercomputer. The quicker version uses spherical harmonics as the basis function for the pseudospectral formulation, which is basically a complex function that does math and incorporates coefficient representations of the earth’s radius, meridional wave numbers, variation across north/south and east/west, and a few other variables. The short of it is that it can perform these calculations across a 250k time span relatively quickly, but it makes assumptions about the homogeneity of the earth’s crust and mantle viscosity. Think of it like a gumball: a giant, magma-filled gumball with a smooth outer surface and even layers. So while this method is fast, the assumptions that it makes means the output data is limited in its usefulness. When Thompson needs a more accurate picture, they turn to collaborators who are able to run the models on a supercomputer, and then they work with the model’s outputs.
While the model is useful for filling in gaps in the historical record, Thompson also points out that it has uses in predicting what the future will look like in the context of a changing climate. After testing out these models and seeing how sensitive they are, they could be used by researchers looking at much smaller time scales and more sensitive constraints for current and future predictions. “There are still lots of open questions – if we warm the planet by a few degrees, are we going to collapse a big part of Antarctica or a small part? How much ice will melt?”
To learn more about ice sheets, sea levels, and using computer models to figure out how the shoreline looked thousands of years ago, tune in to Schmitty Thompson’s episode on Inspiration Dissemination this upcoming Sunday evening at 7 PM PST. Catch the show live by streaming on https://kbvrfm.orangemedianetwork.com/, or check out the show later wherever you get your podcasts!
Thompson was also recently featured on Alie Ward’s popular podcast Ologies. You can catch up with all things geology by checking out their episode here.
Here at Inspiration Dissemination, we are fascinated by the moments of inspiration that lead people to pursue graduate studies. For our next guest, an experience like this came during a boat trip accompanying the National Oceanic and Atmospheric Administration (NOAA) on a research expedition. Becky Smoak, an M.S. student in OSU’s Marine Resource Management program, remembers feeling in awe of the vibrant array of marine life that she saw, including whales, sunfish, and sharks. Growing up on a farm in eastern Washington, Becky had always wanted to be a veterinarian. During her undergraduate studies at Washington State University, she came to feel that the culture of pre-veterinary students was too cutthroat. In search of something more collaborative, she came to Oregon State in summer 2019 for a Research Experience for Undergrads (REU) and was impressed by the support and inclusivity of her research mentors. A couple years later, Becky is now on the cusp of graduation after her time spent studying marine life.
Becky’s graduate work is the continuation of a long-running collaboration between Oregon State and NOAA out of the Hatfield Marine Science Center in Newport. Beginning in 1996 under the direction of Bill Peterson, a team of researchers has monitored oceanic conditions along a route called the Newport Hydrographic, which extends in a straight line eastward from the Oregon Coast and intersects the northern part of the vast Californian Current. The team takes samples of ocean water at fixed points along the route and analyzes the concentrations of plankton and other organisms or compounds of interest.
Becky Smoak, teaching on the OSU research vessel The Elakha.
The specific biochemicals that Becky studies are Omega-3 fatty acids. In a set of experiments from the 1930s, rats fed with a diet poor in Omega-3 fatty acids eventually died, demonstrating that these compounds are essential to life and are not produced by mammals. Two types of Omega-3 fatty acids, called EPA and DHA, can only be synthesized by phytoplankton, microscopic photosynthetic organisms that live in the ocean. The ability of phytoplankton to produce fatty acids is intimately linked with oceanic temperature. Studies have shown that increases in sea surface temperature and decreases in nutrient availability can decrease the quality of fatty acids in phytoplankton, thus decreasing food availability and quality in the marine environment. Fatty acid levels have downstream effects on the ecosystem, for example on copepods, a type of zooplankton that feeds on phytoplankton. Becky’s team affectionately refers to the copepod colony of the chilly northern Pacific as the “cheeseburger” copepods, in contrast to the “celery” copepods of the southern Pacific colony. The present-day effect of temperature also points to a key ecological challenge, as warming oceans due to climate change could disrupt the supply of this vital nutrient.
In her thesis work, Becky seeks to untangle the contributions of phytoplankton community structure to oceanic Omega-3 fatty acid levels. She uses a set of statistical methodologies called nonmetric multidimensional scaling to uncover correlations in the datasets. A particularly interesting instrument used to collect her data is a flow cytometry robot dubbed ‘Lucy’. Lucy uses advanced imaging to count individual plankton and characterize their sizes. This yields an improvement in accuracy over older monitoring techniques that assumed a fixed size for all plankton. Becky’s goal for finishing her thesis is to create a statistical procedure for predicting fatty acid availability given information on phytoplankton population structure.
To hear more about Becky’s journey to OSU, her experiences as a first-generation college student, and the fascinating role of Omega-3s in marine ecosystems, be sure to tune in this Sunday October 9th at 7pm on KBVR.
The overlap between environmental science and social justice are rare, but it has been around since at least the early 1990’s and is becoming more well-known today. The framework of Environmental Justice was popularized by Robert Bullard when his wife, a lawyer, asked him to help her with a case where he was mapping all the landfills in the state of Texas and cross reference the demographics of the people who lived there. Landfills are not the most pleasant places to live next to, especially if you never had the opportunity to choose otherwise. Bullard found that even though Houston has a 75% white population, every single city-owned landfill was built in predominantly black neighborhoods. The environmental hazards of landfills, their emissions and contaminated effluent, were systematically placed in communities that had been – and continue to be – disenfranchised citizens who lacked political power. Black people were forced to endure a disproportionate burden of the environmental hazards, and procedural justice was lacking in the decision making process that created these realities. Unfortunately, this is not a unique situation to Houston, or Texas, because this pattern continues today.
Environmental justice is an umbrella term that we cannot fully unpack in a blogpost or a single podcast, but it is fundamentally about the injustices of environmental hazards being forced upon disadvantaged communities who had little to no role in creating those hazards. This is not a United States-specific issue although we do focus on state-side issues in this episode. In fact, some of the most egregious examples occur in smaller and lesser known countries (see our episode with Michael Johnson, where his motivation for pursuing marine sciences in graduate school is because the islands of micronesia where he grew up are literally being submerged by the rising seas of global warming). The issues we discuss are multifaceted and can seem impossible to fix. But before we can fix the issues we need to really understand the socio-political-economic ecosystem that has placed us exactly where we are today.
To begin to discuss all of this, we have Chris Hughbanks who is a graduate student at Oregon State and one of the Vice Presidents of the local Linn-Benton NAACP branch and a member of their Environmental and Climate Justice committee (Disclaimer: Adrian is also a branch member and part of the committee). We begin the discussion with a flood in Chris’ hometown of Detroit. Chris describes how they never really had floods because when precipitation occurs it’s usually either not that much rain or cold enough for it to snow instead. Because it hardly rains that much, very few people have flood insurance. But that pesky climate change is making temperatures warmer and precipitation events more intense than ever before causing flooding to occur in 2014, 2016, 2019, and 2020. As you might guess, the effects of this natural disaster were not equally shared by all citizens of Detroit. We discuss the overlap between housing discrimination and flood areas, how the recovery effort left so many out to [not] dry.
We end the episode with ways to get involved at the local level. First, consider learning more about the Linn-Benton NAACP branch, and the initiatives they focus on to empower local communities. Vote, vote, vote, and vote. Make sure you’re registered, and everyone else you know is registered to vote. And recognize these problems are generations in the making, and it will take just as long to fully rectify them. Finally, I am reminded of an episode interviewing millennial writers about what it means to be born when global warming was a niche research topic, but to come of age when climate change has become a global catastrophe. They rightfully point out that there are a myriad of possibilities for human salvation and sacrifice for every tenth of a degree between 1.5 and 3.0°C of warming that is predicted by the most recent 6th edition of the IPCC report. As grim as our future seems, what an awesome task for our generations to embark upon to try and “create a polity and economy that actually treats everybody with dignity, I cannot think of a more meaningful way to spend a human life.”
If you missed the show, you can listen to this episode on the podcast feed!
Additional Reading & Podcast Notes
The Detroit Flood – We mentioned the NPR article reporting that 40% of people living in Detroit experienced flooding, how black neighborhoods were at higher risk to flooding, and that renters (who are disproportionately black) were nearly twice as likely to experience flooding compared to those who owned their homes. We also mentioned a map of Detroit, showing which areas are more at risk of flooding. Another local article described how abnormal that summer in Detroit and the surrounding areas were compared to other years.
We listed a number of Environmental Justice links that include:
Dumping in Dixie, the 1990 book written by Robert Bullard which is considered essential reading for many law school courses on environmental justice.
We listed the organizing principles of the modern environmental justice movement, first codified in 1991 at the First National People of Color Environmental Leadership Summit
A story near Los Angeles where mixed-use city zoning laws allowed industrial businesses to operate near residential areas, causing soil lead pollution that was unknown until Yvette Cabrera wrote her own grant to study the issue. Read her story in Grist: Ghost of Polluter’s Past that describes the immense efforts she and researchers had to go through to map soil lead contamination, and how the community has used that information to generate positive change for the community.
Environmental [in]justice afflicts the global south as well, where a majority of forest loss since the 1960’s has occurred in the tropical regions of the world.
Adrian mentioned a number of podcasts for further listening:
Two past Inspiration Dissemination episodes with Holly Horan on maternal infant stress in Puerto Rico and her experience conducting research after Hurricane Maria, and Michael Johnson who one of his motivation to go to graduate school was because where he grew up – Micronesia – has been feeling the rising seas of climate change long before other countries.
A deep investigative journalism podcast calledFloodlines about the events leading up to Hurricane Katrina in 2005 and what happened after (or, what should have happened).
If all this hurricane and flooding talk has got you down, consider that heat kills more people in the US than floods, hurricanes, or tornadoes according to the National Weather Service.
We also discussed the 2021 heat dome in the Pacific Northwest. This led to Oregon passing some of the strongest protections for heat for farmworkers (and others working outside). Consider reading a summary of wildfire effects on outdoor workers, and a new proposal in Oregon to pay farmworkers overtime (this proposal was recently passed in March of 2022). Related to farmworkers, Adrian mentioned the 2013 Southern Poverty Law Center’s analysis of guest visa worker programs titled Close to Slavery: Guestworker programs in the United States.
We returned to the fact that housing is central to so many injustices for generations. The Color of Law: A forgotten history of how our government segregated America by Richard Rothstein is a historical analysis of the laws and policies that shaped today’s housing patterns. One example Rothstein often cites is the construction of freeways purposefully routed through black communities; recently one developer accidentally said the quiet part out loud in explaining where a gas pipeline was routed because they choose “the path of least resistance“. We also mentioned that in 2019 and in 2020, Corvallis has ~37% of its residents being rent burdened (meaning households spend more than 50% of their income on rent), which is the worst city in the state over both years. You can also read about a California Delta assessment that focuses on agricultural shifts in the region due to land erosion and flooding, but they mention how current flood risk is tied to historical redlining.
Our climate in the next thirty years will not look the same as today, and that’s exactly why our energy systems will also soon look completely different. Energy systems are the big umbrella of how and where we create electricity, how we transport that electricity, and how we use electricity. We’re discussing the past and the future of our energy environment with Emily Richardson, a Masters of Engineering student in the Energy Systems Program.
Emily Richardson preparing for some good trouble
When our energy infrastructure was originally built, energy generation, transport, and usage was a one-way street. Utility companies made or acquired the electricity, built poles and wires to transport that electricity to then be used in homes and businesses. Although that infrastructure was only made to last 50 years, many are pushing 100 years of operation.
“If it ain’t broke, don’t fix it” some might say, but we’re not living in the same energy reality when the infrastructure was originally built. For in-depth visuals of our energy generation and usage, we recommend viewing Lawrence Livermore National Labs. Now we have a different energy portfolio (e.g. wind and solar) but there’s also a two-way street of electricity movement that is required. Rooftop solar helps power individual homes, but when zero to little energy is being used in-house and it’s sunny outside, that excess energy generation on your rooftop moves back upstream and can fulfill energy needs in other places. A two-way street is quickly being paved. It’s worth remembering that energy is on demand, meaning we only make exactly as much energy as what’s being used. If there is excess generation in a highly distributed way (i.e. home solar panels) it adds another level of complexity to our energy systems because there is no “overflow” valve for electricity.
Imagine if your toilet, that slowly moves water in one direction, was suddenly expected to move water in the other direction and back and forth as quick as the speed of light? Yikes indeed. City-wide plumbing infrastructure was bult to accommodate the most extreme events like the Super Bowl flush (when everyone in the city/state/country runs to the bathroom at halftime). While it’s an extreme circumstance, the infrastructure was built to prepare for it, and it works! But our energy systems were hardly made for this kind of reverse movement of energy, especially on a large scale as more people install rooftop solar.
Beyond the two-way street, there’s also rush hour to worry about. The UK is known for their tea; at a specific time after a popular TV show ends about one-million teakettles get turned on simultaneously. Without planning and foresight this would lead to an electricity shortage and people losing power. But the UK government imports 200-600 megawatts of energy, sometimes coming from a hydroelectric dam and/or nuclear energy, to accommodate their hot tea requirements. It’s surprisingly complicated to move this much power all at once, but with strategic planning there are solutions!
Everything in the energy world is physically connected. Even if the poles and wires and outlets are hidden behind walls there’s an immense amount of planning and design that you will never see because if infrastructure is working well, you can accidently forget its existence. When it fails, it can fail catastrophically. The 2020 Holiday Farm Fire in Oregon was initiated by downed powerlines, and the 2018 Paradise Fire in California was also initiated by malfunctioning powerlines. There are a multitude of reasons why those fires were especially damaging (location of ignition, exceptionally dry fuels, extreme wind events, drought and insect stressed trees, too many trees per acre, etc.), and why wildfires will get worse in the future (rising temperatures and changing precipitation patterns).
But our collective future requires energy, a lot of it, to be efficiently distributed and stored that requires a radical shift in our hardware, software, and maybe even our philosophy of energy usage. You don’t want to miss the discussion with Emily who will give us the deep dive on how we arrived at our energy reality and what our energy future will need to look like. This conversation is happening at 7pm on KBVR 88.7 FM, but you can also listen via the podcast feed.
Emily Richardson preparing for some adventures on the kayak
Additional Notes On air we mentioned a few resources that can provide more deep dives! The first is the Energy Gang Podcast that focuses on energy, clean technology, and the environment. The Big Switch Podcast is a five-part series on how the power grid works and how upcoming changes to the gird can help society. The Volts Podcast is an interview based show untangling our messy climate future and hopeful energy transitions. Emily mentioned a presentation titled Imagining a Zero Emissions Energy System.