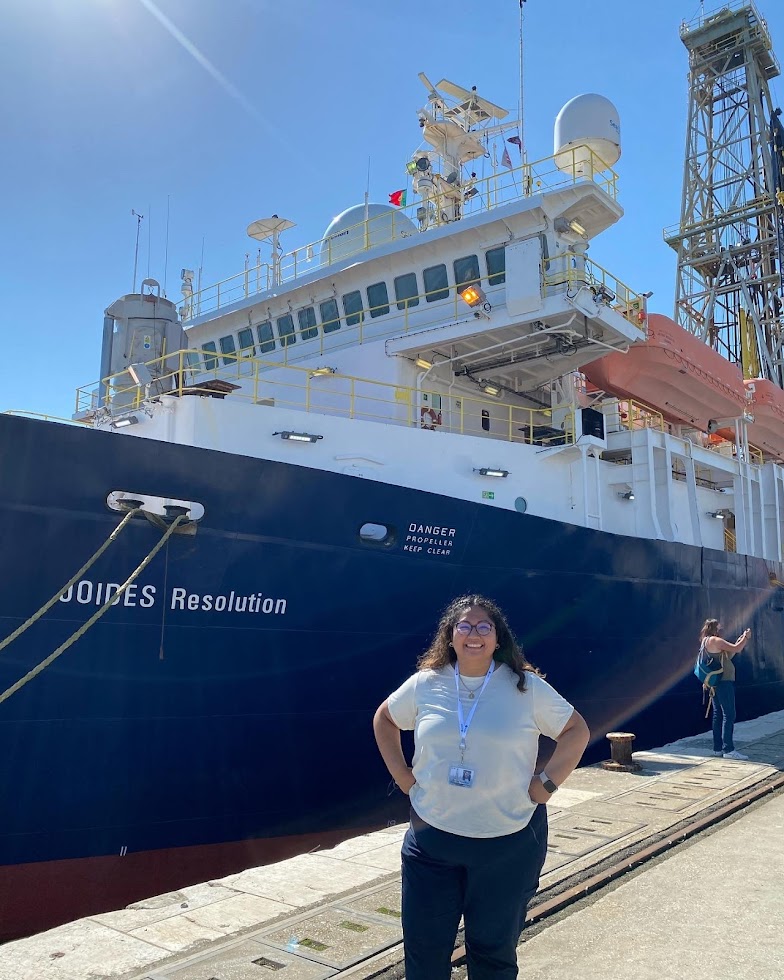
From October 2022 to December 2022, I was onboard the iconic International Ocean Discovery Program (IODP) JOIDES Resolution. We were drilling into the ocean floor just off the coast of Portugal. Our goal was to recover sediment from 4 sites that held promising evidence for records of large-scale climate change. To reach our goals, the ship worked 24/7 for 8 weeks, with most people being assigned to day (noon to midnight) or night (midnight to noon) shifts. I was assigned to the night shift. Here’s what most of my days looked like.
Exp 397 Locations . Figure provided by the International Ocean Discovery Program (IODP)
“Morning” (10pm-12am)
My mornings began just two hours shy of midnight. I would wake up and take a short three-minute commute to the gym on board. The gym was surprisingly fully equipped with many cardio machines, free weights, and even a rock climbing finger board. Typically, the gym was rather empty at this time and I could connect my phone to the Bluetooth speaker and blast Beyonce’s Renaissance album while I strut on the treadmill.
After my workout, I would head back to my room and begin getting ready for the day. A few steps in my routine I would never miss were (1) taking my vitamin D pills to make up for the lack of sun I saw, (2) putting on my gold hoops that reminded me of my family and my culture, and (3) putting out my laundry so it was done by the time my shift was over.
Finally, with about 20 minutes left I would rush upstairs to the galley (cafeteria) and quickly eat cereal before reporting to the lab.
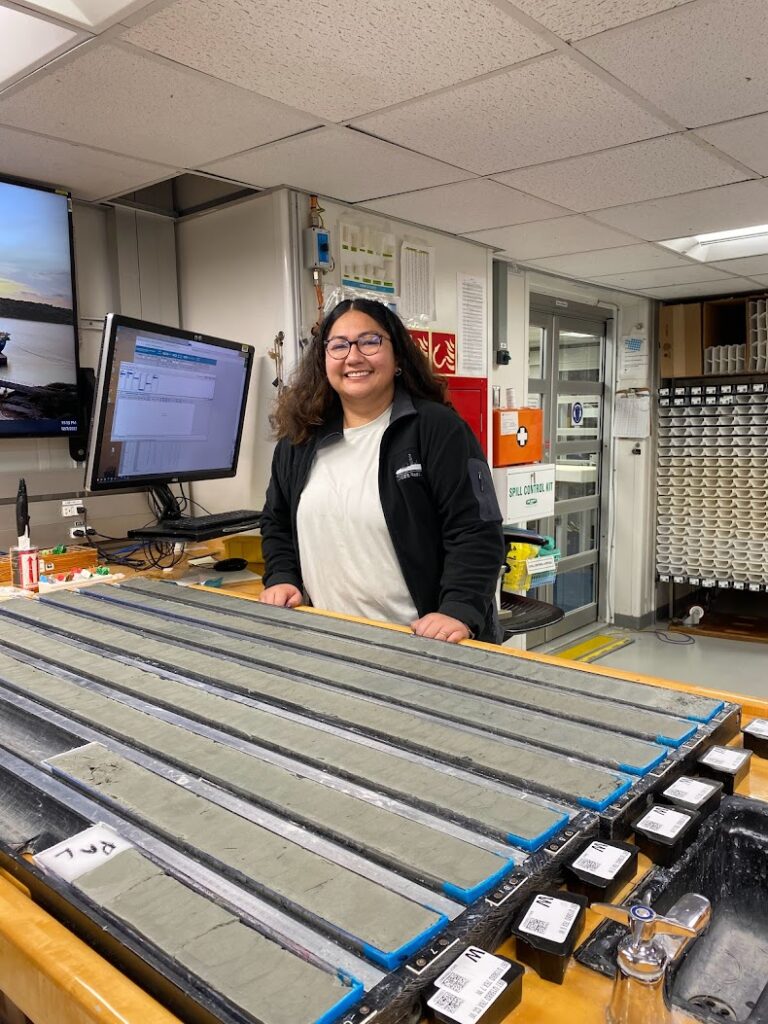
During Shift (12am – 12pm)
I sailed as a scientist and was assigned to be a physical properties specialist. I had many duties on board including running cores through multiple instruments, writing reports, and taking samples of the cores. However, before I could even start with any of my duties we would begin every shift with a crossover meeting with folks from the last shift. We would update each other on how many cores we had drilled, any issues that came up, and any resolutions found during the shift. After the crossover meeting, I would pick up where the day shift left off. During the majority of my shift I would be lifting core sections that were 1.5 meters long and about 15- 20 lbs and moving them on and off the rack to different instruments. Truthfully, during the first week I felt so sore that my arms would pulse in pain while trying to sleep. Towards the end of the expedition though, I was strong and lifting cores felt like second nature to me.
During shift we were always well fed. We had snack breaks every three hours which featured an array of drinks and freshly baked goods. At the six-hour mark we would have lunch and the menu was different every day. A few of my favorite dishes served included peanut butter chicken with rice, lentil dahl, and pulled pork burgers. The best part of every week was Sunday lava cakes. It reminded us that another week has passed on the ship. The lava cake was adored by all on the ship so much that there was a dedicated countdown clock for the lava cake. I really miss the lava cakes.
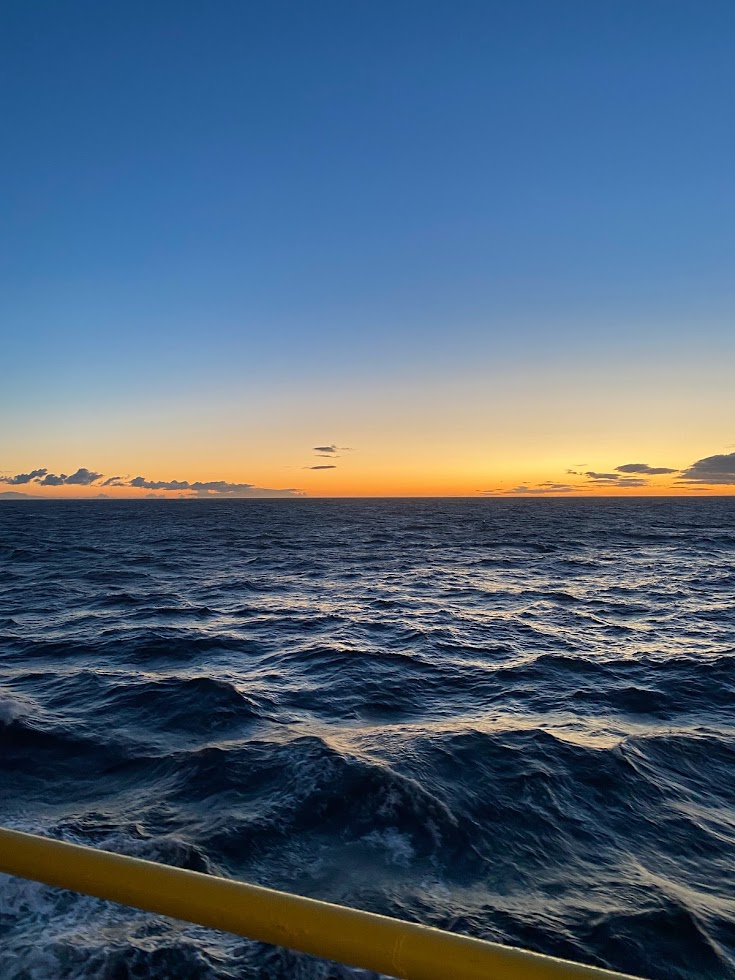
My favorite part of the shift had to be the short 10 minutes when many scientists would gather outside to watch the sunrise together. I saw some of the most beautiful sunrises in my life on this expedition. It was breathtaking being able to see the sunrise in the open ocean with no trees, buildings, or mountains obscuring my view. So many shades of purple, pink, blue, fiery red, and orange danced across wispy and fluffy clouds. One time I even saw the infamous “green flash” which is an optical phenomenon in which the sun changes color to green for just one moment at sunrise or sunset.
After sunrise I knew the end of my shift was close, and I would begin to write down in my daily report what happened during shift for the next crossover meeting.
After shift (12pm- 2am)
Immediately after shift I would eat dinner with the rest of the scientists and technicians from my shift. I would try to have a light dinner as I would often be trying to sleep within the next two hours, and it’s a little hard to sleep with a full stomach on a rolling ship. Sometimes a group of scientists would gather in the movie room and watch a film. The movies we would watch depended on the shift. If the shift was slow because we were waiting to drill due to weather, then we would watch a high-energy action movie. If the shift was full of constant movement and a little more tiring than usual, then we would watch a comedy or something more light-hearted.
I would often have time after my shift to call home. Luckily, all scientists were given internet access on one personal device. I chose to have my phone as my device so I could text and call my loved ones throughout the day easily.
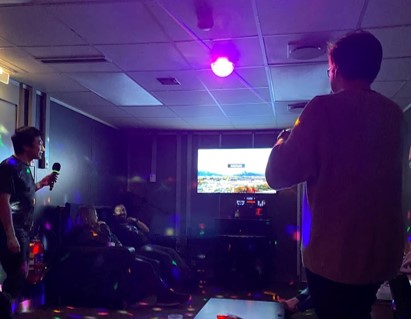
After our shifts was when we would celebrate holidays, birthdays, and expedition milestones. We were able to celebrate both Halloween and Thanksgiving onboard with themed meals. We sang karaoke and had dance parties. I would give haircuts and paint people’s nails. We would try our hand at photography with cool 360° cameras. It was a great time to get closer to the other scientists on board and really humanized scientists for me.
Last thoughts
Overall, I really enjoyed my experience on Expedition 397. It provided a unique environment for me to interact and live with people from around the world. The scientific team was lovely, and the staff onboard were knowledgeable and inclusive. I would highly recommend any graduate student interested in deep sea drilling to apply to an IODP cruise!
Follow more of Saray’s science on Twitter at @paleosanchez and of the IODP Expedition 397 cruise under the hashtag #Exp397.
Imagine a time when you’ve watched the sun sink just below the horizon and the sky and clouds reflect spectacular shades of oranges, yellows, pinks and lavenders. Now imagine this scene playing out for hours because the sun is moving in a wide, low arc just above or below the horizon. This is what the sky looks like at latitudes above the Arctic Circle around late fall/early winter when the sun sets for a few months. I experienced this multi-hour sunrise/sunset for the first time in the Beaufort Sea in November 2022, while participating in fieldwork onboard the R/V Sikuliaq.
As I was preparing for the cruise, I knew it was going to be dark for much of the time due to the proximity to winter, but I thought the transition would be distinct, taking place over a short period of time. While most of the time was dark, we experienced exquisite twilight with slow sunrises transitioning into slow sunset for a few hours a day. This time was magical, watching the shifting light and clouds across the ice, sea and mountain scapes. Most of the science crew had a daily routine of going outside to brave the bitter, cold winds to observe this magic.
Photo Credit Amanda Kowalski
Photo Credit Lloyd Pikok
The science crew was composed of many different research groups, all collecting data to understand various parts of the Arctic ocean system. My primary responsibilities involved monitoring and downloading data from instruments called chipods that measure temperature changes really quickly (100x/second). We use this data and some theory to compute turbulent dissipation rates. Higher dissipation rates indicate places where there is greater turbulent mixing. For example, if we have a cup of coffee and pour cream into it, it will eventually mix and combine together. If we take a spoon and stir the liquid in that cup, this causes higher amounts of turbulence which will combine the coffee and cream more quickly. Our spoon is the “event” that causes greater amounts of turbulence. Measuring turbulent dissipation rates helps us to understand the distribution and transport of heat, nutrients, and contaminants in the ocean.
I also spent a bit of time observing and capturing the shifting light, the reflections across the land-sea-sky-scape through watercolor painting. In my “normal,” land-based life, I pay attention to the way in which the light shifts in the spaces I occupy throughout the days and seasons. This careful attention has helped me develop a strong seasonal sense of the light and shadows in my own home and neighborhood. I am particularly drawn to the light at the edges of the day – sunrises and sunsets. In the mid-latitudes, the sunrise and sunset are fleeting, with the golden glow lasting for a short period of time. In the Arctic, this time is prolonged, providing me an opportunity to explore and practice capturing this special light through watercolor painting.
Painting and other creative pursuits have been an integral part of my identity from my childhood. Only recently, I have realized the extent to which my identities as a scientist and artist are deeply intertwined. I enjoy using painting as a tool to explore my surroundings, record my observations, capture details, and describe my overall big picture feelings or moments. This creative practice fuels my curiosity and perception, both integral parts of being a scientist.
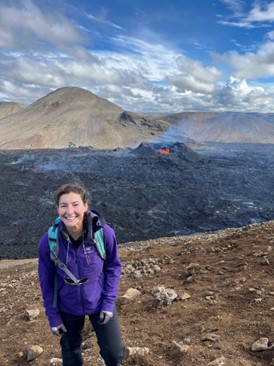
Seeing the Fagradalsfjall eruption in Iceland on my way to Denmark!
I have found that change, risks, and being outside your comfort zone is where the magic happens in life. As Alan Watts said, “The only way to make sense out of change is to plunge into it, move with it, and join the dance.” After leaving my comfortable and steady job as a data analyst this past summer, I dove into a series of changes as I started my journey as a Ph.D. student.
Embarking on my new adventure of starting a Ph.D. program, fortunately, began with an exciting opportunity to travel internationally, help colleagues with their research, and get my first hands-on experience with paleoclimate research. Both my master’s and bachelor’s degrees were in biology, but after learning about paleoclimate several years ago, I decided to change gears (and dive head first) into a new field of research for my Ph.D. Beginning my doctoral experience with hands-on lab work in a country I had never been to was really exciting.
Ice core science is commonly an international effort due to the challenging logistics of retrieving and storing polar ice cores and the variety of skills required to analyze them. The OSU Ice Core & Quaternary Geochemistry Lab has close colleagues at the University of Copenhagen at the Niels Bohr Institute Physics of Ice Climate and Earth. I had the opportunity to help those folks with an extensive gas measurement “campaign” (i.e., an extended period of time collecting measurements) and also learn a lot about the lab techniques I will use in my own research.
The ice used in the campaign was from Northeast Greenland in an area of fast-moving ice called an ice stream. Collecting ice from this region allows researchers to uncover how the ice stream may contribute to sea level rise and reveal past climate. The gas extracted from the ice core is derived from small bubbles locked in the ice, revealing past atmospheric conditions. (For more information on the project, check out the EastGRIP website). During the campaign, we had a team of 5-8 scientists running a continuous analysis of the dust and gas content of the core and also collected meltwater from the ice to examine the water chemistry at a later date.
An ice core melting on a hot plate continuously. Meltwater is collected through a series of tubing and instruments which can then extract the gas, count dust particles, and collect meltwater.
The campaign needed lots of hands on deck to take measurements continuously throughout the day. This approach allows for precise and high-resolution measurements. Ice was prepared and continuously melted on a heated platform. The meltwater then flowed through a series of systems that measured dust and gas and exported the meltwater to be analyzed later. Our time was spent diagnosing issues with a complicated and specialized system, cutting and preparing ice in a -15°C freezer, monitoring the measurements, and collecting discrete meltwater samples.
Serendipitously, while I was there doing ice core science, the University of Copenhagen celebrated the 100th birthday of Willi Daansgard, a Danish pioneer in ice core science. The university held a three-day symposium hosting ice core science talks and celebrating Daansgard’s achievements in ice core science. I was really excited and thankful to learn about the rich history of this field I have just joined.
Aside from the research, Copenhagen taught me the joy of commuting by bike, and I immediately bought a bike first thing when I got back to the U.S. Exploring castles and palaces, and biking around exploring the city was a fun way to spend the evenings. This trip was a great adventure experiencing a new country and learning about the new field I am so excited to now be a part of.
Maria Cristina Alvarez Rodriguez, OEB M.S. Student
Since I was a child, I have been drawn to science. I always imagined myself working in a chemistry laboratory and participating in research; unfortunately, this is a hard dream to have if you come from Panama, where research opportunities are few or non-existent. But I was lucky enough to receive a national scholarship to study sciences related to water resources internationally, and I used it to study ocean sciences at OSU. It was here that I was introduced to the different aspects of oceanography, and I learned that I could get involved in research.
After my undergraduate degree, I was accepted into the College of Ocean, Earth, and Atmospheric Sciences to get my master’s degree under the supervision of Laurie Juranek, a badass chemical oceanographer. As part of the NSF-funded Synoptic Arctic Survey, an international effort to collect data to detect ongoing and future climate change, I embarked on a two-month-long journey that took me to the North Pole!
Figure 1. Synoptic Arctic Survey scientists on the Healy during ice liberty. Photo credit: Deborah Cordone.
My role in this exploration is to study dissolved oxygen concentrations in the Arctic basin. Aboard the ship Healy, we worked from Monday to Sunday for two months straight, collecting a variety of data. During what we called a “long station,” we conducted CTD (Conductivity, Temperature, and Depth) casts and deployed VPR (video plankton recorders), bongo nets, Van Veen grabs, HAPS Cores, and multicores at deeper stations.
When we did full CTD casts, we sampled from 24 bottles, each containing 12 liters of Arctic water, to be shared by multiple teams. The dissolved oxygen team, all from OSU (Laurie, Genevieve Coblentz-Strong and myself), sampled first in order to limit environmental contamination in our water. Laurie trained us to properly sample from the water, always watching out for bubbles — we don’t want bubbles! The first thing we need to do is to take the draw temperature, which is the temperature of the water when we first open the Niskin bottle. This is an important step for density calculations at the time the sample is taken. I rinse the flask and start filling it up with water, watching out for any bubbles, then I hand my co-worker the flask so she can “pickle” the water with chemicals that will “fix” the oxygen concentrations of the sample – keep it the same for later analysis. She gives the flask a good shake to mix all the chemicals. Once we finish, we fill the neck of the flask with deionized water to prevent any oxygen from entering the sample. After 30 minutes and a second shake of the flasks, we are ready to leave them in the dark so they can come up to room temperature.
Figure 2. Left to right: Emily Shimada (STARC), Maria Cristina Alvarez (OSU), Laurie Juranek (OSU), Genevieve Coblentz-Strong (OSU)
After us, the CO2 people always have their turn, then the methane group, then the biologists. In the end, everyone has taken some water to do their analysis. While the CTD team is sampling there is other science happening on the other side of the ship. Plankton nets are deployed to vertically sample from the water column. The biologists deploy the VPR, which is a camera that takes pictures of the microorganisms in the water column. There are pumps to filter water to collect particulate organic carbon in the water column – the pumps need to be under water for four hours!
Lastly comes the benthic (bottom) sampling, which uses different coring instruments to get samples of sediment from the ocean floor along with the organisms in it. At this point, it is already midnight, and the cores will take hours to process, extending to the early morning of the next day, when the O2 team starts doing Winkler titrations to get discrete oxygen concentrations from our samples. With my data, I hope to find patterns of changes occurring in the Arctic Basin, and since this is an area with scarce data, I will also be contributing to creating a baseline study of the transformation of this ecosystem for comparison with future data.
Figure 3. Maria Cristina performing Winkler titrations. Photo credit: Leonard Sussman
At the top of the world, the Healy crew organized what they call “ice liberty” which was the event in which everyone on the ship gets to go walk in the ice at the North Pole. The ice experts made sure the thickness was safe and they determined a perimeter in which we could hang out for two hours in the snow. We all got dressed up in our mustang suits, multiple layers of clothes below the suit, scarves, face coverings, beanies, and gloves. We made a line and walked down to the ice. It was a magical moment that I never thought I would ever experience. A Panamanian from Central America in one of the coldest places on Earth?
During this trip, we got to experience most of the items on the “bucket list for the Arctic.” On our way back, we saw a beautiful young female polar bear! She looked in great condition and the smell of the ship attracted her to the boat. It was incredible to see this magnificent animal, using the snow to clean herself. We also got to see the northern lights three times! One was incredibly intense, the green flashes of light dancing around the sky like a river flowing through the air. On open waters, we saw many bowhead whales and walruses. During these moments of awe and wonder, I felt an immense gratitude towards everything, and everyone involved in this exploration. Every single person in the Healy did their best to make the science happen. We felt joy during our work, made good friends, and learned from each other about what it means to be a human, a scientist, and a student.
Figure 4. Polar bear sighted during the expedition. Photo credit: Leonard Sussman
Photo credits: All pictures were taken during NSF-funded Synaptic Arctic Survey (SAS), Healy 2202 Research Cruise.
“Go build partnerships.” This is the assignment that I received from my advisor when our collaborators invited us to tour our study area and present a joint session at the WaterNet 2022 Conference in South Africa.
My journey started with the 1:50 AM Groome shuttle to PDX on October 4. Too many hours later, after risking health on flights that no longer require passengers to wear masks, I arrived in Johannesburg, South Africa at about 6:30 PM local time on October 5. I was greeted at the airport by a young man holding a sign with my name on it, and we discussed foods, languages and jobs on the short drive to my hotel in Pretoria. The hotel lobby was crowded by a Mozambican youth gymnastics team who had a competition nearby. I checked in with ease and then, too tired to eat, showered and headed to bed with the lullaby of cars honking melodically to the beat of the music blasting at the corner market.
Sunrise in Pretoria
My first day in the country, I walked to our partners’ offices and was delighted to find that Global Water Partnership and International Union for the Conservation of Nature, the two organizations I work with on a transboundary rivers project, have offices side-by-side in the same building. They hosted a delicious lunch catered by a local restaurant, as a way of welcoming their partners (colleagues also joined from IUCN Headquarters in Switzerland). As soon as we sat down to eat, the ideas started rolling out:
“You must not let my colleague forget to tell you about our idea to send students from the basin to study at OSU.”
“Can we publish a book on the basin?”
“You must come back again and bring Aaron.”
So, on Day 1 I learned the hospitality of my hosts, the importance of meeting in-person to informally discuss project ideas, and the cultural significance of eating in someone’s home (or office) before discussing business.
All smiles after a productive kick-off meeting. Photo credit: Leticia Ngorima, GWPSA.
The next day, seven of us flew from Johannesburg to Harare, and then drove in two rental cars to Mutare, the third largest city in Zimbabwe, a few kilometers from the border with Mozambique. Here we had two packed days of touring the transboundary basins through the eyes of the Catchment Managers and Hydrologic Engineers that work for the Zimbabwe National Water Authority. There are three river basins we focus on: the Buzi, Pungwe and Save Basins, known together as the BuPuSa Basin.
Map from USAID showing transboundary river basins in the area; the BuPuSa basin is the most northeast.
Perhaps I should take a moment to recognize that I am a geographer with a captive audience. Check out this map! River basins are outlined in dark blue. Notice how they pay no mind to the very straight dashed black lines that denote country borders? European colonizers generally did not consider ecosystems when drawing country borders. The work of transboundary water cooperation is to bring together countries that share water resources to share the burdens and benefits of water management. The BuPuSa Basin spans Mozambique and Zimbabwe. The project with GWP and IUCN centers around strengthening capacity of the two countries to establish protocols for sharing data, water, and more.
Save River at Birchenough Bridge, Zimbabwe.
From Mutare we drove south to the Save River, where we observed low flows (it was the end of the dry season) and sedimentation. It’s hard to imagine the flooding event described by engineers which washed away eight bridges in the basin. Much of the basin tour focused on visiting places where the floodwaters washed away monitoring equipment, bridges, and even houses and humans.
Copa Village, Zimbabwe, 2022
Two key observations of the river. The obvious one was the heavy siltation and turbidity, caused by illegal gold panning upstream. The second observation was not so obvious to me. This part of the river looks like many in Oregon – a river channel dotted by boulders. However, in Oregon, the boulders were washed down by the Missoula Floods. In Zimbabwe, such a site is unusual. The boulders were washed down river by floods in the wake of Cyclone Idai. With the floodwaters, houses and hundreds of people were washed away as far as into Mozambique.
Project partners in the basin are improving monitoring and developing early warning systems for such flooding. Now, water level dataloggers send an automatic alert to an engineer’s phone when certain flow thresholds are reached, and the engineer then alerts a WhatsApp group that includes engineers on the Mozambican side to warn of flash flooding potential. These dataloggers are located at multiple sites, so the engineers can measure how fast the floodwaters are moving. Improvements may include a more reliable battery/power system for the dataloggers, raising awareness about flood risk and preparedness, and installing flag systems to communicate river level and flood warnings.
The next day we traveled north to the source of the Pungwe, where, we were told, the water is clean enough to drink. My observation of the surrounding monocultures of banana, avocado and macadamia left me skeptical of this statement, but I did reach down and touch the water, and could certainly imagine cooling off in the river on a hot day.
Team discussion on the bank of the Pungwe River.
Banana plantation near the Pungwe River.
Fun fact: past hydrologists used this zipline to measure the flow of the river, carrying heavy equipment and dangling it down into the river – pretty risky! Also, this is about as close as I got to Mozambique (it’s just across the river) during the trip.
After a week of tours and meetings in Zimbabwe, we returned to South Africa for our engagement at the WaterNet Conference. The conference presents research and projects from across the Southern African Development Community, drawing together policymakers, academics and practitioners. Our session reflected on the use of data in transboundary water negotiations. Highlights of our session included engaging keynote addresses from Dominic Mazvimavi, Professor Emeritus at the University of the Western Cape and Professor Melissa McCracken from Tufts University, an insightful panel discussion, a presentation of the Transboundary Freshwater Diplomacy Database by CEOAS Ph.D. candidate Alexandra Caplan, and stories of data challenges in the BuPuSa Basin from Mr. Elisha Madamombe, Regional Coordinator for the BuPuSa Project at GWPSA. You can learn more about this topic in a blog about our online training with GWP, which we held the morning after my return to the US.
Co-facilitating our joint session with GWP and IUCN at WaterNet 2022.
There were many more aspects of the trip I would love to share. The observation that informal environments often are the best for productive discussions. How well my partners took care of me in the region – Pinnie guiding me through a questionable border crossing, Tariro stopping every 20 minutes for me to vomit on a long drive when I had food poisoning, Cebo making all of my transitions between hotels and airports as easy as possible. Ask me anything. I’ll leave you with these photos of South African wildlife and signage about water:
Is South Africa running out of water? If you’re confused by this question, just Google “Cape Town Day Zero” to learn a little. I will say, all of the hotels I stayed in Johannesburg area had signs like this one about reducing water consumption. However, none of the places I stayed in Cape Town had such signs. While one Uber driver told me there is definitely a water crisis and that a project is being considered to pipe water from Zimbabwe to South Africa, another driver casually assured me, “There is no water shortage here.”
Maria Jose Iglesias-Thome, M.S. Student, Water Resources Science
My passion for water started at a very young age. When I look back at my childhood, the things that interested me growing up, and where I stand today, I can’t help but think that this trajectory makes sense. When my thesis advisors gave me the chance to propose a research project, I jumped at the opportunity to study groundwater in my hometown.
I grew up in Puerto Morelos, Mexico, a small coastal town situated a few yards from the Caribbean ocean, nestled between vine-covered sand dunes and dense marshy mangrove forests and sitting on top of an ancient underground network of “rivers”. For locals, the idea that underneath lies a hyper-connected and inherently sensitive groundwater system, is part of the traditional knowledge passed on through generations. As the region continues to grow and develop, the abstract ideas of how the local aquifer flows, are replaced with an erroneous notion that clean water will always be accessible and will never cease to exist.
The place: Complexity hidden beneath our feet
Figure 1. Map of Quintana Roo. Tony Burton (2010)
The whole Yucatan peninsula sits on a flat limestone platform, built on top of millenia of fossilized calcified skeletons from creatures past. The carbonate rock that was left behind is highly soluble and vulnerable to rainwater dissolution. Throughout the years, heavy rainfall, common in this tropical environment, has carved a series of conduits, revealing a contiguous coastal aquifer and a landscape virtually devoid of rivers and non-groundwater dependent surface water systems. This process is known as karstification and the topography it leaves behind is known as karst. Scattered across the Yucatan peninsula are larger dissolution conduits: caves and sinkholes that have collapsed to form what are locally referred to as cenotes, derived from the Mayan ts’onot, that give us a direct look into the aquifer. Other important hydrogeologic features include major faults systems and regional-scale flow patterns from the center towards the marginal ends of the Peninsula, the coast. Inside these coastal karst aquifers, a thin freshwater lens (5-7 meters deep) lays atop an intruding saltwater layer, known as the “cuña salada”, penetrating 10-15 meters into the subsurface. This shallow layer provides most of the water for an increasingly growing population across the entire peninsula.
The problem: Chaotic population sprawl
The complexity of this groundwater system results in an inherently vulnerable resource, especially to anthropogenic sources of disturbance. Likewise, it is unclear how patterns of water use may be depleting groundwater quantity and/or degrading groundwater quality and how these changes are affecting water availability to local communities and ecosystems in the region. Extreme urbanization and population growth may be a large driver of water insecurity and scarcity. In 2017, the state of Quintana Roo hosted over 17 million tourists and sustained an average hotel occupancy of around 83%. The number of tourists visiting Quintana Roo has more than doubled in the last 10 years, with a 120% increase in yearly tourists between 2009 and 2019. Similarly, the population in the area has grown around 40% over the past 10 years. Spatially, development in the region follows an overall gradient from north to south, while the population is currently concentrated in northern communities, southern communities are experiencing higher rates of population growth. In other words, development is quickly spreading south.
As urbanization continues to sprawl across the coastline, concerns about saltwater intrusion, deep-aquifer contamination through wastewater injection, and shallow-aquifer contamination through septic tank leaks and fertilizer application continue to grow.
Understanding the relationships between social and ecological systems through their shared reliance on groundwater resources is important for evaluating water security and subsequent water scarcity issues. It may also prove critical in examining how coastal communities that rely on water for their livelihoods may be disproportionately affected by ongoing changes in water resources in the region.
Figure 2. Situation map for a hypothetical aquifer in Quintana Roo, showcasing transformations (yellow diamonds), flows (arrows) and storages (white boxes).
The methods: Mixed methodology and an evolving plan
Mixed research methods are useful tools in studying complex social-ecological system problems, like those in Quintana Roo. Qualitative interviews are a central component of my research methodology. This summer I had the privilege of conducting semi-structured interviews with large and small water users, water managers and water protectors. Interviewees included hotel representatives, domestic users, NGO and civil society leaders, and local government officials. My interviews covered a variety of topics and were rooted in concepts related to water scarcity, resilience theory and social-ecological systems frameworks. The data collected with these interviews will allow me to understand important exposure to water scarcity and other hazards, social vulnerabilities and sensitivities that affect how individuals and groups respond to water stress and aid in evaluating adaptive capacity from varying degrees of scale. Synthesizing important hydrogeological knowledge as well as the data collected through interviews, will allow for a holistic approach to understanding and measuring water scarcity through an integrated assessment model-framework (IAMF). The model aims to integrate biophysical aspects of water scarcity, such as seasonality, water source, quantity and quality, with socioeconomic aspects of water scarcity, such as accessibility, reliability and social vulnerability. It also hopes to include nuances that are often overlooked in water security models and water scarcity assessments.
It is fascinating to research a place and a problem that are so dynamic and often evolving. One of the reasons why I am so deeply interested in natural resource management and specifically water resource science is because I grew up seeing the landscape around me change. I feel infinitely privileged to be working in a place I love and know, and hope to continue to contribute to what is known about it.
Flashback to my childhood: I am maybe 8 years old, wearing some worn out hand-me-down clothes from my brothers. I put on my trusty light blue crocs and callout to my mom, “I’m going to go play in the woods!” Stumbling through the leaf litter and sticks and fallen trees, the cold, wet, yuckiness of a Michigan fall does not phase me. I climb up the hill to my favorite spot. The sun decides to come out and light up my small patch. The birds are excited about the sun, too, so I sit and watch them play. I get distracted by a worm wriggling into the ground and giggle in awe of all the life around me. I am in my own slice of paradise.
I have always found myself connected to the outdoors. Whether swimming in the nearest body of water, going for a hike in the woods, or catching a bluegill in the creek, nature is where I am happiest.
Now, I am 22 years old, and for the past year I have been playing in a river –I mean, working on data collection for my master’s thesis.
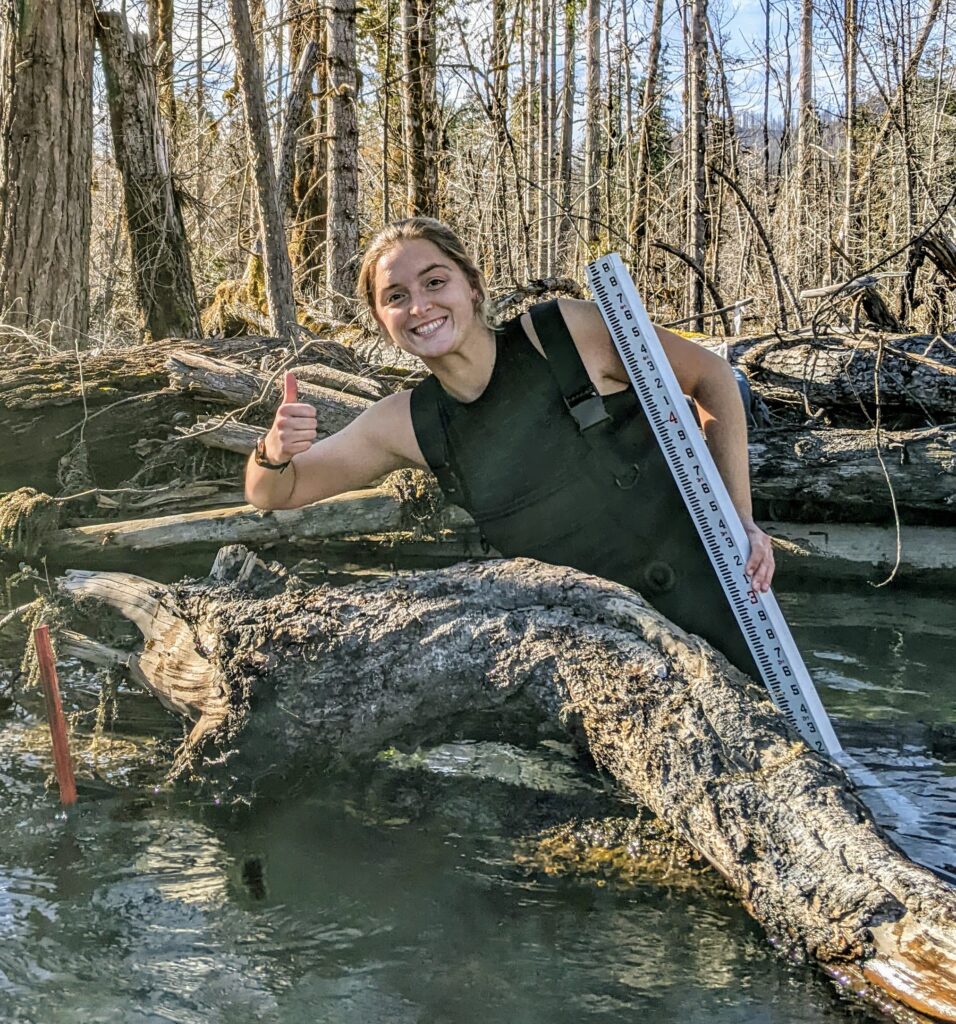
My research site is east of Eugene, OR and sits below Cougar Dam. I am looking at a new approach to river restoration and trying to understand how different habitat qualities might impact the spawning and rearing of Chinook salmon. Before treatment, the river was not connected to its floodplain, the nursery habitat for juvenile Chinook. Treatment reconnected the river once again to its floodplain. The model I am using requires me to understand how fast the water moves and how deep it is before and after treatment. A team of five undergraduates and I collected that data, monitoring an untreated section of river upstream of the treatment area and regions in the treated area.
I have traded in my crocs and hand-me-downs for wading boots and thick neoprene waders. The waders were helpful when bushwhacking through stinging nettle, blackberries, salmonberries and virtually everything pokey in the world. If it is pokey, I found it, I probably grabbed it, and I most definitely learned my lesson.
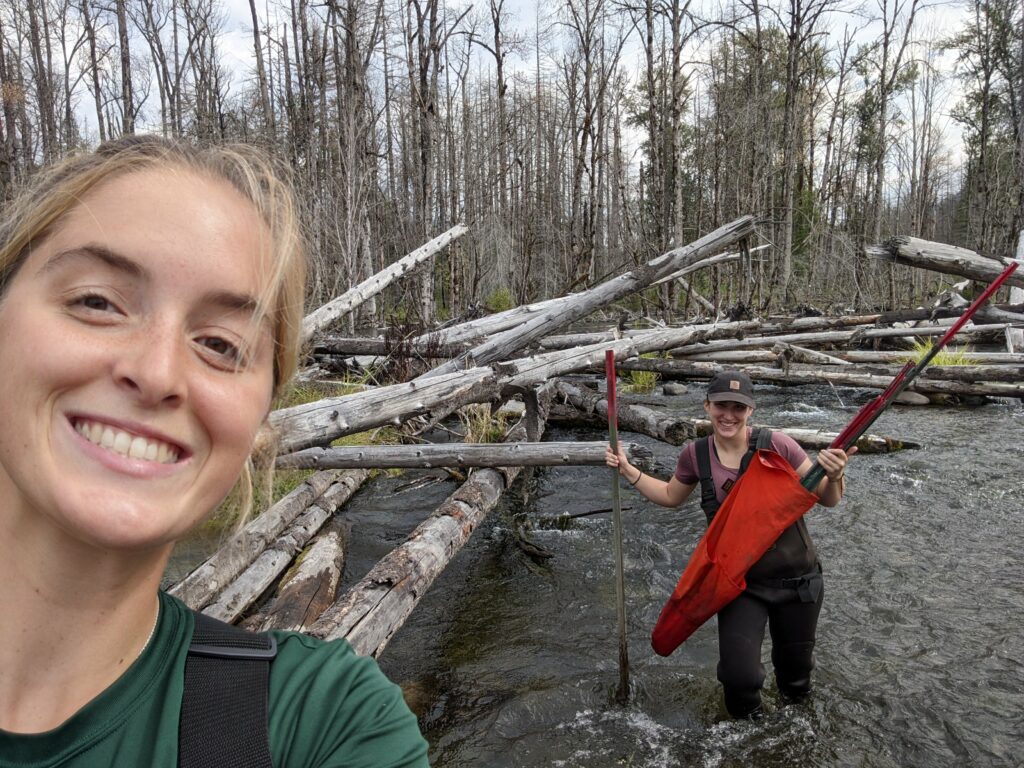
My fieldwork involved walking on large wood placed throughout the river. When I began the work, I was slow and cautious, but by the end of the summer, I had to remind myself to slow down so my undergraduate helpers could keep up.
The weather and field conditions were not always the most pleasant to work in. I don’t recommend trying to get through stinging nettle taller than yourself –their radiating sting is unpleasant. Sticking my arms and face in the chilly water to retrieve sensors and replace them, doing my best, unsuccessfully, to keep the water from pouring into my waders, is, again, not recommended.
But during all the unpleasantness, I was truly living my best life. Some of the most uncomfortable parts of life can be the most enjoyable; it is all about perspective. I would rather have a bad day in the field and breathe in the fresh (well, sometimes smoky) air, see the life booming around me, and connect with nature, than have a mediocre day in the office. My favorite memories are of the times when we simply stopped and let the view in. The treated area was always busy with birds, butterflies, and fish. I would pull a rock out of the river and show my students the different macroinvertebrates crawling around. The ability to find life in all corners and crevices of the site excited my inner child.
Being at my study site reminded me of those days in the woods as a kid. It was MY place, my little slice of paradise. It also showed me that I didn’t have to do research to go out to the woods and frolic. So even though my field season has ended for my master’s project, you will always be able to find me revitalizing my soul out in the woods somewhere.
Working in the ice core freezer during a trip to the University of Copenhagen in March 2022
One morning in August 2017 I woke up feeling sick. I was looking forward to the last week of my first-ever research internship in the Boston University Antarctic Research Group, where I was first introduced to paleoclimatology and was anticipating an opportunity for Antarctic fieldwork in a year or two. I was supposed to join a friend in Connecticut that weekend, but I thought I had food poisoning, so I canceled my plans and spent the weekend eating crackers in bed instead.
That “stomach bug” turned into five days of discomfort. Student Health and my doctor back home gave me some quick fixes—reduced stress and caffeine, antibiotics for a potential infection—but nothing helped. The weeks stretched into months and I completed the fall semester sick and miserable.
Holding a jar of Antarctic ash in the Boston University Antarctic research lab in September 2017, about a month after getting sick.
I wouldn’t receive a diagnosis until February: I had gastroparesis, or partial paralysis of the stomach muscles causing severe nausea. I began treating it with medication, which would eventually bring my symptoms down to a manageable level.
Because I got sick at the beginning of my career in geoscience, no part of my research experience can be separated from my chronic illness. I remember very little of my early Earth science classes; I was distracted by hunger when I couldn’t eat and nausea when I could, as well as headaches, dizziness, brain fog, shortness of breath, and fatigue. While my friends in the program were talking about exciting fieldwork opportunities and fun nearby hikes, I was so malnourished my hair was falling out.
My hopes of going to Antarctica—or of participating in any fieldwork at all—were dashed. Before I got sick I had been going to the gym five days a week to better my chances of being picked for the field team; now I could barely walk to class.
I had to turn down an offer to work in another lab at BU because I was still too ill to stand at a lab bench. Later, the medications I took to treat my stomach made me severely anemic, making data analysis a slow and frustrating slog.
While my health has improved dramatically over the past five years, I still deal with symptoms of my illness every day. I might be going about a normal week, eating well and even feeling good enough to hit the gym a few times, then suddenly be unable to leave the house due to nausea and painful stomach cramps. These episodes might last hours, days, or even weeks. I have to eat on a regular schedule and avoid certain foods to minimize my chances of a flare-up. All these things can make classes, lab work, and especially fieldwork challenging.
I was lucky to have the opportunity to complete an undergraduate thesis on biogeochemical cycling in marshes with samples that had already been collected. The lab work and data analysis were within my abilities at the time, so I was able to complete the project without major issue.
Sage Lot marsh, Cape Cod, MA in summer 2019. This marsh was the subject of my senior thesis project. The resulting paper, “Mechanisms and magnitude of dissolved silica release from a New England salt marsh,” has been published in Biogeochemistry.
My PhD project here in CEOAS also works with existing samples—one of the benefits of ice core science. Polar fieldwork may have a high barrier to access, but we have a long and varied archive of well-studied cores from both poles.
Although I still dream of doing fieldwork in Greenland or Antarctica, I have had the opportunity for lots of fun scientific experiences as part of my Ph.D. This spring I got to travel to Denmark to collect ice samples from the archive at the University of Copenhagen. Later in the spring, I helped an undergrad in our lab drill cave ice samples from Lava Beds National Monument.
Helping undergraduate Sebastian Miller (left) and professor Ed Brook (center) drill a cave ice sample at Lava Beds National Monument in May 2022.
This summer, I spent five weeks at the Scripps Institution of Oceanography in La Jolla learning some lab techniques for my project. This fall I attended the International Partnerships in Ice Core Science (IPICS) meeting in Crans Montana, Switzerland, with several members of my lab. While fun and educational, all these trips have presented their own challenges for my health.
The view from our rental house for the IPICS conference in Crans Montana, Switzerland, October 2022.
I’m used to living with my illness. I try not to let it get me down, and in general it doesn’t. I love the work I get to do in the ice core lab and my health rarely gets in the way these days. However, positive thinking can’t get you out of chronic illness. I can’t ignore the realities of my health out of a desire to do the same things as my colleagues.
Someone who has always been healthy and able to rely on their body to complete the tasks they ask of it can have a difficult time understanding the unpredictable rollercoaster of chronic illness. If you can hike three miles carrying field equipment one week, you can probably rely on being able to do it again the next week. A chronically ill person may find that hike easy one week and completely impossible the next due to changes in their health and energy. Both weeks may even look the same to an outside observer.
The next time you plan field work, a conference, or a lab celebration, consider that there may be members of your lab with invisible hurdles to participating in the same activities as you. Creating an environment where students and colleagues feel comfortable voicing their needs without judgment can go a long way. Reading up on things like spoon theory, which chronically ill people (or “spoonies”) use to describe their available energy, can also offer some insight.
As we all strive to improve equity and access in geoscience, it’s impossible to anticipate every possible need that will arise. What we all can do is interrogate our picture of what a geoscientist is and does and make room in the field for people with a wider array of experiences and abilities.
by M. Kelsey Lane, Ph.D. student in Ocean, Earth and Atmospheric Sciences
Our eight-person team woke early to the clear blue skies of Catalina Island off the coast of Los Angeles, California. The beautiful island is a popular vacation destination, but we had other priorities as we jumped into another busy day of fieldwork. Someone hustled down to the laboratory before 7:00 AM to turn on the UV lights that mimicked the sun, suspended over the rows and rows of jars holding microscopic plankton called foraminifera, or forams, that we were growing. Three of us headed to the dock to take a boat offshore and tow the depths for more plankton. Everyone worked in the lab taking care of the forams in their tiny seawater jars. The tasks would keep us busy into the evening as we worked to farm forams for our climate research.
Figure 1. Dr. Jennifer Fehrenbacher (OSU) observing a foraminifera in culture. Behind are jars and jars of other forams. Each foram gets its’ own jar.
Forams are storytellers of a forgotten time. Their shells record the conditions that they live in, making them “proxies” or analogs for measuring climate change. Foram shell chemistry changes with changing temperatures, salinities, ocean pH, and many other parameters, including some we’re still exploring. The forams we study live as plankton drifting in the open ocean and grow shells out of calcium carbonate. They have intricate, beautiful chambered shells, many with spines to help catch food. When forams die, their dense shells sink to the sea floor and are often preserved as fossils, providing scientists with a unique opportunity to investigate the past by studying the foram fossil record going back millions of years. So, we can look at a 50-million-year-old foram fossil and say something about the ocean conditions at the time and place it grew.
Figure 2. Upper image – Foraminifera living in culture. The long spines surrounding the foram are covered in glowing dots that are symbiotic algae. Lower image – Foraminifera feeding on a brine shrimp. Note the difference in size between the foram and the shrimp.
The best way to establish these relationships is to grow foraminifera in controlled conditions and see how it changes their shell geochemistry. It’s a lot of effort to grow these small organisms, each about the size of a grain of sand and kept in their own individual jar, but they’re well worth the effort. Our multi-institution team came to the University of Southern California Wrigley Marine Science Center to help develop and improve climate proxies from modern foraminifera. It took a big team to capture, process and keep the hundreds of forams alive. The group from Columbia University and Vassar College explored how ocean acidification and warming temperatures are recorded in foraminifera shells. Our team from Oregon State University looked at how forams might incorporate trace metals to tell us more about ocean productivity, and I explored how the microbes living inside forams might be altering their shell geochemistry.
Figure 3. The field season team, including from left to right in the upper image: Laura Haynes (Vassar College) Bärbel Honisch (Columbia University), Jennifer and Kate Fehrenbacher (OSU), Ingrid Izaguirre and Yoon Kim (Columbia University), Elise Poniatowski (Vassar College) and Kelsey Lane (OSU). Not pictured: Madelyn Woods (University of Maine).
It felt strange to be so invested in the life cycle of a tiny, single-celled organism. We spent hours feeding each foram tiny brine shrimp, food that was often larger than the foram itself, and we all cheered when the hungry foram fed. We carefully watched as they grew chambers and spines, writing it all down in detailed logs. Some forams would die in culture or get pale and unhappy. If things we went well, the foram would reach its full size after a couple of weeks, then start to die and go ‘gam’ or gametogenic, the final stage of its life cycle. Although it was sad to watch them die, it was also exciting, because that was one more successful foram that had grown in our laboratory. We delicately extricated the foram and put the shell in a tiny slide, a precious data point that might help us understand more about the ocean’s past.
Figure 4. View of USC Wrigley Marine Science Center.
The month-long field season went quickly. Around the long hours in the lab or out on the water, we built a great community. We ended each workday swimming off the dock, exploring the island, kayaking nearby bays, or watching The New Girl and working through a massive puzzle (we got through about one a week!) Farming forams can be a busy job, but we had fun, too. Now we will spend the next few months at our home institutions processing all that data…
Follow more of Kelsey’s science on Twitter at @mkelsea and on the Foraminarium website
by Laura Vary, Master’s student, Marine Resource Management
Take a moment to consider the factors that allow you to read this article as an adult today. You (hopefully) have sufficient food and water to power your cells, which work tirelessly to flood your brain with enough glucose to retain an understanding of sentences. You have enough time and attention to focus on these words. In one way or another, you obtained a device with which to view this article, and viable internet connection to load materials. To be in the position of reading this article, many moments had to happen in precisely the right way.
Now, imagine you’re a tiny larval fish, smaller than ball bearing, in the middle of an ocean thousands of miles wide. The fate of your population rests on your poorly developed spine and you are experiencing your environment for the very first time. You lack developed eyes but can recognize light, you can swim (barely), but have no chance of fighting against the strong currents that push you across space. Yet, somehow, you must find food and a comfortable area where you can grow. Somewhere warm enough, as your growth will stop if the water is too cold. Somewhere calm enough, where you can have a chance of not only finding prey but capturing it.
The number of factors that must go right in order for these nearly microscopic creatures to mature into adults is almost incomprehensible. They do, though, and mature adults support a sector of the United States’ economy worth nearly $5.5 billion1.
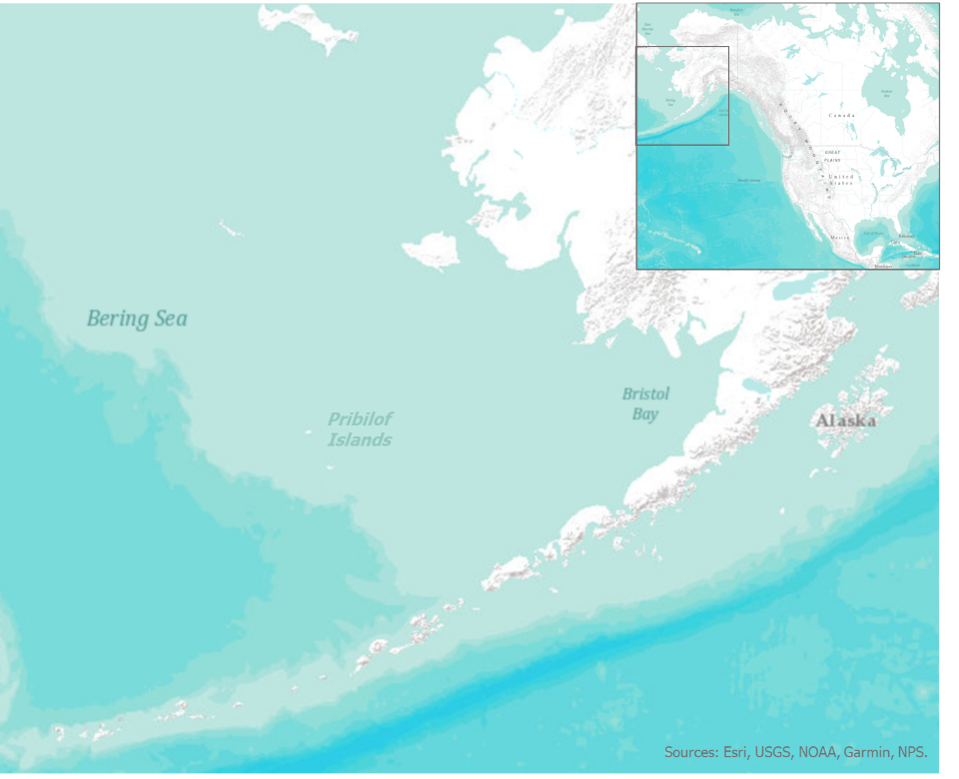
In the United States, fisheries are extremely important to coastal communities’ cultures and our national economy. If you’ve eaten U.S. seafood recently, chances are that it came from Alaskan waters: 60% of all U.S. fish landings occur in Alaska, primarily in the Bering Sea1. Over $500 million is contributed to the U.S. economy from Alaska alone, and 1.2 million jobs stem from Alaska fisheries2.
The Bering Sea, a region of exceptional fishery productivity off Alaska’s west coast. The Bering Sea supports many fisheries worth millions of dollars. Notably, the Bering Sea is home to walleye pollock, a groundfish worth $420 million in 2020.
Alaska fisheries are booming, but the environment is changing rapidly. The Bering Sea is experiencing a swift onset of climate change with notable decreases to the sea ice that is vital for a functioning ecosystem3. It is very possible that those little larvae we imagined earlier will have a harder time finding adequate areas to grow up, areas with proper food and comfortable thermal conditions. If larvae are unable to find these preferred areas, the population that supports valuable fisheries is likely to drop in numbers4. Poor larval survival has been observed to cause fishery closures and population declines globally, which cost coastal communities and the U.S. economy millions of dollars5. To improve the health of larvae and secure the health of our fisheries upon which the national economy depends, we must continue supporting fishery sustainability into the future.
Media coverage of the oceans frequently adopts a “doom and gloom” lens, with typical news articles focusing on rapid glacial melt, population crashes, hurricanes, plastic pollution, and a myriad of other threats facing our oceans and coastal communities6,7. While these articles are addressing very real problems, successes in the marine world are often glossed over. Fishery sustainability, for example, is an area in which the U.S. and specifically Alaska have performed quite well.
Historically, fisheries management has been narrow in scope, establishing policies for the uses and protection of single species or even age groups within a species. Fisheries managers tended to imagine the ecosystem as a set of isolated ecological islands rather than dynamic and interwoven facets of the same community8. Alaska, alternatively, has maintained sustainable fisheries through a different approach: ecosystem-based management, or ecosystem-based fisheries management (EBM/EBFM). EBFM acknowledges the interconnected nature of ecosystems and elucidates connections among ecosystem components to promote long-term sustainability of natural resources. EBFM is a management framework in which all components of a healthy ecosystem, including humans and the use of natural resources by humans, are considered8–10. Simply put, EBFM is a way of managing human interactions with natural resources that emphasizes connections within the ecosystem and society and is adaptive across time and space9. In places where it has been implemented, like in Alaska, long-term sustainability of fisheries has been observed which is a testament to the importance of holistic management11,12.
EBFM can be thought of as treating the source of an illness rather than its symptoms. A patient complaining of chronic nausea, for example, will likely have a better health outcome if a doctor considers their diet, environment, stress levels, and exercise routine rather than simply prescribing anti-nausea medications. In Alaska, fisheries have been managed following this holistic EBFM framework for decades11,12. Researchers and managers work tirelessly to understand the internal connections among organisms, the drivers of change, and the most important threats, much like a doctor trained in comprehensive medicine. Nationally, the U.S. has made strides in implementing EBM principles in fisheries management and scientists recommend the integration of EBM principles to other marine industries, like the development of renewable energy10,13. Now, perhaps you’re wondering why we should still be concerned about the fate of those larvae, and ultimately our fisheries, if EBFM is making such improvements nationwide. This question harkens back to a key concept of EBFM: it is adaptive and iterative in nature, requiring updates and modifications as the environment and human society change over time9. Further, status evaluations across vulnerable life stages of important fisheries (e.g., larvae) are required to improve EBFM implementation5.
A collection of larval fishes, captured by the Alaska Fisheries Science Center ecosystems and fisheries coordinated investigations team. Credit: NOAA Fisheries, Alaska Fisheries Science Center, 12/30/2021.
To better inform EBFM, it is extremely important to understand what may happen to fish larvae if the Bering Sea warms dramatically or experiences more storms, or demands on fisheries increase to support a growing human population. I spend a lot of my time thinking about larval fishes in the pursuit of a better understanding of the factors that drive survival and successful maturation into juvenile fishes and eventual adults. Specifically, I investigate how the reproductive behavior of larval fishes in the Bering Sea may change in the future, and how anticipated changes could impact the survival of larvae. Through my research, I found that walleye pollock exhibit flexibility in where they spawn. This suggests that in warm years, aggregations of walleye pollock spawning adults may occur in regions different from historic population tendencies (note: these results are unpublished and thus have not been peer-reviewed yet).
To promote adaptive management, many possible ecosystem states, relating to differing climate states, should be considered10. In the case of pollock, managers need to know that spawning aggregations may shift geographically in warm conditions for many reasons. Pollock eggs (roe) are harvested and so the lucrative roe fishery may need to move locations in the future. A movement of spawning adults could cause larvae to hatch in unfavorable areas, increasing larval mortality and leading to closures of the adult fisheries. Adult pollock could also move outside of U.S. fishing jurisdictions as the region warms, potentially warranting new international fishing agreements or modifications to established fishing areas14. My research therefore supports EBFM approaches by elucidating drivers of change which managers can then integrate within adaptive management strategies. At the end of the day, a failure to acknowledge different survival rates and environmental pressures across life stages in fisheries management could seriously impact the U.S. economy.
Any U.S. community member is connected to the marine environment through the impact that fisheries and marine industries have on our economy. This economic connection between societies and their ecosystems is a fundamental driver of EBM, and underscores why even individuals living in landlocked states hundreds of miles from a large water body rely on a functioning marine ecosystem. The need for EBM, though, extends beyond fisheries management. Currently, global powers are developing “blue economy” initiatives which seek to improve the financial gains nations can receive from marine and coastal activities15. The blue economy includes any industry that occurs in marine or coastal areas, including power generation, fishing, tourism, and shipping16. The EBM framework should be integrated at every level of blue economy initiatives to prevent follies we’ve experienced in the past (e.g., overfishing, uncontrollable oil spills, plastic pollution, etc.)15. The EBM framework can also promote the development of even more jobs, as collaboration and a diverse team structure are central components of the EBM approach15. Recently, the National Oceanic and Atmospheric Administration released a Blue Economy Strategic Plan that works to enhance emergent marine industries and protect their sustainability into the future16.
Yesterday, you may not have ever thought of larval fishes. After reading this article, I hope you understand the importance of their survival to the success of the U.S. economy. Millions of livelihoods and hundreds of coastal communities directly rely upon the commercial harvest of fisheries, but all U.S. citizens indirectly benefit from these marine ventures. At the heart of this industry are the tiny, frequently forgotten young fishes that must fight battles worthy of a Homeric epic: They avoid relatively monstrous predators and capture microscopic prey, all while being swept along by powerful currents. The sustainability of marine fisheries in the U.S. hinges on the implementation of EBFM in management and EBM in emergent blue economy ventures. More specifically, though, it hinges on the ability of scientists and managers to elucidate the drivers of mortality in the most vulnerable life stages of these organisms.
References
1. Cody, R. Fisheries of the United States, 2019. 167 (2021).
2. Fisheries, N. The Economic Importance of Seafood | NOAA Fisheries. NOAA https://www.fisheries.noaa.gov/feature-story/economic-importance-seafood (2020).
3. Stabeno, P. J. & Bell, S. W. Extreme Conditions in the Bering Sea (2017–2018): Record-Breaking Low Sea-Ice Extent. Geophysical Research Letters46, 8952–8959 (2019).
4. Hjort, J. Fluctuations in the great fisheries of northern Europe, viewed in the light of biological research. (1914).
5. Laurel, B. J. et al. Regional warming exacerbates match/mismatch vulnerability for cod larvae in Alaska. Progress in Oceanography193, 102555 (2021).
8. Lester, S. E. et al. Science in support of ecosystem-based management for the US West Coast and beyond. Biological Conservation143, 576–587 (2010).
9. McLeod, K. & Leslie, H. Why Ecosystem-Based Management? in Ecosystem-Based Management for the Oceans 10 (Island Press, 2009).
10. Leslie, H. M. & McLeod, K. L. Confronting the challenges of implementing marine ecosystem-based management. Frontiers in Ecology and the Environment5, 540–548 (2007).
11. Holsman, K. K. et al. Ecosystem-based fisheries management forestalls climate-driven collapse. Nature Communications11, 4579 (2020).
12. Fisheries, N. Ecosystem-Based Fisheries Management Strengthens Resilience to Climate Change | NOAA Fisheries. NOAA https://www.fisheries.noaa.gov/feature-story/ecosystem-based-fisheries-management-strengthens-resilience-climate-change (2020).
13. Copping, A. E. et al. Enabling Renewable Energy While Protecting Wildlife: An Ecological Risk-Based Approach to Wind Energy Development Using Ecosystem-Based Management Values. Sustainability12, 9352 (2020).
14. Baker, M. R. Contrast of warm and cold phases in the Bering Sea to understand spatial distributions of Arctic and sub-Arctic gadids. Polar Biol44, 1083–1105 (2021).
15. Wenhai, L. et al. Successful Blue Economy Examples With an Emphasis on International Perspectives. Frontiers in Marine Science6, (2019).
16. NOAA Finalizes Strategy to Enhance Growth of American Blue Economy. U.S. Department of Commerce https://www.commerce.gov/news/blog/2021/01/noaa-finalizes-strategy-enhance-growth-american-blue-economy (2021).