Geospatial Science from a Military Perspective

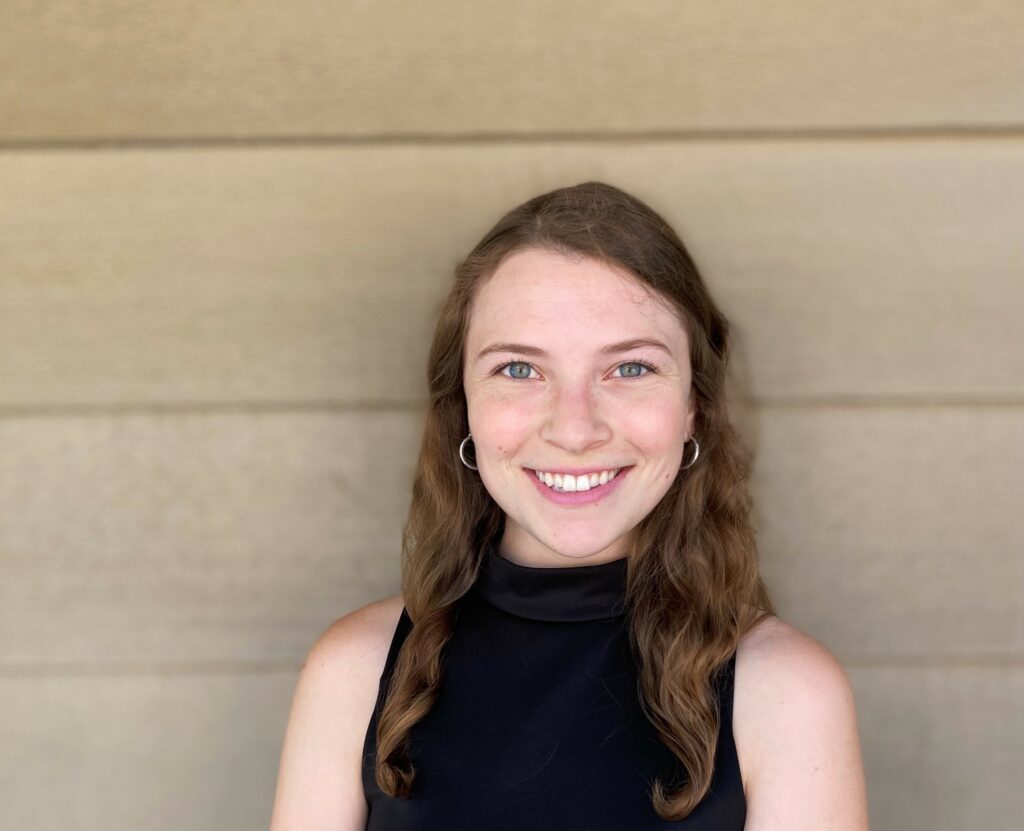
Gabrielle LaRochelle, 2Lt, USAF | MS Student in Geography

Walking off the runway post helicopter incentive ride

Military Geography Origins

Remote sensing has its roots in military history, beginning with photos taken from hot air balloons and cameras strapped to pigeons as a means of reconnaissance during World War I. It wasn’t until 20 years after World War II that remote sensing technology was adapted to the commercial and academic applications we are familiar with today. 

As seen in the news on current conflicts around the world, the use of aerial and satellite imagery is still indispensable for monitoring unfolding events from afar. And the technology and techniques have gotten a whole lot better. 

The importance of remote sensing in data collection today is exemplified by the National Geospatial-Intelligence Agency (NGA). The NGA uses state-of-the-art technology and methods to deliver geospatial intelligence that provides a decisive advantage to policymakers, military service members, intelligence professionals, and first responders at home and abroad.  

I only visited the NGA once for a military-academic conference, so I can’t say too much about it other than that the cafeteria is pretty good. 

Disembarking from the UH-1N Huey incentive ride.

My Experiences So Far

However, I would like to share my experience at Los Alamos National Laboratory, where we studied the use of LiDAR as a new method for monitoring potential nuclear weapons testing. Through this story I hope to provide insight into one of the many applications of geography for national defense and highlight some of the differences I noticed on my journey between the military and civilian worlds. 

Discovering Geography

My GIS Mentor and I in the JSC Mission Control Viewing Room

I first discovered geography during an internship at NASA’s Johnson Space Center in Houston, Texas. I worked under the supervision of a retired Navy sailor who taught me about geographic information systems (GIS). She set me to work creating an interactive map for recovery from disasters, which in Houston typically means hurricanes. I gathered information on elevation, flooding, NASA employee zip codes, buildings in need of priority backup power, evacuation routes, etc. — all while working two floors above Mission Control! It was an intimidating project for my first foray into the world of geography, but it became incredibly gratifying when Hurricane Harvey later hit my hometown. The Federal Emergency Management Agency (FEMA), NASA, and other government agencies used my map to support operations during and after the storm. Having seen how beneficial the project was, I sought out the best undergraduate education in geospatial science and found myself at the United States Air Force Academy. 

Military Geography

In the military, I gained access to information and opportunities not available to the academic or commercial sectors. Before I even commissioned as an officer, I spent a summer at Los Alamos National Laboratory in New Mexico where I learned about the history of Los Alamos, its projects, and the surrounding geography. If you watched the movie Oppenheimer you know that the town was created at the direction of Robert Oppenheimer for the atomic bomb project. Fun fact: many of those original buildings are still standing and can be visited on a guided tour. 

Receiving the Thomas D. Moore Aware for research I completed at Los Alamos.

However, the United States (US) banned its own nuclear weapons testing in 1992 to reduce the threat of nuclear war. The United Kingdom and Soviet Union had completed their last known tests a few years earlier and after the US signed on other nuclear capable countries followed suit. Today most of the world’s countries have agreed with and abide by the Comprehensive Nuclear-Test-Ban Treaty. So, what was I doing at Los Alamos? I was working to ensure that the moratorium on nuclear weapons testing continues to be upheld.  

Right after I jumped into the fountain in the Air Gardens at the Air Force Academy, signifying my completion of undergraduate studies

Before the complete ban there was a partial one, which prohibited all but underground testing. By nature, underground testing is hard to see and easier to hide if a nation wants to continue its own tests. The question my team sought to answer was simple: can we develop digital elevation models (DEMs) from remote sensing that are so accurate and precise that they can detect one-to-two-centimeter disturbances of Earth’s surface that have resulted from underground explosions? The team proved the concept with drone collected orthoimagery, but the process was tedious and long. My task was to streamline that workflow. I beta tested a software to correct the flight angles of drone-collected LiDAR data (think echolocation with lasers). From the corrected data we were able to create a DEM of comparable accuracy and precision 30 to 60 times faster than the orthoimagery workflow. Through conducting this research, I enabled my team to collect, analyze, and classify minute changes on Earth’s surface rapidly after an underground explosion, therefore advancing monitoring capabilities for nuclear weapons testing. 

A tale of two perspectives

Shaking the President’s hand at graduation

Interning at both NASA as a civilian and Los Alamos as a military member were incredibly enlightening experiences (although National Labs are not part of the Department of Defense). My worldview expanded significantly between accepting those internships, and I’ve seized many more opportunities to learn more and grow since then. For example, I competed for a graduate school slot straight out of undergrad instead of starting my assigned military job with the rest of my classmates. Actually – serendipitously – experiencing the monsoonal season (which I didn’t know existed in the US) in New Mexico planted the seed for my master’s thesis which explores associations among changing climate patterns, plant cover, and wildfire trends.

I urge everyone to go confidently in the direction of their dreams but stay open to a life they might never have imagined – you never know where the adventure might lead. 

Gabrielle LaRochelle

The best thing about geography is the breadth of possibilities, which have been even further expanded through my military service. I’m not a recruiter and the decision I made to join the military was nuanced, like that of every other service member. Being at OSU has made me appreciate my military training, but it has also given me a valuable connection to the civilian and academic world that I didn’t realize I had been missing. I urge everyone to go confidently in the direction of their dreams but stay open to a life they might never have imagined – you never know where the adventure might lead. 

All views expressed in this article are my own and not representative of the Air Force or DOD

#AGU2023 through graduate eyes

Twenty-two graduate students represented CEOAS at the American Geophysical Union Conference in December 2023. From first timers to seasoned attendees, here are some of their experiences.

Bareera Mirza, PhD Student, presenting “Evaluating Diverse Data Streams for Snow Depth Estimation in Data Assimilation Systems”

Attending AGU in 2023 was my first foray into the world of academic conferences. The event served as an unparalleled platform for both intellectual growth and networking. AGU not only broadened my understanding of cutting-edge scientific endeavors but also provided a glimpse into the diverse and fascinating research being conducted around the world. The conference left an indelible impression on me, emphasizing the global importance and collaborative spirit within the scientific community. – Bareera Mirza, PhD Student in Geography

“Meeting current and future collaborators from around the world. Running into old friends in the massive poster hall and enjoying San Francisco. Celebrating research and collaborative science.” – Kelsey Lane, PhD Student in OEB

PhD Student, Suhail Alhejji presenting “The Origin of Younger Volcanism in Western Saudi Arabia”

AGU 2023 was important to me since I did my first in-person oral presentation at a large international conference like AGU. The valuable feedback I received after the presentation was truly beneficial for my current research. – Suhail Alhejji, PhD Student in Geology

I had a great experience back at AGU in San Francisco! As chaotic as it is, AGU is one of the best places to feel at home in a sea of strangers. When you scurry from room to room or poster to poster, you’ll always have something interesting to overhear or see along the way. AGU has also started to really emphasize scientific engagement with the population and local communities, and you could tell at AGU 2023 that accessibility, outreach, broader impacts of science communication, and K-12 engagement were priorities of the organization, in addition to the important science that advances our understanding of the earth. – Layla Ghazi, PhD Student in Geology

I had researchers I admire ask me for my opinion on new concepts

Deepa Dwyer

Attending AGU as a late-state PhD student feels like a totally different ball game. I got so much more out of the networking and I felt like I could really engage with all the presentations I attended. All in all, it was a great time! – Olivia Williams, PhD Student in Geology

Ashraful Islam, M.S. Student in Geography, presenting “How speckle filtering approaches and kernel sizes affect land cover classification: Sentinel-1 pre-processing parameter selection insights”

AGU 2023 was a great opportunity to share the progress I’ve made on my dissertation research. It was also wonderful to catch up with old friends, and to help undergraduate students I have been mentoring prepare for their first conference! – Sami Cargill, PhD Student in Geology

Attending my very first AGU was phenomenal. It’s a tsunami of scientists and research: overwhelming and electrifying in the magnitude of people you interact with and ideas you absorb and generate. It’s also one giant hype-fest for nerds (some are old friends, some are new) and reminded me why I love what I do. – Jonas Donnenfield, PhD Student in Marine Geology & Geophysics

AGU is one of the best places to feel at home in a sea of strangers

Layla Ghazi, PhD Student, pictured above.

This was by far the best AGU experience I had so far. I co-chaired 2 sessions, and gave 2 talks; one pertaining to my PhD work and another on IODP Expedition 395 that I sailed on during summer of 2023. What made it really amazing for me is feeling that I not only had a lot to learn (as before), but I also had a lot to contribute to conversations. I was able to build and foster collaborations for future projects. Most amazingly, I had researchers I admire ask me for my opinion on new concepts. The combination of this made me truly feel part of the community. – Deepa Dwyer, PhD Student in Marine Geology & Geophysics

At AGU 2023, I picked up some cool stuff! I learned about using Earth Engine Vertex AI and how to manage data better with tools like SHAP and COCALC. Meeting people from Google Earth Engine and learning about job opportunities at Berkley Lab was awesome. Additionally, the discussions on innovative projects like the mangrove study and advancements in image processing using Generative Adversarial Networks for super-resolution were particularly captivating. Understanding hypergraphs in mathematics as a complex extension of traditional graphs added another layer to my learning experience. – Ashraful Islam, MS Student in Geography

Lucy Wanzer (left) and Meghan Sharp (right), PhD Students in Geophysics, presenting posters side by side.

I felt somewhat starstruck at AGU, especially wandering around the exhibit hall and meeting representatives from amazing companies and organizations- as big as NASA and as small as new environmental NGO start ups! As far as my research, the conversations I had between sessions and at my poster gave me a new context for the larger questions and how my research fits into that. It was almost the opposite of imposter syndrome. On top of all of that, this was my first AGU and first time networking with so many people. I realized that networking was similar to making new friends and rekindling old friendships, but it is exhausting and scheduling in some time to refresh yourself socially is extremely worthwhile! – Meghan Sharp, PhD Student in Geophysics
PhD Student Sarah Beethe (center), getting goofy with OSU Alumni, Josh Love (third from right), and collaborators from GEOMAR, Lamont-Doherty Earth Observatory, and University of Hamburg.

AGU2023 – both an exhausting whirlwind and invigorating experience. From meeting long-time inspirations, to connecting with global collaborators, what initially felt like an impossibly large conference center began to feel like a network of the greatest scientists I’ve had the pleasure of meeting. Presenting new methods and findings from a new study area than my past research breached my comfort zone allowing me to grow not just as a scientist, but as a human. – Sarah Beethe, PhD Student in Geology

Featured Presentation Titles (alphabetical by first name)

  • Ashraful Islam: “How speckle filtering approaches and kernel sizes affect land cover classification: Sentinel-1 pre-processing parameter selection insights”
  • Bareera Mirza: “Evaluating the relative value of MODIS snow cover and Sentinel-1 Observations for Snow Water Equivalent Estimation within a Data Assimilation System”
  • Deepa Dwyer: “Glacial fans as archives of the paleo-geomagnetic field: A case study from IODP Exp 341 in the Gulf of Alaska for the 14-50 kyr interval. Presentation # 2: New Records of Geomagnetic Instabilities During the Brunhes Chron From IODP Expeditions 384, 395C and 395 in North Atlantic Ocean”
  • Jonas Donnenfield: “Disentangling mechanisms of persistent benthic hypoxia in the NE Pacific from the late Pleistocene to late Holocene”
  • Kelsey Lane: “Combining molecular, morphometric, and trace element geochemical analysis for a single foraminifera shell: a promising workflow for species with cryptic diversity”
  • Layla Ghazi: “Understanding the phase associations and weathering behavior of rhenium to assess the use of Re as a tracer of georespiration”
  • Meghan Sharp: “Drivers and Mechanisms of Rift Propagation: Initial Observations on Thwaites Eastern Ice Shelf, West Antarctica”
  • Olivia Williams: “Development of a new noble gas extraction method in ice cores”
  • Sami Cargill: “A Multi-Proxy Approach to Develop a Chronological Framework on the Cascadia Margin Using Radiocarbon and Paleomagnetic Secular Variation Constrained by Chemical, Magnetic, and Physical Properties”
  • Sarah Beethe: “After the Minoan: New Radiocarbon Ages of Recently Uncovered Eruptions in the Santorini Caldera”
  • Suhail Alhejji: “The Origin of Younger Volcanism in Western Saudi Arabia”

Dreaming of Summer Field Season from Corvallis Winter

Icy Corvallis winter makes the tales of summer field season that much sweeter. Follow four graduate students during their summer field experiences across the globe, from Yaquina Bay to the Arctic Circle.

Bird-eye view of the R/V Tarajoq in transit across an icy sea from Iceland to Greenland. See Haley Carlton’s post below to learn more! Photo credit: Alex Rivest

BAFFIN BAY || JONAS DONNENFIELD || PhD Student in MG&G

The first ice sighting had the night-shift scientists shouting and scrambling to the ship railings. The small, white form glided towards us on the glassy-smooth surface of the water. Incredulous exclamations sputtered from our lips, intermixed with moments of silence that left the air thrumming with palpable excitement and awe. Sailing north along the west coast of Greenland in Baffin Bay, this first glimpse of sea ice and still ocean was a precursor to the breathtaking environment that awaited us on the rest of our 33-day voyage.

Jonas Donnenfield watching the sunrise during night shift aboard the R/V Armstrong.

Our mission: unravel the history of the substance we were so captivated by, ice, over 20,000 years ago during the last greatest extent of Earth’s ice sheets. Our question: what atmospheric or oceanographic mechanism led to the retreat of the Greenland Ice Sheet? Our method: marine sediment cores, lovingly called mud, which we miraculously retrieve from the sea floor using pipes and wires, ingenuity and improvisation, and a whole lot of teamwork. When we finally docked in Nuuk, Greenland, we had almost 50 gravity or piston sediment cores aboard from across Greenland’s western continental slope. They now reside in the Oregon State University Marine Geology Repository, waiting patiently to reveal secrets of ice long melted.

YAQUINA BAY || MARLENA PENN || Master’s Student in MRM

Yaquina Bay estuary at high-tide.

Last summer I spent one day a week visiting study sites in Yaquina Bay, Oregon. I have been monitoring the growth of native Olympia oysters at five locations since July 2022. In May, we decided to increase our sampling frequency from monthly to bi-weekly and add a second cohort of Olympia oysters. Every visit to Yaquina includes extensive cleaning of aquaculture cages and instruments, weighing every individual oyster (>750 oysters!), taking pictures of every oyster to later analyze for shell dimensions, and water samples from every site. This is a very meticulous process, and it would not have been feasible without the support from several dedicated undergraduate students (Alaina Houser, Drew Moreland and Tyler Wildman).

You’d never guess, but this is the same estuary pictured above at low tide!

One of my favorite parts of field days is seeing the ebb and flow of the estuary. If you were to visit some of these sites at low tide and return at high tide, they would be unrecognizable due to the change in water level. Being able to watch these cycles is such a great reminder of how nature continues on, regardless of our own busy lives.

BAFFIN BAY || KATIE STELLING || PhD Student in MG&G

Katie Stelling (center), and a group of shipboard scientists holding up their “Order” for crossing the Arctic Circle.

This past summer I spent 5 weeks at sea aboard the R/V Neil Armstrong as part of the Baffin Bay Deglacial Experiment (BADEX). Our primary objectives were to create maps and retrieve sediment cores from multiple trough mouth fan systems along the continental slope of the west Greenland Margin, with the larger goal of understanding the oceanographic conditions surrounding the retreat of the Greenland Ice Sheet following the Last Glacial Maximum. Some of my favorite memories are of our Blue Nose ceremony after crossing the Arctic Circle (pictured), the surreal feeling of sailing into a pack of sea ice for the first time, and gathering on the bridge with nearly everyone on the ship to see a sleeping polar bear.

THE ARCTIC||HALEY CARLTON||PhD Student in OEB

Haley Carlton holding a larval fish aboard the R/V Tarajoq. Photo Credit: Alex Rivest

I spent a month in the Arctic last summer with a large, interdisciplinary team studying glacial-fjord ecosystem dynamics! We sailed on the Greenland Institute of Natural Resources’ (GINR) new ship, the R/V Tarajoq, from Iceland to Sermilik fjord in southeast Greenland. We spent two weeks at sea deploying bongo nets and trawls in search of larval fish and zooplankton, cast CTDs to collect water samples and define water masses, and deploy and recover several moorings throughout the fjord. We even spent a few days with a local schoolteacher who came aboard to learn about the science we were doing in their community and visited his village Tiilerilaaq. After two weeks at sea, we returned to Iceland for a few days before I flew to Nuuk to sort and identify some of the zooplankton we collected with collaborators at GINR. 

Krill Intentions: Bringing Lessons Home from a Winter of Fieldwork

RACHEL KAPLAN, PHD STUDENT IN ATMOSPHERIC SCIENCES

Over the last six months, I’ve existed in a kind of parallel universe to that of my normal life in Oregon. I spent May until October at Palmer Station, Antarctica as part of a team studying Antarctic krill (Euphausia superba) – a big change from the Oregon krill species I typically study, and one that taught me so much.

My work is part of a project titled “The Omnivore’s Dilemma: The effect of autumn diet on winter physiology and condition of juvenile Antarctic krill”. Through at-sea fieldwork and experiments in the lab, we spent the field season investigating how climate-driven changes in diet impact juvenile and adult krill health during the long polar night. Winter is a crucial time for krill survival and recruitment, and an understudied season in this remote corner of the world.

Recently collected Antarctic krill (Euphausia superba) await identification and measuring.

During the field season, we were part of two great research cruises along the Western Antarctic Peninsula (check out this great blog post by CEOAS undergraduate Abby Tomita!), and spent the rest of the time at Palmer Station, running long-term experiments to learn how diet influences krill winter growth and development.

There were so many wonderful parts to our time in Antarctica. While at sea, I was constantly aware that each new bay and fjord we sampled was one of the most beautiful places I would ever have the privilege to visit. I was also surprised and thrilled by the number of whales we saw – I recorded over one hundred sightings, including humpbacks, minke, and killer whales. As consumed as I was by looking for whales during the few hours of daylight, it was also rewarding to broaden my marine mammal focus and learn about another krill predator, the crabeater seal, from a great team researching their ecology and physiology.

In between our other work, I processed active acoustic (echosounder) data collected during a winter 2022 cruise that visited many of the same regions of the Western Antarctica Peninsula. Antarctic krill have been much more thoroughly studied than the main krill species that occur off the coast of Oregon, Euphausia pacifica and Thysanoessa spinifera, and it has been amazing to draw upon this large body of literature.

The active acoustic data I’m working with from the Western Antarctic Peninsula, pictured here, was collected along a wiggly cruise track in 2022, giving me the opportunity to learn how to process this type of survey data and appreciate the ways in which a ship’s movements translate to data analysis.

Working with a new flavor of echosounder data has presented me with puzzles that are teaching me to navigate different modes of data collection and their analytical implications, such as for the cruise track data above. I’ll never take data collected along a standardized grid for granted again!

I’ve also learned new techniques that I am excited to apply to my research in the Northern California Current (NCC) region. For example, there are two primary different ways of detecting krill swarms in echosounder data: by comparing the results of two different acoustic frequencies, and by training a computer algorithm to recognize swarms based on their dimensions and other characteristics. After trying a few different approaches with the Antarctic data this season, I developed a way to combine these techniques. In the resulting dataset, two different methods have confirmed that a given area represents krill, which gives me a lot of confidence in it. I’m looking forward to applying this technique to my NCC data, and using it to assess some of my next research questions.

A combination of krill detection techniques identified these long krill aggregations off the coast of the Western Antarctic Peninsula.

Throughout it all, the highlight of the field season was being part of an amazing field team. I worked alongside CEOAS professor Kim Bernard and undergraduate Abby Tomita, who actually started her senior year at OSU remotely from Palmer. From nights full of net tows to busy days in the lab, we became a well-oiled machine, and laughed a lot along the way. Working with the two of them always made me confident that we’d be able to best any difficulties that come up.

After a long, busy, and productive field season, our final challenge was to wrap up our last lab work, pack up equipment and samples, and say goodbye to this beautiful place. Leaving Antarctica is always heartbreaking – you never really know if you’ll be back. But, it’s been amazing to come home to Oregon: I have loved hugging my friends, eating salad, and beginning to apply what I learned in Antarctica to the rest of my graduate school journey.

Though she be but little: How the smallest stages of fishes can determine the success of the United States’ economy.

by Laura Vary, Master’s student, Marine Resource Management

Take a moment to consider the factors that allow you to read this article as an adult today. You (hopefully) have sufficient food and water to power your cells, which work tirelessly to flood your brain with enough glucose to retain an understanding of sentences. You have enough time and attention to focus on these words. In one way or another, you obtained a device with which to view this article, and viable internet connection to load materials. To be in the position of reading this article, many moments had to happen in precisely the right way.

Now, imagine you’re a tiny larval fish, smaller than ball bearing, in the middle of an ocean thousands of miles wide. The fate of your population rests on your poorly developed spine and you are experiencing your environment for the very first time. You lack developed eyes but can recognize light, you can swim (barely), but have no chance of fighting against the strong currents that push you across space. Yet, somehow, you must find food and a comfortable area where you can grow. Somewhere warm enough, as your growth will stop if the water is too cold. Somewhere calm enough, where you can have a chance of not only finding prey but capturing it.

The number of factors that must go right in order for these nearly microscopic creatures to mature into adults is almost incomprehensible. They do, though, and mature adults support a sector of the United States’ economy worth nearly $5.5 billion1.

In the United States, fisheries are extremely important to coastal communities’ cultures and our national economy. If you’ve eaten U.S. seafood recently, chances are that it came from Alaskan waters: 60% of all U.S. fish landings occur in Alaska, primarily in the Bering Sea1. Over $500 million is contributed to the U.S. economy from Alaska alone, and 1.2 million jobs stem from Alaska fisheries2.

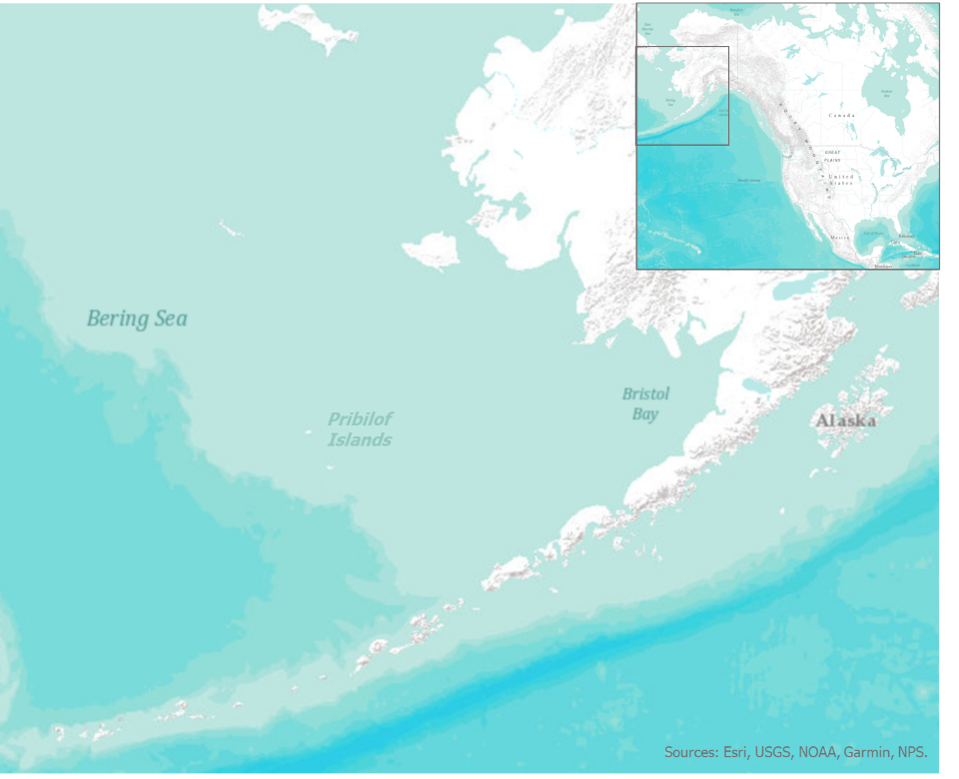
The Bering Sea, a region of exceptional fishery productivity off Alaska’s west coast. The Bering Sea supports many fisheries worth millions of dollars. Notably, the Bering Sea is home to walleye pollock, a groundfish worth $420 million in 2020.

Alaska fisheries are booming, but the environment is changing rapidly. The Bering Sea is experiencing a swift onset of climate change with notable decreases to the sea ice that is vital for a functioning ecosystem3. It is very possible that those little larvae we imagined earlier will have a harder time finding adequate areas to grow up, areas with proper food and comfortable thermal conditions. If larvae are unable to find these preferred areas, the population that supports valuable fisheries is likely to drop in numbers4. Poor larval survival has been observed to cause fishery closures and population declines globally, which cost coastal communities and the U.S. economy millions of dollars5. To improve the health of larvae and secure the health of our fisheries upon which the national economy depends, we must continue supporting fishery sustainability into the future.

Media coverage of the oceans frequently adopts a “doom and gloom” lens, with typical news articles focusing on rapid glacial melt, population crashes, hurricanes, plastic pollution, and a myriad of other threats facing our oceans and coastal communities6,7. While these articles are addressing very real problems, successes in the marine world are often glossed over. Fishery sustainability, for example, is an area in which the U.S. and specifically Alaska have performed quite well.

Historically, fisheries management has been narrow in scope, establishing policies for the uses and protection of single species or even age groups within a species. Fisheries managers tended to imagine the ecosystem as a set of isolated ecological islands rather than dynamic and interwoven facets of the same community8. Alaska, alternatively, has maintained sustainable fisheries through a different approach: ecosystem-based management, or ecosystem-based fisheries management (EBM/EBFM). EBFM acknowledges the interconnected nature of ecosystems and elucidates connections among ecosystem components to promote long-term sustainability of natural resources. EBFM is a management framework in which all components of a healthy ecosystem, including humans and the use of natural resources by humans, are considered8–10. Simply put, EBFM is a way of managing human interactions with natural resources that emphasizes connections within the ecosystem and society and is adaptive across time and space9. In places where it has been implemented, like in Alaska, long-term sustainability of fisheries has been observed which is a testament to the importance of holistic management11,12.

EBFM can be thought of as treating the source of an illness rather than its symptoms. A patient complaining of chronic nausea, for example, will likely have a better health outcome if a doctor considers their diet, environment, stress levels, and exercise routine rather than simply prescribing anti-nausea medications. In Alaska, fisheries have been managed following this  holistic EBFM framework for decades11,12. Researchers and managers work tirelessly to understand the internal connections among organisms, the drivers of change, and the most important threats, much like a doctor trained in comprehensive medicine. Nationally, the U.S. has made strides in implementing EBM principles in fisheries management and scientists recommend the integration of EBM principles to other marine industries, like the development of renewable energy10,13. Now, perhaps you’re wondering why we should still be concerned about the fate of those larvae, and ultimately our fisheries, if EBFM is making such improvements nationwide. This question harkens back to a key concept of EBFM: it is adaptive and iterative in nature, requiring updates and modifications as the environment and human society change over time9. Further, status evaluations across vulnerable life stages of important fisheries (e.g., larvae) are required to improve EBFM implementation5.

A collection of larval fishes, captured by the Alaska Fisheries Science Center ecosystems and fisheries coordinated investigations team.
Credit: NOAA Fisheries, Alaska Fisheries Science Center, 12/30/2021.

To better inform EBFM, it is extremely important to understand what may happen to fish larvae if the Bering Sea warms dramatically or experiences more storms, or demands on fisheries increase to support a growing human population. I spend a lot of my time thinking about larval fishes in the pursuit of a better understanding of the factors that drive survival and successful maturation into juvenile fishes and eventual adults. Specifically, I investigate how the reproductive behavior of larval fishes in the Bering Sea may change in the future, and how anticipated changes could impact the survival of larvae. Through my research, I found that walleye pollock exhibit flexibility in where they spawn. This suggests that in warm years, aggregations of walleye pollock spawning adults may occur in regions different from historic population tendencies (note: these results are unpublished and thus have not been peer-reviewed yet).

            To promote adaptive management, many possible ecosystem states, relating to differing climate states, should be considered10. In the case of pollock, managers need to know that spawning aggregations may shift geographically in warm conditions for many reasons. Pollock eggs (roe) are harvested and so the lucrative roe fishery may need to move locations in the future. A movement of spawning adults could cause larvae to hatch in unfavorable areas, increasing larval mortality and leading to closures of the adult fisheries. Adult pollock could also move outside of U.S. fishing jurisdictions as the region warms, potentially warranting new international fishing agreements or modifications to established fishing areas14. My research therefore supports EBFM approaches by elucidating drivers of change which managers can then integrate within adaptive management strategies. At the end of the day, a failure to acknowledge different survival rates and environmental pressures across life stages in fisheries management could seriously impact the U.S. economy.

            Any U.S. community member is connected to the marine environment through the impact that fisheries and marine industries have on our economy. This economic connection between societies and their ecosystems is a fundamental driver of EBM, and underscores why even individuals living in landlocked states hundreds of miles from a large water body rely on a functioning marine ecosystem. The need for EBM, though, extends beyond fisheries management. Currently, global powers are developing “blue economy” initiatives which seek to improve the financial gains nations can receive from marine and coastal activities15. The blue economy includes any industry that occurs in marine or coastal areas, including power generation, fishing, tourism, and shipping16. The EBM framework should be integrated at every level of blue economy initiatives to prevent follies we’ve experienced in the past (e.g., overfishing, uncontrollable oil spills, plastic pollution, etc.)15. The EBM framework can also promote the development of even more jobs, as collaboration and a diverse team structure are central components of the EBM approach15. Recently, the National Oceanic and Atmospheric Administration released a Blue Economy Strategic Plan that works to enhance emergent marine industries and protect their sustainability into the future16.   

            Yesterday, you may not have ever thought of larval fishes. After reading this article, I hope you understand the importance of their survival to the success of the U.S. economy. Millions of livelihoods and hundreds of coastal communities directly rely upon the commercial harvest of fisheries, but all U.S. citizens indirectly benefit from these marine ventures. At the heart of this industry are the tiny, frequently forgotten young fishes that must fight battles worthy of a Homeric epic: They avoid relatively monstrous predators and capture microscopic prey, all while being swept along by powerful currents. The sustainability of marine fisheries in the U.S. hinges on the implementation of EBFM in management and EBM in emergent blue economy ventures. More specifically, though, it hinges on the ability of scientists and managers to elucidate the drivers of mortality in the most vulnerable life stages of these organisms.


References

1.         Cody, R. Fisheries of the United States, 2019. 167 (2021).

2.         Fisheries, N. The Economic Importance of Seafood | NOAA Fisheries. NOAA https://www.fisheries.noaa.gov/feature-story/economic-importance-seafood (2020).

3.         Stabeno, P. J. & Bell, S. W. Extreme Conditions in the Bering Sea (2017–2018): Record-Breaking Low Sea-Ice Extent. Geophysical Research Letters 46, 8952–8959 (2019).

4.         Hjort, J. Fluctuations in the great fisheries of northern Europe, viewed in the light of biological research. (1914).

5.         Laurel, B. J. et al. Regional warming exacerbates match/mismatch vulnerability for cod larvae in Alaska. Progress in Oceanography 193, 102555 (2021).

6.         Oceans. The New York Times.

7.         Oceans. HuffPost https://www.huffpost.com/impact/topic/oceans.

8.         Lester, S. E. et al. Science in support of ecosystem-based management for the US West Coast and beyond. Biological Conservation 143, 576–587 (2010).

9.         McLeod, K. & Leslie, H. Why Ecosystem-Based Management? in Ecosystem-Based Management for the Oceans 10 (Island Press, 2009).

10.       Leslie, H. M. & McLeod, K. L. Confronting the challenges of implementing marine ecosystem-based management. Frontiers in Ecology and the Environment 5, 540–548 (2007).

11.       Holsman, K. K. et al. Ecosystem-based fisheries management forestalls climate-driven collapse. Nature Communications 11, 4579 (2020).

12.       Fisheries, N. Ecosystem-Based Fisheries Management Strengthens Resilience to Climate Change | NOAA Fisheries. NOAA https://www.fisheries.noaa.gov/feature-story/ecosystem-based-fisheries-management-strengthens-resilience-climate-change (2020).

13.       Copping, A. E. et al. Enabling Renewable Energy While Protecting Wildlife: An Ecological Risk-Based Approach to Wind Energy Development Using Ecosystem-Based Management Values. Sustainability 12, 9352 (2020).

14.       Baker, M. R. Contrast of warm and cold phases in the Bering Sea to understand spatial distributions of Arctic and sub-Arctic gadids. Polar Biol 44, 1083–1105 (2021).

15.       Wenhai, L. et al. Successful Blue Economy Examples With an Emphasis on International Perspectives. Frontiers in Marine Science 6, (2019).

16.       NOAA Finalizes Strategy to Enhance Growth of American Blue Economy. U.S. Department of Commerce https://www.commerce.gov/news/blog/2021/01/noaa-finalizes-strategy-enhance-growth-american-blue-economy (2021).

A journey to Ph.D. and beyond

by Deepa Dwyer, Ph.D. Student, Marine Geology and Geophysics

A Ph.D. can mean many things, each valued differently by those who strive for it. As a woman of color from an underrepresented community, born and raised in India, for me, a Ph.D. has come to be a way to help inspire the next generation of community members and world leaders. 

My lab at sea:
I had an opportunity to sail for a week abord the Oceanus during summer of 2020 collecting sediment cores from the OR-WA margin. 

I have long been dedicated to science outreach and education.  Exploring the mysteries of science became a passion at a very young age, a passion introduced by my mother, but pursuing scientific research didn’t become a focus until my undergraduate research advisor took a risk on me. After earning my undergraduate and master’s degrees, I was a manager of STEM programs at Liberty Science Center in New Jersey, where I collaborated with teachers and educators to develop an inquiry-based, hands-on learning experience for K-12 students. Through this position, I was able to offer students an opportunity to question and explore the mechanisms that make their world tick. 

My commitment to inspiring the next generation of scientists continued when I am reminded of a treasured annual high school summer research project that I managed called Partners in Science. The program’s goal is to pair students with researchers as they forma a collaborative relationship that takes them to a deeper dive through an attainable research goal. Through this program I gained the experience and fertilized the passion to help inspire students and teachers to appreciate scientific endeavors beyond the scope of a middle school or a high school science research project. 

This project motivated me to pursue my Ph.D. My current research explores the mysteries hidden in marine sediment cores from the Gulf of Alaska with the aim to solve them by studying imprints of the Earth’s magnetic field on the sediments. I was driven to this project because of my undergraduate and graduate work, inspired by a group of female scientists, when my research focused on sediments from Antarctica and meteorite from Mars. I enjoy my lab time but miss the impact of outreach initiatives from my previous job, and realized that for me, research alone is not enough. In November of 2021, my committee and I met to discuss transforming one of my dissertation chapters into an education and outreach chapter. 

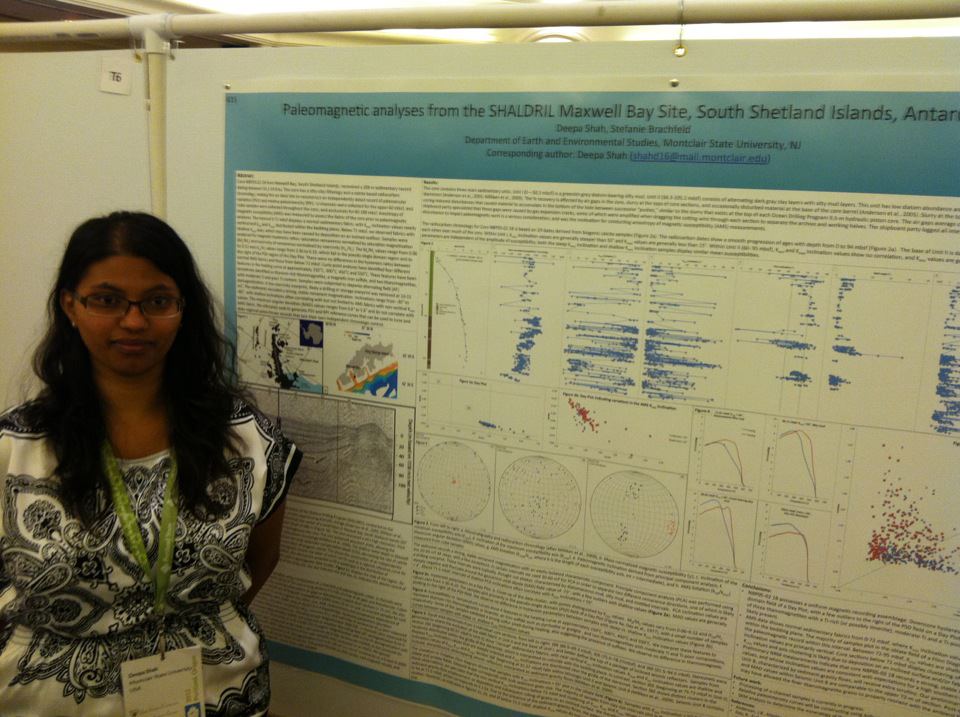
Graduate Student poster at Scientific Committee of Antarctic research
I presented the culminating research from my undergraduate and graduate work on a sediment core from Antarctica, June of 2013. 

Today, effectiveness of research is measured by the questions it attempts to answer and future research it stimulates, but it should also be measured by the educational impact it can make, doors it can open, and people it can inspire.  Inspiring others takes effort; it’s a risk and a gamble.  That’s how I came to be where I am now: I was inspired by many mentors, from my mother to my graduate advisors. The risks they took on my behalf fueled my passion to introduce the full scope of scientific research to high school students during a course of a summer. And now it will fuel my research efforts for the education and outreach chapter of my thesis.

Moving forward, post Ph.D., I will be focusing my efforts on introducing the rigors and wonders of scientific research to middle school and high school teachers and students. I aim to develop a series of annual programs where students, teachers and researchers actively collaborate in efforts to question and answer the mechanisms that make our world tick. 

You Had Me at Glacial Cycles

Blog by Meghan King, PhD student, Oregon State University College of Earth, Ocean, and Atmospheric Sciences

Me in front of a glacially carved U-shaped valley in the Maroon Bells Wilderness in Colorado.

Growing up on the north shore of Long Island, it was inevitable that my life would be shaped by water and sediment. As a child I wandered the rocky beach near my house with my magnifying glass for hours on end, examining everything from sand grains to boulders. In the fourth grade I learned how my little island came to be: a product of repeated glacial advances and retreats that created terminal moraines and outwash plains. At nine years old I became obsessed with understanding Earth’s history through sedimentary deposits, so it’s no surprise that I ended up at Oregon State for a Ph.D. in the field of stratigraphy!

Stratigraphy: it’s all about the layers

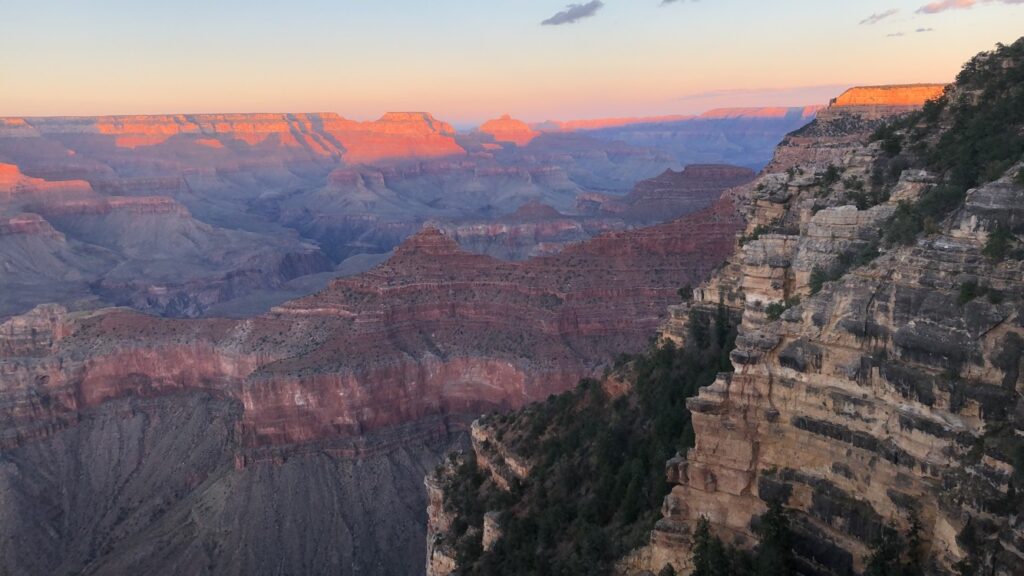
Stratigraphy is a branch of geology that studies the order of layered sedimentary rocks (strata) and their relationship to each other and the geologic time scale. Stratigraphy is fascinating because it is essentially an archive of Earth’s history at a specific geographic location. Some more well-known examples are the Grand Canyon and Death Valley, both of which were covered by an ancient shallow sea during the Paleozoic (542-251 Ma). The strata were originally deposited horizontally within that shallow sea and are different from each other in color, composition, grain size, etc.

The Grand Canyon was eventually carved over a short period of time by the Colorado River. Photo credit: Meghan King

Death Valley stratigraphy has since been uplifted and tilted. Photo credit: Meghan King

My love of water, sediment, and large changes in Earth’s climate converge in my Ph.D. research. The strata in shallow marine environments (like those pictured) physically record how sea level fluctuated in response to glacial-interglacial periods. This is because sea level alters the type and characteristics of deposited sediments. Sea-level response to ice sheet change is typically thought of in the form of a “bathtub” model: When ice starts to melt, the water in the ocean will rise uniformly everywhere like a bathtub. However, this isn’t the whole picture of global sea level.

As ice sheets grow during a glacial period, they push down on the crust beneath them and create a raised bulge around the periphery, just like sitting on a mattress. The opposite happens during the intervals between ice ages. This concept is called glacial isostatic adjustment (GIA). GIA causes sea level to vary at different points on the Earth such that sea level doesn’t change at the same rate/magnitude everywhere. A few other processes contribute to this phenomenon as well. For example, ice sheets are large enough that they exert a gravitational pull on the oceans and draw water towards them, causing sea level to be higher near the ice sheets!

modeling, but for the rocks

What I’m most interested in for my Ph.D. is how GIA alters the stratigraphic preservation of glacial-interglacial cycles. Is there a geographic pattern to this alteration? If so, can we disentangle the signal of GIA from the rest of the stratigraphic record? While we have other records of glacial-interglacial cycles, they tend to exist for only a portion of recent Earth history, so for older deposits, stratigraphy offers consistent insight.  

How have I approached this problem? Modeling! The rich history of field and lab work in the geosciences tends to get a lot of the attention (a lot of cool examples in previous blog posts though), but recently models have become an equally important tool! Modeling may not be as exciting to some, but it’s really fascinating to think about all the questions we can begin to answer with just a few – or in my case – a lot of lines of code!

A photo of me in front of my computer with MATLAB open isn’t as exciting, so here I am with my rock hammer while TA’ing GEO 495 last summer.

Over the past three years I’ve developed some programs in MATLAB which allow me to combine sea level histories and sedimentation histories to build projected stratigraphic records from scratch. The output ends up looking something like the pictures above. I can then correlate, or compare, these records across space to help us understand how GIA is affecting the preservation of glacial-interglacial signals inputted into the models.

I’ve already completed a project using these models on Quaternary (2.6 Ma – present) glacial-interglacial cycles for the West Coast, and now I’m working on expanding the project in a variety of directions. I’ll be incorporating other inputs to make the models more robust. For example, I can vary the model’s ice histories, earth models and tectonic histories, and apply the model to more globally distributed locations in the Pliocene (5.3 – 2.6 Ma).

There is more to understand about sea-level change in the face of our warming climate, so I hope that these models can be altered and applied to a range of other projects as well. Maybe the next generation of inquisitive nine-year-olds hold the key?

Measuring the breaths of rocks

Blog by Layla Ghazi, PhD student, Oregon State University College of Earth, Ocean, and Atmospheric Sciences

Twitter: @biogeoghazi

Layla Ghazi, PhD Student at Smith Rock State Park in Terrebonne, Oregon.

Biogeochemistry is the study of how matter moves through the biological and physical world. The field focuses especially on the biologically interlinked chemical cycles of elements such as carbon, nitrogen, sulfur, and phosphorus. During the spring semester of my junior year of college, I stumbled into the field of biogeochemistry, and I have not looked back. My research questions continue to expand, but they relate most directly to the carbon cycle. What is so sweet about the subject is that I can follow the questions that may develop along the way and end up in an entirely different biogeochemical cycle (ask me about my nitrogen cycle to molybdenum cycle rabbit hole).

Carbon is the fourth most abundant element in the universe. It occurs in many natural forms, ranging from gases like methane (CH4), chlorofluorocarbons (CFCs), and carbon dioxide (CO2) to solids like a diamond or the graphite at the tip of a pencil. Carbon is necessary to keep life as we know it on Earth going, but I’ll give credit for maintenance of the universe as a whole to hydrogen and helium.

A range of processes govern the movement (cycling) of carbon, which is heavily intertwined with Earth’s living and non-living worlds, including volcanic activity (which is rad). I’m most interested in a particular part of the carbon cycle that focuses on the oxidation of old organic carbon stored in sedimentary rocks (also known as petrogenic organic carbon, or OCpetro) in a process called geologic respiration or georespiration. Yes, rocks can “breathe.”

Maybe that prefix of “petro” is familiar? Like petroleum? Petro is the Greek prefix for rock, so petrogenic organic carbon is organic carbon that is released from rocks. The precise way the organic carbon is released through the rocks remains unclear, but some preliminary work shows that the main controls on georespiration are the processes of weathering (chemical or physical breakdown of material) and erosion (removal of material from one place to another). 

How can you begin to measure how much CO2 is released from a rock that is being exposed to oxygen? The scale of that work would be absurd! Enter the trace element, rhenium (Re), which has become an important player in helping to quantify georespiration in certain rivers around the world. Re is believed to mostly be associated with the petrogenic organic carbon in sedimentary rocks through some sweet, sweet organic carbon-metal bonds. When ample oxygen is present, those bonds break, and two products are created synchronously: CO2 and Re. The CO2 is released once the petrogenic carbon meets oxygen, and Re is released from rock to solution phase as a soluble, negatively charged ion.

If you are wondering how this big question of “how do rocks breathe?” gets answered in real time with real data, the key places to look are in the rivers, in the bedrock, in the soils, in the rainwater, and anything else in between. What that means for me is that for the first time in my life, I get to conduct field work. I study georespiration in the Umpqua River of southwestern Oregon and the Eel River of northwestern California, which means my study sites are located in some of the most sublime scenery in the United States. The amount of material that the Eel and Umpqua each transport from the land to the ocean annually are also typical of small mountainous rivers all over the world, which makes what we learn about georespiration from them likely applicable at a global scale.

One of the sampling stations along the Eel River (Credit: Miguel Goñi, Brian Haley, or Julie Pett-Ridge).

This photo was taken this past summer in an additional sampling campaign in the Umpqua River to collect erosion rates. 

Identifying the chemical composition of the bedrock, the soil, the weathered materials, the sediment in the river water, and the petrogenic organic carbon is important to be able to paint a complete picture of the environment we are using to measure georespiration, which means I also work in a wet chemistry lab. As I begin my third year, I’ll be conducting a new (to me) kind of analytical chemistry work to further constrain the chemical and geological identity of the material in the Eel and Umpqua Rivers. These measurements will be combined with previous data of the river water chemistry to evaluate and refine Re as a way to quantify georespiration in the Eel and Umpqua Rivers.

This is one of the multi-collector inductively coupled mass spectrometers (MC-ICP-MS) housed within CEOAS at the Keck Collaboratory. My advisor, Julie Pett-Ridge, is a part of the advisory committee of this world-class analytical geochemical facility.

One of the analyses I’m conducting is on the isotopic composition of the solid materials, like bedrock, soil, sediment, to understand their origin. These columns are used to extract the strontium from a solution, and it can later be analyzed by MC-ICP-MS.

Column chemistry is like following a cooking recipe. Here, I am probably adding some deionized water to the columns while I’m trying to remove some waste before collecting the strontium.

Here, I am using a hot plate for two different tasks at the same time. I’m drying down some river water samples to switch the acid they are in for a different type of analysis, and I am concentrating five beakers of rainwater into one.

Roger that, we are currently enamored

Blog by Rachel Kaplan, PhD student, Oregon State University College of Earth, Ocean, and Atmospheric Sciences and Department of Fisheries, Wildlife, and Conservation Sciences, Geospatial Ecology of Marine Megafauna Lab

Figures by Dawn Barlow, PhD Candidate, OSU Department of Fisheries, Wildlife, and Conservation Sciences, Geospatial Ecology of Marine Megafauna Lab

Note: Rachel originally wrote this blog entry while at sea on a research cruise in the Northern California Current system in May and June 2021. It was originally published on the GEMM Lab blog at https://blogs.oregonstate.edu/gemmlab.

Hello from the R/V Bell M. Shimada! We are currently sampling at an inshore station on the Heceta Head Line, which begins just south of Newport and heads out 45 nautical miles west into the Pacific Ocean. We’ll spend 10 days total at sea, which have so far been full of great weather, long days of observing, and lots of whales.


Dawn (left) and Rachel (right) in matching, many-layered outfits, 125 miles offshore on the flying bridge of the RV Bell M. Shimada.

Run by NOAA, this Northern California Current (NCC) cruise takes place three times per year. It is fabulously interdisciplinary, with teams concurrently conducting research on phytoplankton, zooplankton, seabirds and more. The GEMM Lab will use the whale survey and the krill and oceanographic data to fuel species distribution models as part of Project OPAL. I’ll be working with this data for my Ph.D. with Dr. Leigh Torres and Dr. Kim Bernard, and it’s great to be getting to know the region, study system and sampling processes.

I’ve been to sea a number of times and always really enjoyed it, but this is my first time as part of a marine mammal survey. The type and timing of this work is so different from the many other types of oceanographic science that take place on a typical research cruise. While everyone else is scurrying around deploying instruments and collecting samples at a “station” (a geographic waypoint in the ocean that is sampled repeatedly over time), we– the marine mammal team– are taking a break because we can only survey when the boat is moving. While everyone else is sleeping or relaxing during a long transit between stations, we’re hard at work up on the flying bridge of the ship, scanning the horizon for animals.


Top left: marine mammal survey effort (black lines), and oceanographic sampling stations (red diamonds). Top right: humpback whale sighting locations. Bottom left: fin whale sighting locations. Bottom right: pacific white-sided dolphin sighting locations.

During each “on effort” survey period, Dawn Barlow and I cover separate quadrants of ocean, each manning either the port or starboard side. We continuously scan the horizon for signs of whale blows or bodies, alternating between our eyes and binoculars. During long transits, we work in chunks – forty minutes on effort, and twenty minutes off effort. Staring at the sea all day is surprisingly tiring, and so our breaks often involve “going to the eye spa,” which entails pulling a neck gaiter or hat over your eyes and basking in the darkness.  

Dawn has been joining these NCC cruises for the past four years, and her wealth of knowledge has been a great resource as I learn how to survey and identify marine mammals. Beyond learning the telltale signs of separate species, one of the biggest challenges has been learning how to read the sea better, to judge the difference between a frothy whitecap and a whale blow, or a distant dark wavelet and a dorsal fin. Other times, when conditions are amazing and it feels like we’re surrounded by whales, the trick is to try to predict the positions and trajectory of each whale so we don’t double-count them.

Over the last week, all our scanning has been amply rewarded. We’ve seen pods of dolphins play in our wake, and spotted Dall’s porpoises bounding alongside the ship. Here on the Heceta Line, we’ve seen a diversity of pinnipeds, including Northern fur seals, Stellar sea lions, and California sea lions. We’ve been surprised by several groups of fin whales, farther offshore than expected, and traveled alongside a pod of about 12 orcas for several minutes, which is exactly as magical as it sounds.


Killer whales traveling alongside the Bell M. Shimada, putting on a show for the NCC science team and ship crew. Photo by Dawn Barlow.

Notably, we’ve also seen dozens of humpbacks, including along what Dawn termed “the humpback highway” during our transit offshore of southern Oregon. One humpback put on a huge show just 200 meters from the ship, demonstrating fluke slapping behavior for several minutes. We wanted to be sure that everyone onboard could see the spectacle, so we radioed the news to the bridge, where the officers control the ship. They responded with my new favorite radio call ever: “Roger that, we are currently enamored.”


A group of humpbacks traveling along the humpback highway. Photo by Dawn Barlow.


A humpback whale fluke slapping. Photo by Dawn Barlow.

SpeciesNumber of sightingsTotal number observed
California Sea Lion26
Dall’s Porpoise325
Fin Whale1118
Humpback Whale140218
Killer Whale321
Northern Fur Seal99
Northern Right Whale Dolphin28
Pacific White-sided Dolphin13145
Steller Sea Lion33
Unidentified Baleen Whale104127
Unidentified Dolphin628
Unidentified Whale22

Even with long days and tired eyes, we are still constantly enamored as well. It has been such a rewarding cruise so far, and it’s hard to think of returning back to “real life” next week. For now, we’re wishing you the same things we’re enjoying – great weather, unlimited coffee, and lots of whales!

From Lab to Sea – Conducting Research on the Water

by Nicole Coffey, Ph.D. Student in Ocean, Earth, and Atmospheric Sciences

When I tell people that I study chemistry, often they imagine me standing over bubbling beakers in a lab. However, I study chemistry in the ocean, which means that my approaches need to break from that stereotype. What happens when the work you want to do can’t be done from a land-based lab? What if you have to go out to sea to do get the samples that you need?

Preparing to go to Sea

My advisor (Dr. Rene Boiteau), our collaborators at USC and UCLA, and I are interested in iron transport off the Oregon shelf. Iron is important in the oceans – it plays a role in chemical reactions in the water, and is required for key functions of marine organisms, such as photosynthesis. However, there is not a lot of iron available to critters in the ocean, since iron does not like to be dissolved in seawater and organisms cannot use iron unless it is dissolved. We wanted to investigate how iron moves throughout the ecosystem off the Oregon coast, and how organisms might be using the small amount of iron that is dissolved in the water. We can’t do this work from land – we needed water samples from offshore. So, we set sail on R/V Oceanus at the end of March on a scientific adventure!

Science can be tricky to do on land – and only gets more challenging when you go out to sea. For me, one of the most stressful parts of a research expedition is packing. On land, if you run out of supplies, you may be able to quickly borrow some from a neighboring lab, or buy more and have them delivered within a few days. At sea, if you run out of supplies you can’t get more. Your science has to stop. It’s very important that you pack everything you need (and not a bad idea to bring more than what you think you need, if you have the space to pack it). Packing for this trip involved a lot of spreadsheets and lists developed with my advisor, and triple-checking every box to make sure we had everything we would need out at sea.

We pack far in advance of a cruise to allow us time to figure out if we are missing any supplies. To be as safe as possible for this cruise, everyone going on the ship had to quarantine for two weeks, so we had to be ready to go even earlier. It was a lot of work, but everyone was prepared to board the ship and get set up to do some science at sea the day we reached R/V Oceanus!

Setting up Aboard R/V Oceanus and Science at Sea

R/V Oceanus in port in Newport, OR

Loading a ship with supplies for a successful cruise can be difficult. But we don’t have to carry every piece of equipment up the gangplank by hand. We use a crane to lift all of gear from the dock, assisted by the helpful ship’s crew. Once the gear was onboard, we spent the rest of the day organizing our spaces and setting up our equipment. Having our gear organized, and boxes labelled with their contents, helped this go smoothly! Out on the water, the ship rocks with the waves, meaning anything not held in place may slide around. To avoid an unsafe workspace, all of our gear had to be tied down or screwed into place. I secured the bottles and pump I would use to filter particles from my water samples to a benchtop with bungee cords and ratchet straps while other graduate students built a “bubble” of plastic sheeting to keep their workspace free from dust or potential contaminants. After a hard day’s work, we were all ready to leave port the next morning and get started collecting our samples.

Sample processing setup aboard R/V Oceanus; samples were filtered from the bottles on the left into bottles on the right, then loaded onto solid phase extraction (SPE) columns (in front of bottles on the left).

Once we left port and arrived at our first sampling site, we used a piece of equipment called a CTD (which measures conductivity (to help determine salinity), temperature, and depth) to profile the water from the surface to near-bottom. We also measured how much oxygen was in the water. This information helped us to choose what depths we wanted to sample water from. As the CTD returned to the surface, we used a computer to tell bottles attached to the instrument to close, bringing us water from below the surface. Once the CTD was back on board, it was a flurry of action to collect our samples and get to work in the lab! First, we filter our samples to remove particles. Then, we use a technique called solid phase extraction (SPE) to remove salts and concentrate the sample. The samples are analyzed back on land.

In our downtime, we sometimes would go out on deck to take in the sight of water all around us. Sometimes, we had some visitors – over the course of the trip, we saw sea lions, albatross, gray whales, and dolphins! You never know what you’ll see when you’re out on the water (though fantastic sunsets are always a given).

Dolphins swimming near R/V Oceanus along the Newport Hydrographic Line

A life preserver aboard R/V Oceanus at sunset.

After about a week on board, R/V Oceanus began to have some mechanical problems, and we were forced to return to port. It was disappointing to leave some objectives unfinished, but it was better to be safe rather than risk having worse problems down the line. Though our cruise was cut short, we collected some great samples during our time at sea. We’re all looking forward to analyzing the data to see what we might have found, and for our follow-up trip in July to learn more about iron dynamics on the Oregon shelf.

Follow Nicole on Twitter: @ChemNicoleOcean

See content from this cruise and our upcoming trip with this hashtag on Twitter: #FeTSh2021