You Had Me at Glacial Cycles

Blog by Meghan King, PhD student, Oregon State University College of Earth, Ocean, and Atmospheric Sciences

Me in front of a glacially carved U-shaped valley in the Maroon Bells Wilderness in Colorado.

Growing up on the north shore of Long Island, it was inevitable that my life would be shaped by water and sediment. As a child I wandered the rocky beach near my house with my magnifying glass for hours on end, examining everything from sand grains to boulders. In the fourth grade I learned how my little island came to be: a product of repeated glacial advances and retreats that created terminal moraines and outwash plains. At nine years old I became obsessed with understanding Earth’s history through sedimentary deposits, so it’s no surprise that I ended up at Oregon State for a Ph.D. in the field of stratigraphy!

Stratigraphy: it’s all about the layers

Stratigraphy is a branch of geology that studies the order of layered sedimentary rocks (strata) and their relationship to each other and the geologic time scale. Stratigraphy is fascinating because it is essentially an archive of Earth’s history at a specific geographic location. Some more well-known examples are the Grand Canyon and Death Valley, both of which were covered by an ancient shallow sea during the Paleozoic (542-251 Ma). The strata were originally deposited horizontally within that shallow sea and are different from each other in color, composition, grain size, etc.

The Grand Canyon was eventually carved over a short period of time by the Colorado River. Photo credit: Meghan King

Death Valley stratigraphy has since been uplifted and tilted. Photo credit: Meghan King

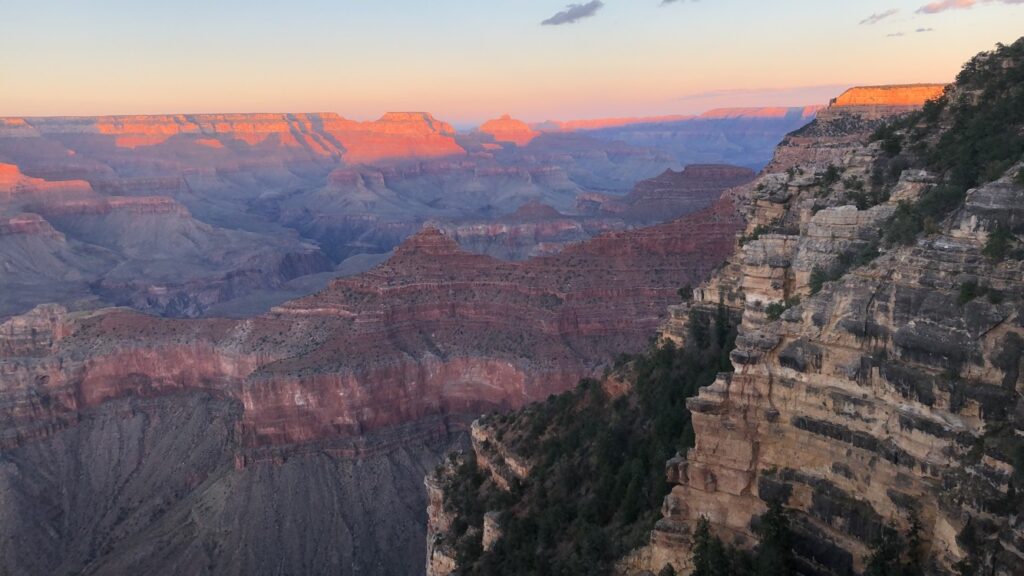
My love of water, sediment, and large changes in Earth’s climate converge in my Ph.D. research. The strata in shallow marine environments (like those pictured) physically record how sea level fluctuated in response to glacial-interglacial periods. This is because sea level alters the type and characteristics of deposited sediments. Sea-level response to ice sheet change is typically thought of in the form of a “bathtub” model: When ice starts to melt, the water in the ocean will rise uniformly everywhere like a bathtub. However, this isn’t the whole picture of global sea level.

As ice sheets grow during a glacial period, they push down on the crust beneath them and create a raised bulge around the periphery, just like sitting on a mattress. The opposite happens during the intervals between ice ages. This concept is called glacial isostatic adjustment (GIA). GIA causes sea level to vary at different points on the Earth such that sea level doesn’t change at the same rate/magnitude everywhere. A few other processes contribute to this phenomenon as well. For example, ice sheets are large enough that they exert a gravitational pull on the oceans and draw water towards them, causing sea level to be higher near the ice sheets!

modeling, but for the rocks

What I’m most interested in for my Ph.D. is how GIA alters the stratigraphic preservation of glacial-interglacial cycles. Is there a geographic pattern to this alteration? If so, can we disentangle the signal of GIA from the rest of the stratigraphic record? While we have other records of glacial-interglacial cycles, they tend to exist for only a portion of recent Earth history, so for older deposits, stratigraphy offers consistent insight.  

How have I approached this problem? Modeling! The rich history of field and lab work in the geosciences tends to get a lot of the attention (a lot of cool examples in previous blog posts though), but recently models have become an equally important tool! Modeling may not be as exciting to some, but it’s really fascinating to think about all the questions we can begin to answer with just a few – or in my case – a lot of lines of code!

A photo of me in front of my computer with MATLAB open isn’t as exciting, so here I am with my rock hammer while TA’ing GEO 495 last summer.

Over the past three years I’ve developed some programs in MATLAB which allow me to combine sea level histories and sedimentation histories to build projected stratigraphic records from scratch. The output ends up looking something like the pictures above. I can then correlate, or compare, these records across space to help us understand how GIA is affecting the preservation of glacial-interglacial signals inputted into the models.

I’ve already completed a project using these models on Quaternary (2.6 Ma – present) glacial-interglacial cycles for the West Coast, and now I’m working on expanding the project in a variety of directions. I’ll be incorporating other inputs to make the models more robust. For example, I can vary the model’s ice histories, earth models and tectonic histories, and apply the model to more globally distributed locations in the Pliocene (5.3 – 2.6 Ma).

There is more to understand about sea-level change in the face of our warming climate, so I hope that these models can be altered and applied to a range of other projects as well. Maybe the next generation of inquisitive nine-year-olds hold the key?

Measuring the breaths of rocks

Blog by Layla Ghazi, PhD student, Oregon State University College of Earth, Ocean, and Atmospheric Sciences

Twitter: @biogeoghazi

Layla Ghazi, PhD Student at Smith Rock State Park in Terrebonne, Oregon.

Biogeochemistry is the study of how matter moves through the biological and physical world. The field focuses especially on the biologically interlinked chemical cycles of elements such as carbon, nitrogen, sulfur, and phosphorus. During the spring semester of my junior year of college, I stumbled into the field of biogeochemistry, and I have not looked back. My research questions continue to expand, but they relate most directly to the carbon cycle. What is so sweet about the subject is that I can follow the questions that may develop along the way and end up in an entirely different biogeochemical cycle (ask me about my nitrogen cycle to molybdenum cycle rabbit hole).

Carbon is the fourth most abundant element in the universe. It occurs in many natural forms, ranging from gases like methane (CH4), chlorofluorocarbons (CFCs), and carbon dioxide (CO2) to solids like a diamond or the graphite at the tip of a pencil. Carbon is necessary to keep life as we know it on Earth going, but I’ll give credit for maintenance of the universe as a whole to hydrogen and helium.

A range of processes govern the movement (cycling) of carbon, which is heavily intertwined with Earth’s living and non-living worlds, including volcanic activity (which is rad). I’m most interested in a particular part of the carbon cycle that focuses on the oxidation of old organic carbon stored in sedimentary rocks (also known as petrogenic organic carbon, or OCpetro) in a process called geologic respiration or georespiration. Yes, rocks can “breathe.”

Maybe that prefix of “petro” is familiar? Like petroleum? Petro is the Greek prefix for rock, so petrogenic organic carbon is organic carbon that is released from rocks. The precise way the organic carbon is released through the rocks remains unclear, but some preliminary work shows that the main controls on georespiration are the processes of weathering (chemical or physical breakdown of material) and erosion (removal of material from one place to another). 

How can you begin to measure how much CO2 is released from a rock that is being exposed to oxygen? The scale of that work would be absurd! Enter the trace element, rhenium (Re), which has become an important player in helping to quantify georespiration in certain rivers around the world. Re is believed to mostly be associated with the petrogenic organic carbon in sedimentary rocks through some sweet, sweet organic carbon-metal bonds. When ample oxygen is present, those bonds break, and two products are created synchronously: CO2 and Re. The CO2 is released once the petrogenic carbon meets oxygen, and Re is released from rock to solution phase as a soluble, negatively charged ion.

If you are wondering how this big question of “how do rocks breathe?” gets answered in real time with real data, the key places to look are in the rivers, in the bedrock, in the soils, in the rainwater, and anything else in between. What that means for me is that for the first time in my life, I get to conduct field work. I study georespiration in the Umpqua River of southwestern Oregon and the Eel River of northwestern California, which means my study sites are located in some of the most sublime scenery in the United States. The amount of material that the Eel and Umpqua each transport from the land to the ocean annually are also typical of small mountainous rivers all over the world, which makes what we learn about georespiration from them likely applicable at a global scale.

One of the sampling stations along the Eel River (Credit: Miguel Goñi, Brian Haley, or Julie Pett-Ridge).

This photo was taken this past summer in an additional sampling campaign in the Umpqua River to collect erosion rates. 

Identifying the chemical composition of the bedrock, the soil, the weathered materials, the sediment in the river water, and the petrogenic organic carbon is important to be able to paint a complete picture of the environment we are using to measure georespiration, which means I also work in a wet chemistry lab. As I begin my third year, I’ll be conducting a new (to me) kind of analytical chemistry work to further constrain the chemical and geological identity of the material in the Eel and Umpqua Rivers. These measurements will be combined with previous data of the river water chemistry to evaluate and refine Re as a way to quantify georespiration in the Eel and Umpqua Rivers.

This is one of the multi-collector inductively coupled mass spectrometers (MC-ICP-MS) housed within CEOAS at the Keck Collaboratory. My advisor, Julie Pett-Ridge, is a part of the advisory committee of this world-class analytical geochemical facility.

One of the analyses I’m conducting is on the isotopic composition of the solid materials, like bedrock, soil, sediment, to understand their origin. These columns are used to extract the strontium from a solution, and it can later be analyzed by MC-ICP-MS.

Column chemistry is like following a cooking recipe. Here, I am probably adding some deionized water to the columns while I’m trying to remove some waste before collecting the strontium.

Here, I am using a hot plate for two different tasks at the same time. I’m drying down some river water samples to switch the acid they are in for a different type of analysis, and I am concentrating five beakers of rainwater into one.