
David P. Turner / December 19, 2021
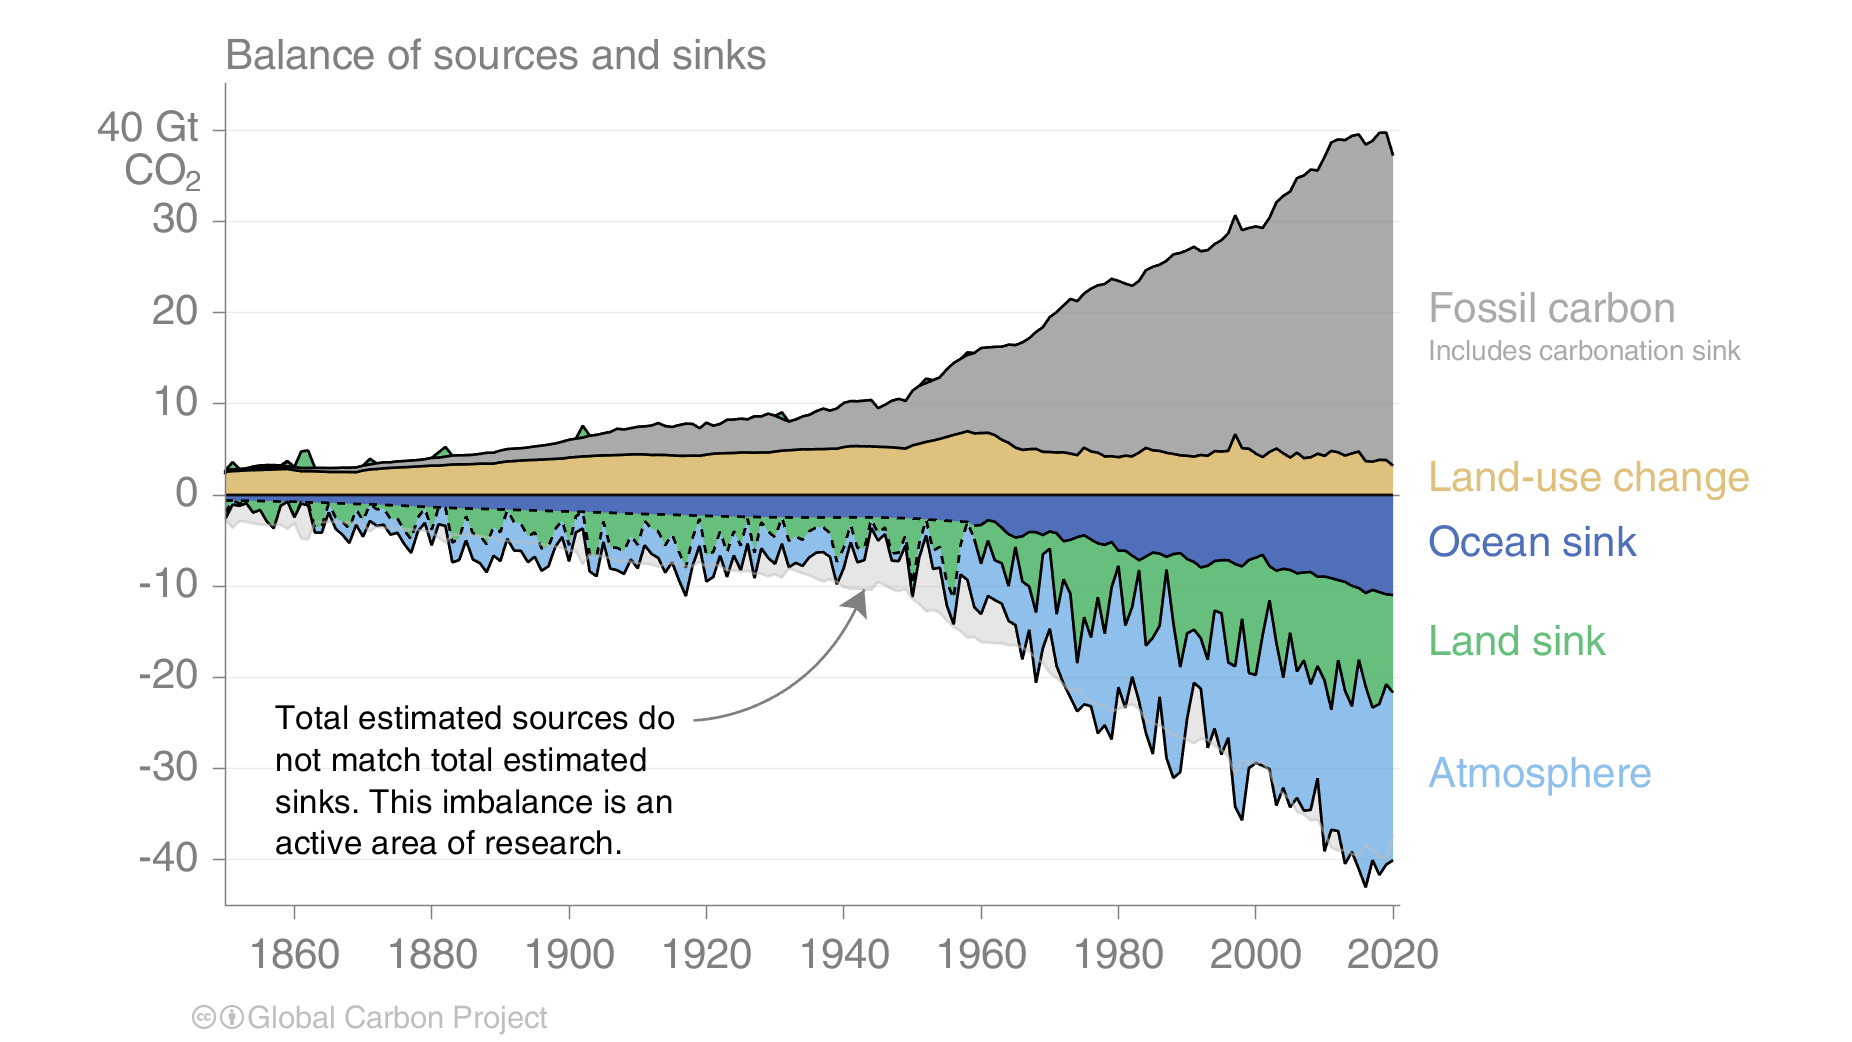
Earth System Science has come to a remarkably good understanding of the global carbon cycle in recent decades. The various pools (stocks) of carbon have been quantified (e.g. vegetation, soil, and atmosphere), along with the annual fluxes from one pool to another. A key revelation has been that the quantity of carbon dioxide (CO2) in the atmosphere is increasing and that the increase is driven by anthropogenic factors (fossil fuel combustion and deforestation).
Since the rising CO2 concentration is associated with a trajectory towards dangerous climate change, humanity has slowly moved towards commitments to reduce CO2 emissions. Some types of emissions are more glaring than others, and this blog highlights four of the most egregious examples (signs of madness).
Likewise, there are many technical and policy options for reducing CO2 emissions or speeding CO2 uptake, and this blog highlights four of the most promising (signs of hope).
Signs of Madness
1. Oil from Tar Sands. Given the goal of reducing anthropogenic CO2 emissions as quickly as possible, an obvious candidate for termination is extraction of oil from tar sands (Figure 1). The whole process of extracting hydrocarbons from the Earth and refining them has an energy cost, with related CO2 emission. Unlike conventional oil, which comes out of the ground ready for the refinery, tar sands hydrocarbons must be mechanically extracted in a bulk form that includes many contaminants. This material is then heated to isolate the oil component, a treatment requiring substantial energy – usually provided by combustion of natural gas. The net effect is a 15% higher overall emissions of CO2 per gallon of gasoline coming from tar sands compared to conventional oil.

2. Tropical Zone Deforestation. About 10% of anthropogenic CO2 emissions comes from tropical zone deforestation. The driving factors are primarily conversion to cattle ranching, industrial and subsistence agriculture, and tree plantations (Figure 2). In 2021, the rate of deforestation in Brazil rose 22% and Indonesia cancelled a billion-dollar agreement with Norway to reduce deforestation. Besides direct CO2 emissions from burning and decomposition of residues, the destruction of intact forests means removal of an on-going carbon sink since most forestland is now gaining carbon as part of normal growth or accelerated growth from CO2 fertilization.

3. Supersonic Passenger Jets. United Air Lines has announced plans to operationalize a fleet of supersonic passenger jets around 2029. Their virtue would be cutting flight times across oceans by about half (they generally aren’t used over land because of sonic booms). Their downside is a factor of 2.5 to 7 increase in carbon emissions per passenger mile. In theory, their engines could burn sustainable aviation fuel but there are many issues with scaling up production of this fuel if demand increased substantially.
4. Bitcoin’s “proof-of-work” Mining Protocol. Bitcoin is a cryptocurrency that has a particularly energy intensive mode of operation, and much of the energy is from fossil fuels. New digital coins are mined (created) by a competitive process in which multiple computer processors race to solve a computationally intense problem. Only one computer wins, meaning that 99.9% of energy use and associated carbon emissions are wasted. Current Bitcoin electricity consumption is on the order of consumption by a small country. Alternative “proof-of-stake” approaches used by other cryptocurrencies are much less energy intensive.
Signs of Hope
1. Natural Climate Solutions (NCS). The land surface is currently a net sink for carbon dioxide, even after accounting for effects of deforestation. Most of that carbon accumulation is showing up in live wood (Figure 3), thus it is tracked by global forest inventories. However, a significant amount may also be accumulating in global soils (in part because of CO2 fertilization of plant growth). The aim of the NCS strategy is to maintain all existing land carbon sinks and foster new carbon sequestration by way of altered land management. Besides stopping deforestation, and reforesting large tracts of previously deforested land, NCS (more broadly Nature-based Solutions) will operate in the agricultural sector, wetlands, and grasslands. Scientists estimate that NCS could provide up to 30% of the reduction in CO2 emission needed to hit net zero emissions at the global scale by 2050.

2. Product Certification. World leaders made a commitment at COP26 to reduce deforestation and end it by 2030. A major player in that effort will be nongovernmental organizations that certify forest products as being produced sustainably, notably not in association with deforestation. Products driving deforestation – and covered to a greater or lesser degree by certification – include wood, beef, leather, soybeans, and palm oil. The science of sourcing forest products is receiving a big boost from research in remote sensing (e.g. radar detection of land cover change) and genetic analyses. Individuals as well as buyers for corporate supply chains are increasingly attentive to sourcing issues and now have better leverage to identify products associated with recent deforestation.
3. Carbon taxes. Economists have long argued that the fastest and more practical strategy for driving down anthropogenic carbon emissions is to establish taxes on fossil fuel carbon emissions. That approach of course tends to arouse political opposition, but several case studies prove carbon taxation is possible and effective. The province of British Columbia in Canada imposed a moderate tax on fossil fuel emission in 2008, which has reduced fuel emissions on the order of 5-15%. Sweden has one of the oldest and highest taxes on fossil fuel emissions. Again, follow-up studies suggest emissions have declined, while maintaining solid GPD growth. Various strategies have been employed to insulate the most vulnerable energy consumers from price increases.
4. Satellite-based Monitoring of Methane Leakage. Methane is a strong greenhouse gas in its own right and is eventually oxidized in the atmosphere to CO2. Unfortunately, methane emissions are on the rise in recent years, with leakage from expanding coal and natural gas mining and infrastructure a significant factor. Because methane has a relatively short atmospheric lifetime (about 8 years) compared to carbon dioxide, a decrease in methane emissions would have an especially large influence on global warming in the next few decades. Earth system scientists use satellite borne sensors to track atmospheric methane concentrations and infer regional patterns in methane emissions. But a new generation of sensors, including one run by the Environmental Defense Fund, is transforming the attribution of leakage sources by increasing the spatial and temporal resolution of the coverage. These sensors will contribute to monitoring the effectiveness of the Global Methane Pledge recently signed at COP26.
The world is at, or fast approaching, the year of peak carbon dioxide emissions. The signs of madness identified here serve to push that year farther into the future. The signs of hope will hasten its arrival and help sustain a multidecadal trajectory towards net zero emissions.
