When the novel coronavirus pandemic hit, the Physics Department, like the rest of Oregon State University, scrambled to get its course offerings ready for remote learning in a few days. Professor David Roundy and his teaching team scrambled as hard as anyone – and incorporated some beginning epidemic modeling into the computational physics class so that the students would begin to acquire the skills that will serve them well as members of the technological community of which they are now junior members.
About the class:
PH366 – Computational Physics – is a course in which students learn how to solve mathematical equations in real-world, complex situations where analytical, “pencil-and-paper” solutions are far too difficult. For example, it’s easy for a student in Introductory Physics to solve a simple differential equation to find a solution in the form of an equation that describes how a ball falls towards the earth under the influence of gravity, a constant force near the earth’s surface. But add extra forces that describe real conditions like air resistance, wind and the earth’s rotation, and a simple equation to describe position as a function of time is impossible. The computer solves the problem numerically, chopping it up into very small time slices and finding a position and velocity for each of the times based on what is was at the previous time. In the PH36x Computational Physics series, students learn techniques to find numerical solutions to many differential equations and they can explore very complex, real-world situations. Roundy has chosen the Python programming language for this class, but the lessons are applicable to any language. In real physics research, few problems are already worked out in a textbook and numerical methods to solve them improve all the time, so the best information is often distributed all over the internet. Physics students must learn to navigate the body of existing literature and identify what information they need to solve a problem.
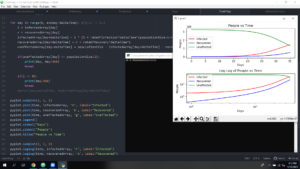
Another view of the solution shows the difference between displaying results on a linear plot and a logarithmic plot. The logarithmic plot (below) highlights the infection and recovery numbers, which are a small fraction of the overall population and we’d be tempted to ignore the fact that there are hundreds of thousands of sick people if we saw only the linear plot (above).
An example that David Roundy chose for the Spring 2020 Computational Physics course was about the spread of an epidemic, like covid-19. It was all everyone was talking about, and he wanted the students to learn how their new computational skills are at the heart of epidemiological modeling that gives us the information to understand and mitigate the spread of the coronavirus. This isn’t an accurate model, Roundy stresses, but it has valuable elements – start with a simple model, probably unrealistic, test it, make sure it works as expected. Add some complexity, test that, and then proceed. In his easy-to-read description at the PH366 course website, Roundy shows students how to model exponential growth – the increase in number of covid-19 cases is proportional to the number of cases: dI/dt = RI. Then you have to add in the real-world fact that the population is finite (with a doubling time of 1 day, the world human population would be infected in a little over a month). Some people recover and have immunity (we hope), so that must be factored into a more realistic model. More complexity comes in when you consider how long infected people are contagious, and whether there is a period of immunity following recovery.
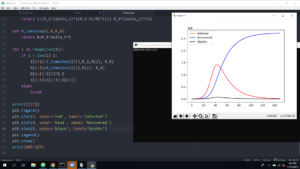
Actually, the problem is not too hard to set up – it’s the solution that becomes tedious. That’s the beauty of computers is that they don’t care about tedium. They swiftly toil through tedious calculations without becoming bored or tired and their error rate is effectively zero! The humans have to set up the problem correctly, though, otherwise the results are meaningless. And this is the skill that Roundy teaches his students. The screenshots below show an example of the students’ work in PH366, with the by-now-familiar plot of an exponential rise in infections at the start, with a peak and fall. We see the basic recovery and death trends, too.

Another view of the solution shows the difference between displaying results on a linear plot and a logarithmic plot. The logarithmic plot (below) highlights the infection and recovery numbers, which are a small fraction of the overall population and we’d be tempted to ignore the fact that there are hundreds of thousands of sick people if we saw only the linear plot (above).

Julian Wulf, one of the Physics majors currently in PH 366 commented, “My favorite part of the class is how it allowed me to model physical situations that were too complex to picture, or model by hand. I have found it quite rewarding to finish coding something and have it modeled in front of me, a model that is often easy to adjust to new circumstances.” It’s easy to see how Julian would relish the challenge of modeling a much more complicated solution that factored in even more complexity such as social contact and real transmission rates.
Teaching in the age of coronavirus:
To deliver PH366, David Roundy goes into Weniger Hall by himself every Tuesday and Thursday and turns on some 20 computers with separate Zoom sessions running (see the panorama view below). The 40 students and the 4 TAs (teaching assistants) log in from their remote locations. The students implement Roundy’s “pair programming” strategy where they decide how to solve the problem and code in pairs, each providing the crucial check on the other to ensure that the steps make sense. They constantly question their results, and look up techniques to improve their code and to interpret the results. It’s a real-world programmer situation! Roundy and the teaching assistants hop between the Zoom breakout rooms to discuss with each pair of students how to troubleshoot and debug their code. It wasn’t easy for the instructors to change their mode of operation from in-person to remote learning. TA Elena Wennstrom comments, “At the beginning, our TA meetings were devoted to brainstorming possible class formats, testing the limits of our Zoom powers, and discussing issues and possible improvements to the class we had the day before. Now we are more able to focus on the content, and trying out the assignments ourselves (like usual). I’m really proud of the system we’ve developed. Classes go surprisingly smoothly, and the time flies.” Wennstrom adds that she gets more and better questions from the students in the remote mode. Roundy remarks that he will offer this new mode of teaching to students with seasonal influenza in “normal” times to help curb the spread of that particular virus.

The students’ response:
The students agree. Julian Wulf says, “I think the transition to remote learning has mostly gone smoothly. There has been a rapid increase in how well things are being communicated remotely, as well as an increasing ability of the teaching assistants and professor to respond to difficulties we encounter while programming. I find myself looking forward to the continued improvement as each class has run more smoothly than the last, with the teaching assistants and Professor Roundy being increasingly able to react to difficulties people encounter by jumping in and out of Zoom breakout rooms to help.”
As “newbie programmer”, Wulf feels that the pair programming method helped him get over an initial fear of programming, and that he has learned to appreciate how quickly he learns to solve new problems. He found the disease and epidemic modeling project interesting, intellectually stimulating and fun.
Wulf says that the coding skills he is developing will be useful in the future, and that they have already entirely changed his perspective. He now routinely plots equations in Mathematica to visualize a physical situation, and his new skills make the task “pain-free” and fun rather than being as a dreaded chore.
Former Physics major John Waczak, now a graduate student in Physics at the University of Texas at Dallas, offers similar observations about the Computational Physics series. He says that Computational Physics is an incredibly powerful tool for building physics understanding and to tackle problems that are otherwise unsolvable. It also enables him to create detailed visualizations of just about anything, and those visualizations don’t have to be static! Computers makes it possible to manipulate 2-, 3-, and even 4-dimensional data and create animations. “I have been using this skill a lot lately to visualize results in my [graduate] classes,” he says. Waczak further appreciates that PH36x made him an autodidact. “Dr. Roundy encouraged us to become familiar with the documentation and common programming forums like Stack Exchange. Instead of giving us working code to start with, we had to learn how to diagnose bugs and navigate the wide variety of (often incorrect) answers that exist online.” This meant that he became better programmer (and physicist). “I certainly do not know all of the tools and features that exist in the python programming language. What I do understand is how to evaluate the credibility of a resource and how to extract what’s important from the large body of existing information.”
Prof. Roundy’s PH366 covid-19 assignment is available at http://sites.science.oregonstate.edu/~roundyd/COURSES/ph366/epidemic.html
The TAs for the class are Elena Wennstron, Kira McCoy, Alex Kuepper and Steven Neiman.
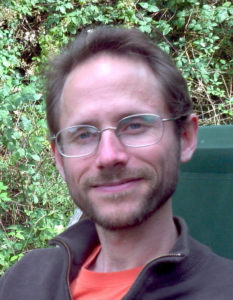
David Roundy is an Associate Professor of Physics at Oregon State University, and has been teaching and researching at OSU since 2006. His work in computational physics spans exotic superconductors, metal-organic frameworks, classical and quantum density functional theory, biological motor proteins and many other topics. He invented the Darcs version control software. He is a member of the Paradigms in Physics team with significant funding from the National Science Foundation for education-related research focusing on thermal physics and computational physics.


