People often ask me what is a good indicator of impact…I usually answer world peace…then I get serious.

I won’t get into language today.  Impact–long term outcome.  For purposes of today, they are both the same:  CHANGE in the person or change in the person’s behavior.

Paul Mazmanian, a medical educator at Virginia Commonwealth University School of Medicine, wanted to determine whether practicing physicians who received only clinical information at a traditional continuing medical education lecture would alter their clinical behavior at the same rate as physicians who received clinical information AND information about barriers to behavioral change.  What he found is profound.  Information about barriers to change did not change the physician’s clinical behavior.  That is important.  Sometimes research yields information that is very useful.  This is the case here.  Mazmanian, etal. (see complete citation below) found (drum roll, please) that both groups of physicians were statistically significantly MORE likely to change their clinical behavior if they indicated their INTENT TO CHANGE their behavior immediately following the lecture they received.

The authors concluded that stated intention to change was important in changing behavior.

We as evaluators can ask the same question: Do you intend to make a behavior change and if so, what specific change.

Albert Bandura talks about self-efficacy.  That is often measured by an individual’s confidence to be able to implement a change.  By pairing the two questions (How confident are you that…and Do you intend to make a change…) evaluators can often capture an indicator of behavior change; that indicator of behavior change is often the best case for long-term outcome.


I’ll be at AEA this week.  Next week, I’m moving offices.  I won’t be blogging.

Citation:

Mazmanian, P. E., Daffron, S. R., Johnson, R. E., Davis, D. A., & Kantrowitz, M. P. (1998). Information about barriers to planned  change: A randomized controlled trial involving continuing medical education lectures and commitment to change. Academic Medicine, 73(8), 882-886.

I blogged earlier this week on civility, community, compassion, and comfort.  I indicated that these are related to evaluation because it is part of the values of evaluation (remember the root of evaluation is value)–is it mean or is it nice…Harold Jarche talked today about these very issues phrasing it as doing the right thing…if you do the right thing, it is nice.  His blog post only reinforces the fact that evaluation is an everyday activity and that you (whether you are an evaluator or not) are the only person who can make a difference.  Yes, it usually takes a village.  Yes, you usually cannot see the impact of what you do (we can’t get easily to world peace).  Yes, you can be the change you want to see.  Yes, evaluation is an every day activity.  Make nice, folks.  Try a little civility; expand your community; remember compassion.  Comfort is the outcome. Comfort seems like a good outcome.  So does doing the right thing.

I know–how does this relate to evaluation?  Although I think it is obvious, perhaps it isn’t.

I’ll start with a little background.  In 1994, M. Scott Peck published  A World Waiting To Be Born: Civility Rediscovered. scott peck civility In that book he defined a problem (and there are many) facing the then 20th century person ( I think it applies to the 21st century person as well).  That problem  was incivility or the “…morally destructive patterns of  self-absorption, callousness, manipulativeness, and  materialism so ingrained in our routine behavior that we  do not even recognize them.”  He wrote this in 1994–well before the advent of the technology that has enabled humon to disconnect from fellow humon while being connected.  Look about you and count the folks with smart phones.  Now, I’ll be the first to agree that technology has enabled a myriad of activities that 20 years ago (when Peck was writing this book) were not even conceived by ordinary folks.  Then technology took off…and as a result, civility, community,  and, yes, even compassion went by the way.

Self-absorption, callousness, manipulativeness, materialism are all characteristics of the lack of, not only civility (as Peck writes), also loss of community and lack of compassion.  If those three (civility, community, compassion) are lost–where is there comfort?  Seems to me that these three are interrelated.

To expand–How many times have you used your smart phone to text someone across the room? (Was it so important you couldn’t wait until you could talk to him/her in person–face-to-face?) How often have you thought to yourself how awful an event is and didn’t bother to tell the other person?  How often did you say the good word? The right thing?  That is evaluation–in the everyday sense.  Those of us who call ourselves evaluators are only slightly different from those of you who don’t.  Although evaluators do evaluation for a living, everyone does it because evaluation is part of what gets us all through the day.

Ask your self as an evaluative task–was I nice or was I mean?  This reflects civility, compassion, and even community.–even very young children know that difference.  Civility and compassion can be taught to kindergarteners–ask the next five year old you see–was it nice or was it mean?  They will tell you.  They don’t lie.  Lying is a learned behavior–that, too, is evaluative.

You can ask your self guiding questions about community; about compassion; about comfort.  They are all evaluative questions because you are trying to determine if you have made a difference.  You CAN be the change you want to see in the world; you can be the change you want to be.  That, too is evaluative.  Civility.  Compassion.  Community.  Comfort. compassion 2

“In reality, winning begins with accountability. You cannot sustain success without accountability. It is an absolute requirement!” (from walkthetalk.com.)

I’m quoting here.  I wish I had thought of this before I read it.  It is important in everyone’s life, and especially when evaluating.


Webster’s defines accountability as, “…“the quality or state of being accountable; an obligation (emphasis added) or willingness to accept responsibility for one’s actions.”  The business dictionary goes a little further and defines accountability as “…The obligation of an individual (or organization) (parentheses added) to account for its activities, accept responsibility for them, and to disclose the results in a transparent manner.”

It’s that last part to which evaluators need to pay special attention; the “disclose results in a transparent manner” part.  There is no one looking over your shoulder to make sure you do “the right thing”; that you read the appropriate document; that you report the findings you found not what you know the client wants to hear.  If you maintain accountability, you are successful; you will win.

AEA has a adopted a set of Guiding Principles Guiding principlesfor the organization and its members.  The principles are 1) Systematic inquiry; 2) Competence; 3) Integrity/Honesty; 4) Respect for people; and 5) Responsibilities for the General and Public Welfare.  I can see where accountability lies within each principle.  Can you?

AEA has also endorsed the Program Evaluation Standards  program evaluation standards of which there are five as well.  They are:  1) Utility, 2) Feasibility, 3) Proprietary, 4) Accuracy, and 5) Evaluation accountability.  Here, the developers were very specific and made accountability a specific category.  The Standard specifically states, “The evaluation accountability standards encourage adequate documentation of evaluations and a metaevaluative perspective focused on improvement and accountability for evaluation processes and products.”

You may be wondering about the impetus for this discussion of accountability (or, not…).  I have been reminded recently that only the individual can be accountable.  No outside person can do it for him or her.  If there is an assignment, it is the individual’s responsibility to complete the assignment in the time required.  If there is a task to be completed, it is the individual’s responsibility (and Webster’s would say obligation) to meet that responsibility.  It is the evaluator’s responsibility to report the results in a transparent manner–even if it is not what was expected or wanted.  As evaluator’s we are adults (yes, some evaluation is completed by youth; they are still accountable) and, therefore, responsible, obligated, accountable.  We are each one responsible–not the leader, the organizer, the boss.  Each of us.  Individually.  When you are in doubt about your responsibility, it is your RESPONSIBILITY to clarify that responsibility however works best for you.  (My rule to live by number 2:  Ask.  If you don’t ask, you won’t get; if you do, you might not get.)

Remember, only you are accountable for your behavior–No. One. Else.  Even in an evaluation.; especially in an evaluation


This Thursday, the U.S. celebrates THE national holiday. independence-2   I am reminded of all that comprises that holiday.  No, not barbeque and parades; fireworks and leisure.  Rather all the work that has gone on to assure that we as citizens CAN celebrate this independence day.  The founding fathers (and yes, they were old [or not so old] white men} took great risks to stand up for what they believed.  They did what I advocate- determined (through a variety of methods) the merit/worth/value of the program, and took a stand.  To me, it is a great example of evaluation as an everyday activity. We now live under that banner of the freedoms for which they stood.   independence

Oh, we may not agree with everything that has come down the pike over the years; some of us are quite vocal about the loss of freedoms because of events that have happened through no real fault of our own.  We just happened to be citizens of the U.S.  Could we have gotten to this place where we have the freedoms, obligations, responsibilities, and limitations without folks leading us?  I doubt it.  Anarchy is rarely, if ever, fruitful.  Because we believe in leaders (even if we don’t agree with who is leading), we have to recognize that as citizens we are interdependent; we can’t do it alone (little red hen notwithstandinglittle red hen).  Yes, the U.S. is known for the  strength that is fostered in the individual (independence).  Yet, if we really look at what a day looks like, we are interdependent on so many others for all that we do, see, hear, smell, feel, taste.  We need to take a moment and thank our farmer, our leaders, our children (if we have them as they will be tomorrow’s leaders), our parents (if we are so lucky to still have parents), and our neighbors for being part of our lives.  For fostering the interdependence that makes the U.S. unique.  Evaluation is an everyday activity; when was the last time you recognized that you can’t do anything alone?

Happy Fourth of July–enjoy your blueberry pie!blueberry pie natural light

A rubric is a way to make criteria (or standards) explicit and it does that in writing so that there can be no misunderstanding.  It is found in many evaluative activities especially assessment of classroom work.  (Misunderstanding is still possible because the English language is often not clear–something I won’t get into today; suffice it to say that a wise woman said words are important–keep that in mind when crafting a rubric.)


This week there were many events that required rubrics. Rubrics may have been implicit; they certainly were not explicit.  Explicit rubrics were needed.


I’ll start with apologies for the political nature of today’s post.

Yesterday’s  activity of the US Senate is an example where a rubric would be valuable.  Gabby  Giffords said it best:  

Certainly, an implicit rubric for this event can be found in this statement:

  Only it was not used.  When there are clear examples of inappropriate behavior; behavior that my daughters’ kindergarten teacher said was mean and not nice, a rubric exists.  Simple rubrics are understood by five year olds (was that behavioir mean OR was that behavior nice).  Obviously 46 senators could only hear the NRA; they didn’t hear that the behavior (school shootings) was mean.

Boston provided us with another example of the mean vs. nice rubric.  Bernstein got the concept of mean vs. nice.

Music is nice; violence is mean.

Helpers are nice; bullying is mean. 

There were lots of rubrics, however implicit, for that event.    The NY Times reported that helpers (my word) ran TOWARD those in need not away from the site of the explosion (violence).   There were many helpers.  A rubric existed, however implicit.

I want to close with another example of a rubric: 

I’m no longer worked up–just determined and for that I need a rubric.  This image may not give me the answer; it does however give me pause.


For more information on assessment and rubrics see: Walvoord, B. E. (2004).  Assessment clear and simple.  San Francisco: Jossey-Bass.


Today’s post is longer than I usually post.  I think it is important because it captures an aspect of data analysis and evaluation use that many of us skip right over:  How to present findings using the tools that are available.  Let me know if this works for you.


Ann Emery blogs at Emery Evaluation.  She challenged readers a couple of weeks ago to reproduce a bubble chart in either Excel or R.  This week she posted the answer.  She has given me permission to share that information with you.  You can look at the complete post at Dataviz Copycat Challenge:  The Answers.


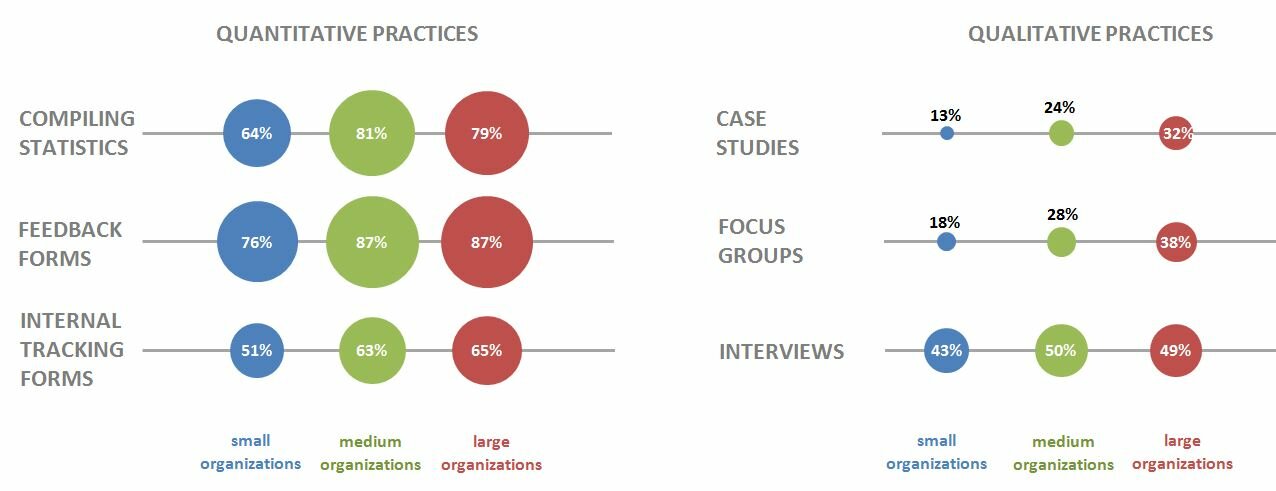
I’ve also copied it here in a shortened format:

“Here’s my how-to guide. At the bottom of this blog post, you can download an Excel file that contains each of the submissions. We each used a slightly different approach, so I encourage you to study the file and see how we manipulated Excel in different ways.

Step 1: Study the chart that you’re trying to reproduce in Excel.

Here’s that chart from page 7 of the State of Evaluation 2012 report. We want to see whether we can re-create the chart in the lower right corner. The visualization uses circles, which means we’re going to create a bubble chart in Excel.

dataviz_challenge_original_chart

Step 2: Learn the basics of making a bubble chart in Excel.

To fool Excel into making circles, we need to create a bubble chart in Excel. Click here for a Microsoft Office tutorial. According to the tutorial, “A bubble chart is a variation of a scatter chart in which the data points are replaced with bubbles. A bubble chart can be used instead of a scatter chart if your data has three data series.”

We’re not creating a true scatter plot or bubble chart because we’re not showing correlations between any variables. Instead, we’re just using the foundation of the bubble chart design – the circles. But, we still need to envision our chart on an x-y axis in order to make the circles.

Step 3: Sketch your bubble chart on an x-y axis.

It helps to sketch this part by hand. I printed page 7 of the report and drew my x and y axes right on top of the chart. For example, 79% of large nonprofit organizations reported that they compile statistics. This bubble would get an x-value of 3 and a y-value of 5.

I didn’t use sequential numbering on my axes. In other words, you’ll notice that my y-axis has values of 1, 3, and 5 instead of 1, 2, and 3. I learned that the formatting seemed to look better when I had a little more space between my bubbles.

dataviz_challenge_x-y_axis_example

Step 4: Fill in your data table in Excel.

Open a new Excel file and start typing in your values. For example, we know that 79% of large nonprofit organizations reported that they compile statistics. This bubble has an x-value of 3, a y-value of 5, and a bubble size of 79%.

Go slowly. Check your work. If you make a typo in this step, your chart will get all wonky.

dataviz_challenge_data_table

Step 5: Insert a bubble chart in Excel.

Highlight the three columns on the right – the x column, the y column, and the frequency column. Don’t highlight the headers themselves (x, y, and bubble size). Click on the “Insert” tab at the top of the screen. Click on “Other Charts” and select a “Bubble Chart.”
dataviz_challenge_insert_chart

You’ll get something that looks like this:
dataviz_challenge_chart_1

Step 6: Add and format the data labels.

First, add the basic data labels. Right-click on one of the bubbles. A drop-down menu will appear. Select “Add Data Labels.” You’ll get something that looks like this:

dataviz_challenge_chart_2

Second, adjust the data labels. Right-click on one of the data labels (not on the bubble). A drop-down menu will appear. Select “Format Data Labels.” A pop-up screen will appear. You need to adjust two things. Under “Label Contains,” select “Bubble Size.” (The default setting on my computer is “Y Value.”) Next, under “Label Position,” select “Center.” (The default setting on my computer is “Right.)

dataviz_challenge_chart_3

Step 7: Format everything else.

Your basic bubble chart is finished! Now, you just need to fiddle with the formatting. This is easier said than done, and probably takes the longest out of all the steps.

Here’s how I formatted my bubble chart:

  • I formatted the axes so that my x-values ranged from 0 to 10 and my y-values ranged from 0 to 6.
  • I inserted separate text boxes for each of the following: the small, medium, and large organizations; the quantitative and qualitative practices; and the type evaluation practice (e.g., compiling statistics, feedback forms, etc.) I also made the text gray instead of black.
  • I increased the font size and used bold font.
  • I changed the color of the bubbles to blue, light green, and red.
  • I made the gridlines gray instead of black, and I inserted a white text box on top of the top and bottom gridlines to hide them from sight.

Your final bubble chart will look something like this:
state_of_evaluation_excel

For more details about formatting charts, check out these tutorials.

Bonus

Click here to download the Excel file that I used to create this bubble chart. Please explore the chart by right-clicking to see how the various components were made. You’ll notice a lot of text boxes on top of each other!”

One of the outcomes of learning about evaluation is informational literacy.

Think about it.  How does what is happening in the world affect your program?  Your outcomes?  Your goals?

When was the last time you applied that peripheral knowledge to what you are doing.  Informational literacy is being aware of what is happening in the world.  Knowing this information, even peripherally, adds to your evaluation capacity.

Now, this is not advocating that you need to read the NY Times daily (although I’m sure they would really like to increase their readership); rather it is advocating that you recognize that none of your programs (whether little p or big P) occur in isolation. What your participants know affects how the program is implemented.  What you know affects how the programs are planned.  That knowledge also affects the data collection, data analysis, and reporting.  This is especially true for programs developed and delivered in the community, as are Extension programs.

Let me give you a real life example.  I returned from Tucson, AZ and the capstone event for an evaluation capacity program I was leading.  The event was an outstanding success–not only did it identify what was learned and what needed to be learned, it also demonstrated the value of peer learning.  I was psyched.  I was energized.  I was in an automobile accident 24 hours after returning home.  (The car was totaled–I no longer have a car; my youngest daughter and I experienced no serious injuries.)  The accident was published in the local paper the following day.  Several people saw the announcement; those same several people expressed their concern; some of those several people asked how they could help.  Now this is a very small local event that had a serious effect on me and my work.   (If I hadn’t had last week’s post already written, I don’t know if I could have written it.)  Solving simple problems takes twice as long (at least).  This informational literacy influenced those around me.  Their knowing changed their behavior to me.  Think of what September 11, 2001 did to people’s behavior; think about what the Pope’s RESIGNATION is doing to people’s behavior.  Informational literacy.  It is all evaluative.  Think about it.


Graphic URL: http://www.otterbein.edu/resources/library/information_literacy/index.htm

On January 22, 23, and 24, a group of would be evaluators will gather in Tucson, AZ at the Westin La Paloma Resort.

Even though Oregon State is a co-sponsor for this program, being in Oregon in winter (i.e., now) is not the land of sunshine, and since Vitamin D is critical for everyone’s well being, I chose Tucson for our capstone event.  Our able support person, Gretchen, chose  the La Paloma, a wonderful site on the north side of Tucson.  So even if it is not warm, it will be sunny.  Why, we might even get to go swimming; if not swimming,  certainly hiking.  There are a lot of places to hike around Tucson…in Sabino Canyon ; near/around A Mountain (first year U of A students get to whitewash or paint the A)  ; Saguaro National Park ; or maybe in one of the five (yes, five) mountain ranges surrounding Tucson.  (If you are interested in other hikes, look here.)

We will be meeting Tuesday afternoon, all day Wednesday, and Thursday morning.  Participants have spent the past 17 months participating in and learning about evaluation.  They have identified a project/program (either big P or little p), and they participated in a series of modules, webinars, and office hours on topics used everyday in evaluating a project or program.We anticipate over 20 attendees from the cohorts.  We have participants from five Extension program areas (Nutrition, Agriculture, Natural Resources, Family and Community Science, and 4-H), from ten western states (Oregon, Washington, California, Utah, Colorado, Idaho, New Mexico, Arizona, Wyoming, and Hawaii.), and all levels of familiarity with evaluation (beginner to expert).

I’m the evaluation specialist in charge of the program content (big P) and Jim Lindstrom (formerly of Washington State, currently University of Idaho) has been the professional development and technical specialist, and Gretchen Cuevas (OSU) has been our wonderful support person.  I’m using Patton’s Developmental Evaluation Model to evaluate this program.  Although some things were set at the beginning of the program (the topics for the modules and webinars, for example), other things were changed depending on feedback (readings, office hours). Although we expect that participants will grow their knowledge of evaluation, we do not know what specific and measurable outcomes will result (hence, developmental). We hope to run the program (available to Extension faculty in the Western Region) again in September 2013.  Our goal is to build evaluation capacity in the Western Extension Region.  Did we?

What have you listed as your goal(s) for 2013?

How is that goal related to evaluation?

One study suggests that you’re 10 times more likely alter a behavior successfully (i.e. get rid of a “bad” behavior; adopt a “good” behavior) than you would if you didn’t make resolution.  That statement is evaluative; a good place to start.  10 times!  Wow.  Yet, even that isn’t a guarantee you will be successful.

How can you increase the likelihood that you will be successful?

  1. Set specific goals.  Break the big goal into small steps; tie those small steps to a time line.  You want to read how many pages by when?  Write it down.  Keep track.
  2. Make it public.  Just like other intentions, if you tell someone there is an increased likelihood you will complete them.  I put it in my quarterly reports to my supervisors.
  3. Substitute “good” for “less than desirable”.  I know how hard it is to write (for example).  I have in the past and will this year again, schedule and protect a specified time to write those three articles that are sitting partly complete.  I’ve substituted “10:00 on Wednesdays and Fridays” for the vague “when I have a block of time I’ll get it done”.  The block of time never materializes.
  4. Keep track of progress.  I mentioned it in number 1; I’ll say it again:  Keep track; make a chart.  I’m going to get those manuscripts done by X data…my chart will reflect that

So are you going to

  1. Read something new to you (even if it is not new)?
  2. Write that manuscript from that presentation you made?
  3. Finish that manuscript you have started AND submit it for publication?
  4. Register for and watch a webinar on a topic you know little about?
  5. Explore a topic you find interesting?
  6. Something else?

Let me hear from you as to your resolutions; I’ll periodically give you an update.


And be grateful for the opportunity…gratitude is a powerful way to reinforce you and your goal setting.