The CGRB will be offering three different workshops this fall. For more information and to register, see the CGRB website.

All workshops are available for credit for students or available to non-students as non-credit workshop(s).

To give perspective students a better insight on each course, we’ve conducted short interviews with the instructors about their course.

See course descriptions and the interviews with the instructors below!


Courses Offered:

Introduction to Unix/Linux and Command-Line Data Analysis (2 modules x 5 weeks @ 2 hrs per week)

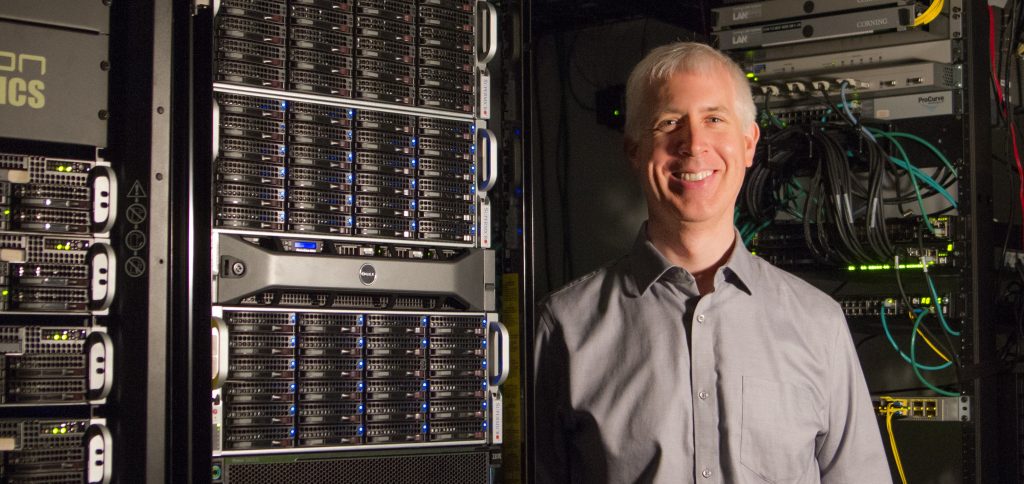
Instructor: Matthew Peterson

Course Description:

Introduction to Unix/Linux (5 weeks @ 2 hrs per week)

Logistics:
Date & Time:
Sep 25 – Oct 23, Mon/Wed 2:00pm – 2:50pm
For credit: BDS599 CRN 20579
Workshop Cost: $250


This module introduces the natural environment of bioinformatics: the Linux command line. Material will cover logging into remote machines, filesystem organization and file manipulation, and installing and using software (including examples such as HMMER, BLAST, and MUSCLE). Finally, we introduce the CGRB research infrastructure (including submitting batch jobs) and concepts for data analysis on the command line with tools such as grep and wc.

Command-Line Data Analysis (5 weeks @ 2 hrs per week)

Logistics:
Date & Time: Nov 4  – Dec 4, Mon/Wed, 2:00pm – 2:50pm
For credit: BDS599 CRN 20580
Workshop Cost: $250


The Linux command-line environment has long been used for analyzing text-based and scientific data, and there are a large number of tools pre-installed for data analysis. These can be chained together to form powerful pipelines. Material will cover these and related tools (including grep, sort, awk, sed, etc.) driven by examples of biological data in a problem-solving context that introduces programmatic thinking. This module also covers regular expressions, a useful syntax for matching and substituting string and sequence data.

Matthew Peterson in the CGRB server room

Q1: What do you hope students gain from this workshop?

My hope is that students come to appreciate the power and flexibility of using the text-based command-line interface to interact with (Linux) computational infrastructures. With practice students will become self-sufficient in utilizing the infrastructure to conduct their own research.

Q2: Favorite topic in your course?

Pipelines! The ability to chain the inputs and outputs of multiple commands to filter data is immensely powerful.

Q3: Who should register for this course?

From the first page of the course syllabus: “Linux/Unix Commands, Bioinformatics Utilities, Computational Infrastructure: If you know nothing about the above, then you are exactly in the right course! WELCOME!”

Q4: Advice for users new to bioinformatics and/or programming?

Practice, practice, practice! Learning how to use the command-line effectively is like making a clay pot, you need to get your hands dirty!


RNA-Sequencing (10 weeks @ 2 hrs per week)

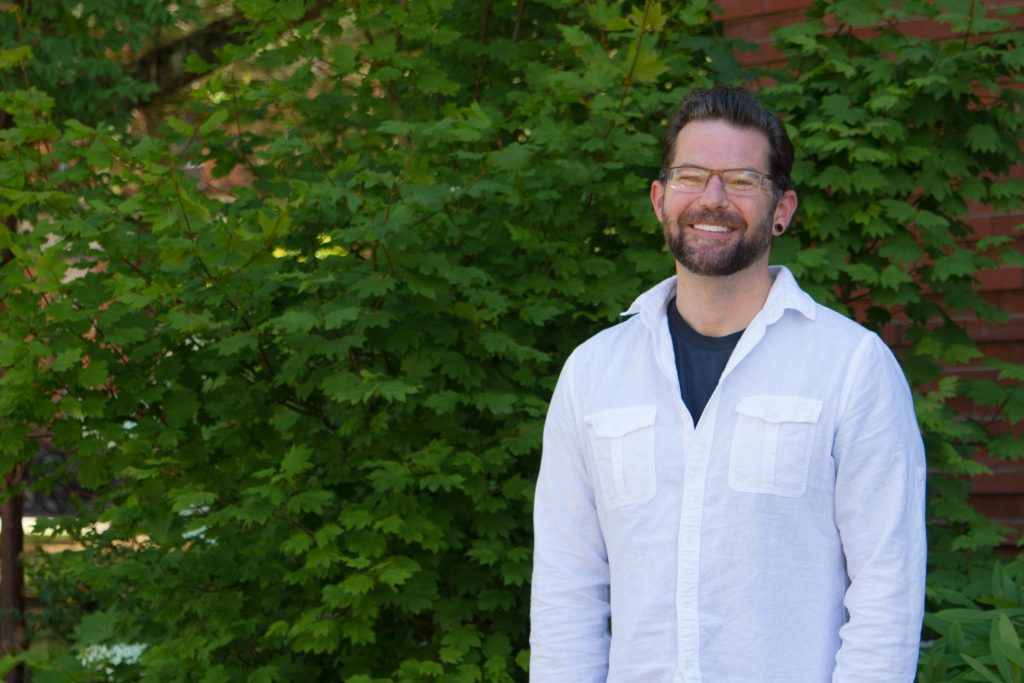
Instructor: Dr. Andrew Black

Course Description:

Logistics:
Date & Time: Sept 25 – Dec 5, Tue/Thur 11:00am – 11:50am
For credit: BDS 599, CRN 20581
Workshop Cost: $500

This course provides an introduction to, and practical experience with, the computational component of bulk-RNA-sequencing. After a general overview, participants will obtain a working introduction to command line, R-studio, and accessing and utilizing a computing infrastructure. Students with then work through a series of exercises cleaning raw FASTQ files, aligning reads to a reference genome, quasi-mapping reads to a transcriptome / de novo assembly, followed by data visualization and Differential Gene Expression analysis.

Dr. Andrew Black will teach the RNA-seq workshop this term.

Q1: What do you hope students gain from this workshop?

I hope that students gain an understanding of the computational workflow involved with RNA-seq and an appreciation of the methodology! My overarching goal with this course is that people can use material from this course as scaffolding for analyzing their own data on the CGRB infrastructure.

Q2: Favorite topic in your course?

I added a lord of the rings theme to my course; students are looking for differentially expressed genes between hobbits and golems. I’m a dork, I know, but I had fun spiking different genes into the data and enjoy having students visualize this.

Q3: Who should register for this course?

Graduate students, postdocs, faculty, or anyone outside of OSU that are interested in receiving an introduction to RNA-seq or for those that are needing to learn the workflow for their own project(s).

Q4: Advice for users new to bioinformatics and/or programming?

Take it one step at a time and get comfortable with several commands before expanding your scope. Also, record your commands / code in a text document, because if you aren’t using it on a daily basis, you’ll forget it!


Data Programming in R (6 weeks @ 3 hrs per week)

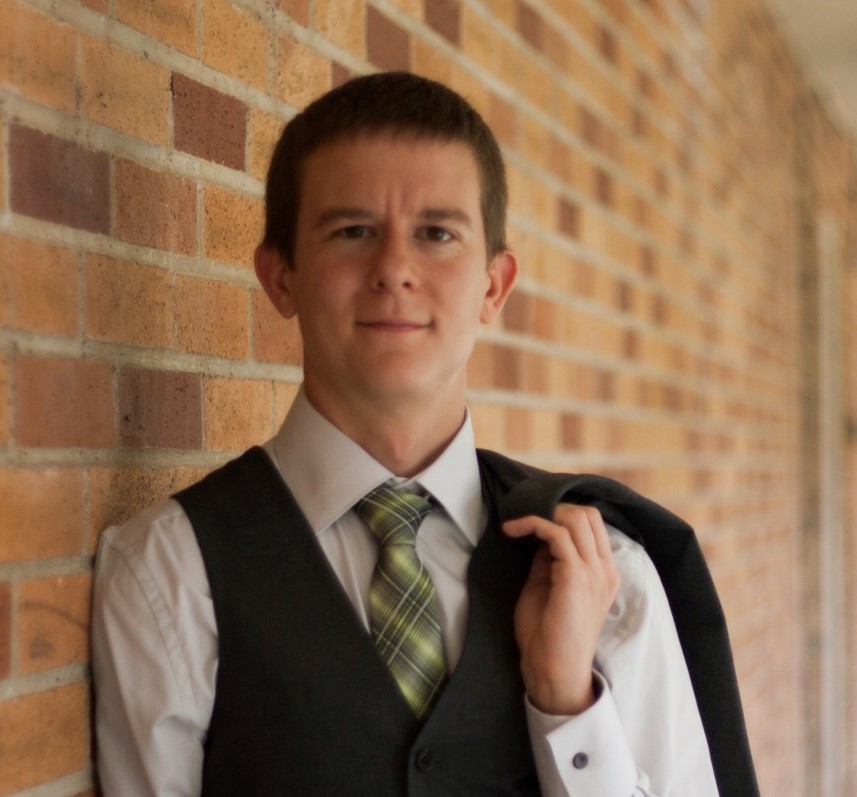
Instructor: Dr. Shawn O’Neil

Logistics:
Date & Time: Sept. 25 – Nov. 6, Mon/Weds/Fri 9:00am – 9:50am
For credit: ST 599, CRN 17196
Workshop Cost: $500


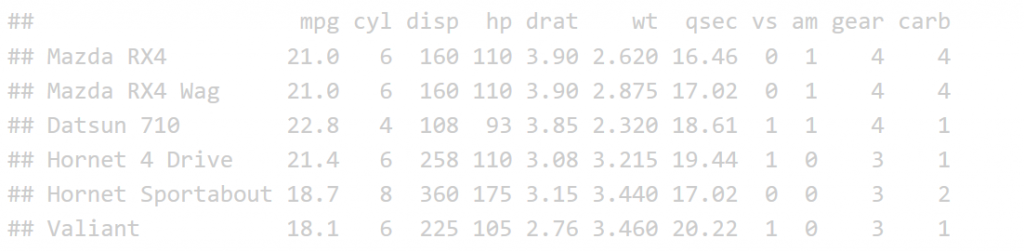
The R programming language is widely used for the analysis of statistical data sets. This course introduces the language from a computer science perspective, covering topics such as basic data types (e.g. integers, numerics, characters, vectors, lists, matrices, and data frames), importing and manipulating data (in particular, vector and data-frame indexing), control flow (loops, conditionals, and functions), and good practices for producing readable, reusable, and efficient R code. We’ll also explore functional programming concepts and the powerful data manipulation and visualization packages dplyr and tidyr, and ggplot2.

Q1: What do you hope students gain from this workshop?

I really hope that students gain an appreciation for programming as a creative activity. It’s not just a means to an end, even with a statistical language like R; there’s a lot of room for play and exploration. Simulation, for example, is a great way to explore complex systems and ask ‘what if’ questions. Many languages (including R) support programmatic drawing and data visualization which can be quite fun.

Q2: Favorite topic in your course?

I always enjoy the point when we first start scaling analyses to thousands of statistical tests. It’s an eye-opening moment, and doing so in R introduces ‘functional programming,’ a powerful and increasingly important paradigm for software design. 

Q3: Who should register for this course?

Anyone who is interested in doing data analysis, especially of a statistical sort. For those interested in learning programming in a broader sense, our winter Intro to Python series is an excellent overview of fundamental concepts. Although we cover the same topics in the R course, R organizes its features differently than most mainstream programming languages like Python, Java, and C++. Learning both Python and R provides a solid foundation for data science!

Q4: Advice for users new to bioinformatics and/or programming?

I do recommend learning more than one programming language, eventually, as this helps separate deeper concepts from syntax. Find what motivates you and explore it via programming — this could be your primary research project, some field you’ve been wanting to learn more about, or even a hobby. 


This blog post was originally published on September 10, 2018 and written by Christopher M. Sullivan, Assistant Director for Biocomputing. Read the whole article here.

The Oregon State University’s Center for Genome Research and Biocomputing (CGRB) and the Plankton Ecology Lab at OSU Hatfield have been collaborating in implementing an image processing pipeline to automate the classification of in situ images of plankton: microscopic organisms at the base of the food web in the world’s oceans and freshwater ecosystems. The imagery collection from a 10-day cruise typically contains approximately 80 TB worth of video, which, in some cases, may convert into image data yielding several billions of segments representing individual plankton and particles that need to be identified; a near impossible task to carry out manually by human experts. While we have a fully functional Convolutional Neural Net (CNN) algorithm that does an excellent job at predicting the identity of the plankton organisms or particles, we have been limited by GPU computational capabilities. We started working with PCI bus based Tesla K40 and K80 GPUs, which were good enough to manage millions of segments. However, when it came to billions of segments, it became a near insurmountable challenge.

Continue reading

R’s default print function for data frames and matrices is not an effective way to display the contents, especially in a html report. RStudio created a R package, DT, that is an interface to the JavaScript library DataTable. DT allows users to have interactive tables that includes searching, sorting, filtering and exporting! I routinely use these tables in my analysis reports.

Install the DT package from cran

First, one must install and load the DT package. Open up RStudio and run the following commands to install and load the DT package:

# Install the DT package
install.packages("DT")
# Load the DT package
library(DT)

Example Table

The print function is not the most effective was to display a table in an HTML R Markdown report.

print(head(mtcars))
This image has an empty alt attribute; its file name is image-10-1024x252.png

Now let’s look at the datatable function for comparison. The input to the datatable function is a data frame or matrix. Let’s make a table with the preloaded iris data that’s in a data.frame. The basic call is DT::datatable(iris) but in our example I’ve added the filter option to the top of the table, and limited the number of entries to 5 per table. See code and table features below:

datatable(iris, filter = "top", 
          options = list(pageLength = 5))

A screen shot of the output looks like:

This image has an empty alt attribute; its file name is image-1024x490.png

Already, the readability is much better than the base r function print. This is a JavaScript based table, stored in a HTML widget, so a flat image doesn’t convey all of the interactive features.

Features

NUMBER OF ENTRIES TO DISPLAY

You’ll notice that there is a drop down menu that says: “Show 5 entries”. The default is 10, but I specified 5 as default with the code pageLength=5. One may select the number of entries to show by using the drop down menu like so:

This image has an empty alt attribute; its file name is image-1.png

SEARCH BAR

The widget also includes a search bar on the top right corner which can be very useful when interactively exploring data. Note at the bottom of the table it shows you how many entries (rows) were found and are being displayed.

This image has an empty alt attribute; its file name is image-2.png
This image has an empty alt attribute; its file name is image-3-1024x58.png

SORT COLUMNS

Notice that to the right of each column name are two arrows: One may sort by ascending or descending order and the direction of the blue arrow indicates by which direction you sorted the column.

This image has an empty alt attribute; its file name is image-6.png

FILTER COLUMNS

The datatable function also allows users to filter each column depending on the datatype: filter numeric columns with a slider & filter columns of class factor with a drop down menu. One must add the filter = "top" (or bottom, etc.) to the code to enable this feature.

This image has an empty alt attribute; its file name is image-7.png
Numeric columns have sliders
This image has an empty alt attribute; its file name is image-8.png
Columns of class factor have a drop down menu

Export Data

Another useful aspect of the datatable function is the “Buttons” extension. This enables users to copy the table, save as a csv, excel or PDF file, or print the table. The table “remembers” what you’ve changed so far—so if you sort by Sepal Length, filter pedal width to > 1 and select species “versicolor” the copied/saved table will have these same restrictions.

datatable(iris, 
          extensions = 'Buttons',
          options = list(dom = 'Bfrtip', 
                         buttons = c('copy', 'csv', 'excel', 'pdf', 'print'))

The above code adds “buttons” to the top of the table like so:

This image has an empty alt attribute; its file name is image-9.png

If one clicks “copy”, the table will be copied to your clipboard, “CSV” or “PDF” will save the table to the give file type, and “print” will bring put the table into a print friendly format and will bring up the print dialog box.

Links and Color

One may also have links in their table. Say you made a data frame with links you want to work in your html report. For example: a data frame of variants w/ links to their position in a genome browser. This is done through not escaping content in the table, specifically the column with the links. The links are made with html and must not be escaped to show up. This applies to other html as well; including color. For me, it was confusing that I had to not escape the html columns. Got it completely backwards the first time I tried it. NOTE: > got replaced with “& gt;” (with no spaces) when it is rendered on the blog… Need to find a fix!

# Make dataframe
df.link <- data.frame(school=c("OSU", "UO", "Linfield", "Willamette"), 
                      mascot=c("beavers", "ducks", "wildcats", "bearcats"),
                      website=c('<a href="http://oregonstate.edu/">oregonstate.edu</a>',
                                '<a href="https://www.uoregon.edu/">uoregon.edu</a>',
                                '<a href="https://www.linfield.edu/">linfield.edu</a>',
                                '<a href="https://www.willamette.edu/">willamette.edu</a>'),
                      School_colors=c('<span style="color:orange">orange & black</span>', 
                                        '<span style="color:green">green & yellow</span>', 
                                        '<span style="color:purple">purple and red</span>', 
                                        '<span style="color:red">red and yellow</span>'))

# When the html columns, 3 & 4, are not escaped, it works!
datatable(df.link, escape = c(1,2,3))
This image has an empty alt attribute; its file name is image-11-1024x333.png

Column Visibility

One may also hide columns from visibility and add a button to add the column back interactively. For example, say we have a data frame called sv.all.i.in. We can hide columns 3 and 4, which are long sequences and disrupt the readability of the table, with the following code:

datatable(sv.all.i.in, extensions = 'Buttons',
          options = list(dom = 'Bfrtip', columnDefs = list(list(visible=FALSE, targets=c(3,4))), 
                         buttons = list(I('colvis'),c('copy', 'csv', 'excel', 'pdf', 'print'))))
This image has an empty alt attribute; its file name is image-12.png

Learn More

There are many more useful features that you can add to your datatable! Learn more here: https://rstudio.github.io/DT/

The CGRB 2019 Fall conference registration is now open! Please join us for our annual event this September for informative talks, posters and a reception. This year the Fall Conference will also include lighting talks.

Important Information:

  • When: Friday, September 20, 2019
  • Where: CH2M Hill Alumni Center – Oregon State University
  • Registration: here
    • Registration fee: $25 (includes lunch and social hour)
    • NOTE: registration fee is waved for:
      • Undergrads presenting their research poster
      • Lightning talk presenters
  • Deadlines:
    • Lightning Talk Submission: August 15th
    • Poster Registration: September 7th
    • Conference Registration: September 13th (registration fee increases to $35 after Sept 13)

Featured Speakers

Ed Kelly
Associate Professor
School of Pharmacy
University of Washington

Daniel Liefwalker
Research Assistant Professor
Molecular and Medical Genetics
Oregon Health and Science University

Doris Taylor
Director
Regenerative Medicine Research
Texas Heart Institute

Conference Agenda

Time
8:00-8:50Registration & refreshments (Poster & sponsor setup)
8:50-9:15Brett Tyler,
Director, CGRB
Introduction, CGRB update
Morning
Session
Hosted By Jaga Giebultowicz
9:15 – 9:40Andrew Annalora,
Environmental and Molecular Toxicology
Exploring Splice Variant Biology in Nuclear Receptor and
Cytochrome P450 Genes
9:40 – 10:30Ed Kelly,
University of Washington
Organs on a Chip – Chips in Space
10:30 – 10:55Break (Poster and Sponsor displays)
10:55 – 11:35Morning Lightning Talks (8 talks) –
moderated by Jeff Anderson
11:35– 12:00Felipe Barreto,
Integrative Biology
Genomics in the Tidepool: Functional and Population
Genetics of Adaptation and Speciation in a
Tiny Crustacean
12:00 – 12:25Kevin Brown,
College of Pharmacy
Adventures in Complex Systems
12:25 – 1:25Lunch (Poster and Sponsor displays)
Afternoon
Session
Hosted By Craig Marcus
1:25 – 1:50Afua Nyarko,
Biochemistry and Biophysics
Selectivity and Specificity in Cancer Regulatory Proteins
1:50 – 2:40Daniel Liefwalker,
Oregon Health and Science University
Therapeutic strategies targeting c-MYC
2:40 – 3:20Afternoon Lightning Talks (8 talks) –
Moderated By Viviana Perez
3:20 – 3:45Break 25 mins (Poster and Sponsor displays)
3:45 – 4:10Morgan Giers,
Chemical, Biological, and Environmental Engineering
Regenerating the Intervertebral Disc: Developing Effective
Therapies in a Nutrient Limited Environment
4:10 – 5:00Doris Taylor,
Texas Heart Institute
Building Solutions for Heart Disease: A 2019 Update
5:00 – 7:30Poster Session / Reception, Sponsor Displays

Call for posters!

Invitation to present a Poster at the 2019 CGRB FALL CONFERENCE (Sept 20, 2019)
Students, Post Docs, Research Staff and Research Faculty are invited to present their research as a Poster. Presenters are strongly encouraged but not required to consider utilizing a revolutionary new trend in poster format: https://twitter.com/mikemorrison

https://osf.io/ef53g
(Posters in any format displayed at recent meetings are also welcome)
Prizes for Best Posters: $100 (Undergraduate, Graduate and Post Doc Categories).

All fields and research topics welcome. To submit a Poster, please navigate to https://beav.es/ZPd
DEADLINE Sept. 7, 2019.

Call for lightning talks!

Invitation to present a Lightning Talk at the 2019 CGRB FALL CONFERENCE (Sept. 20, 2019)
https://cgrb.oregonstate.edu/fall-conference
Students, Post Docs, Research Staff (FRA, Res. Associates, etc.), and Research Faculty are invited to present their research as a 5-minute Lightning Talk at the annual CGRB Fall Conference, Friday Sept. 20, 2019.
First Prize for Best Lightning Talk = $100
Conference Registration Fee is waivedfor all Lightning Talk Presenters

All fields and research topics welcome. To submit a lightning talk: Please navigate to beav.es/ZPA

Talks are limited to 5 minutes and 5 slides maximum. Please Submit no Later Than: August 15, 2019.
Talks will be selected by the Program Committee and Presenters notified by Aug. 31, 2019.

Committee Members

Thank you to our 2019 Fall Conference Committee:

Jaga Giebultowicz, Department of Integrative Biology
Craig Marcus, Environmental and Molecular Toxicology
Jeff Anderson, Department of Botany and Plant Pathology
Viviana Perez, Department of Biochemistry and Biophysics

Friday, October 12, 2018


Poster Award Winners

Undergraduate student: Michaela Buchanan, Computer Sci/Biochemistry & Biophysics  Using GPUs to Classify Oceans of Data
Graduate student:  Courtney Armour, MCB  A Metagenomic Meta-Analysis Reveals Functional Signatures of Health and Disease in the Human Gut Microbiome
Postdoc/Trainer: T. William O’Neill, Biomedical Sciences  Creating 3-Dimensional Models from Serial Histologic Sections Using Open-Source Software

8:00Registration & refreshments (Poster & sponsor setup) 
9:00Brett Tyler, Director, CGRB
Introduction
9:30Helen Poynton, University of Massachusetts   
The Toxicogenome of Hyalella Azteca, building genomic resources for healthy ecosystems
10:20Break (Poster & sponsor setup / displays)
10:45Gerrad Jones, Biological & Ecological Engineering
Environmental Change Drives Global Soil Element Fluxes
11:15James Watson, College of Earth, Ocean & Atmospheric Science
Manifold Learning of Multi-scale Dynamics in Complex Systems
11:45Joe Christison, Office of Commercialization & Corporate Development
Patenting and Commercializing University Discoveries
12:10Lunch (Poster and Sponsor setups / displays)
1:15Daniel Coleman, OHSU
Targeting BET Bromodomain Proteins in Castration-Resistant Prostate Cancer
2:10Maria Franco, Biochemistry & Biophysics
Role of Redox Signaling in Tumor Metabolic Reprogramming
2:40James Strother, Integrative Biology
Elucidation of neural circuit structures through imaging, optogenetics, and behavior
3:05Break 
3:30Maude David, Depts of Microbiology & Pharmacy
Children with autism and their typically-developing siblings differ in exact sequence variants and predicted functions of stool-associated microbes
4:00Vladimir Shulaev, University of North Texas
Neuroprotective effect of 17β-Estradiol (E2) on rat brain
4:50Closing remarks
5:00 – 7:30Poster Session/Reception, Sponsor Displays

Thank you to our conference committee:

Jared LeBoldus, Assistant Professor, Botany & Plant Pathology
Claudia Maier, Professor, Chemistry
Natalia Shulzhenko, Assistant Professor, Vet Biomedical Science

Fall Term 2018
September 26, 2018Andrew Cato
Karlsruhe Institutue of Technology, Germany
Development of Bag-1L as a Therapeutic Target in Androgen Receptor-Dependent Prostate Cancer
Host: Siva Kolluri
October 10, 2018Samara Reck-Peterson
UC San Diego
Molecular mechanisms of microtubule-based motors: how teams of motors work
Host: Michael Freitag
October 24, 2018Siobhan Brady
UC Davis
From networks to switches: systems approaches to unravel the control of biological processes necessary for plant life
Host: John Fowler/Molly Megraw
November 7, 2018Fitnat Yildiz
UC Santa Clara
Mechanisms and regulation of biofilm formation in Vibrio cholerae
Host: Claudia Hase
Winter Term 2019
Feruary 8, 2019William Hersh
OHSU
Three amazing ideas about microbial biogeography that will blow your mind
Host: Denise Hynes
March 6, 2019Nadja Cech
University of North Carolina – Greensboro
Anti-Virulence Strategies Against Drug Resistant Superbugs
Host: Sandra Loesgen
Spring Term 2019
April 3, 2019Chris Marx
University of Idaho
Phenotypic heterogeneity between genetically identical cells permits growth with letal levels of formaldehyde stress
Host: Patrick de Leenheer
April 17,. 2019Melissa Haendel
OHSU/OSU
The Yellow Brick Road of Open Science: Barriers to bringing data to its highest valued use
Host: Brett Tyler
May 1, 2019Kristine Alpi
OHSU
Host: Melissa Haendel
May 15, 2019Lucia Carbone
OHSU
Host: Tom Sharpton
May 29, 2019Andrew Kern
University of Oregon
Putting the HAL in Haldane: leveraging supervised machine learning for population genetics
Host: Aaron Liston

Friday, April 27, 2018

Conference Award Winners

Lightning Talk: Ellie Bors, Population genomics of rapid range expansion during marine invasions
Poster: Lilian Padgitt-Cobb, Toward a phased, diploid assembly of the hop genome

Program

8:00 – 9:00Registration & refreshments (Poster & lightning talk slides setup) 
9:00 – 9:10Chris Sullivan, Assistant Director for Biocomputing, CGRB
Opening Remarks
  Moderator: Duo Jiang, Assistant Professor, Statistics
9:10 – 10:00Haiyan Huang, UC Berkeley
Inferring Gene Interactions and Functional Modules Beyond Standard Statistical Models
10:00 – 10:25Break,time for poster setup
10:25 – 10:50David Hendrix, Assistant Professor, Biochemistry & Biophysics, EECS
Large-scale Automated Annotation and Analysis of RNA Secondary Structure
10:50 – 12:15Lightning talks
Moderator: Molly Megraw, Assistant Professor, Botany & Plant Pathology
12:15 – 1:20Lunch and Poster Session (Poster & Lightning Talk slides judged)
Poster & lightning talk ballot envelopes will be picked up for counting right after lunch
  Moderator: Rebecca Hutchinson, Assistant Professor, Fisheries & Wildlife, EECS
1:20 – 1:45Susan Tilton, Assistant Professor, Environmental & Molecular Toxicology
A 3D Vitro Respiratory Model for Predicting Chemical Toxicity
1:45 – 2:10Stephen Ramsey, Assistant Professor, Biomedical Sciences, EECS
Machine-Learning for Identifying Functional Noncoding SNPs
2:10 – 2:35Clinton Epps, Associate Professor, Fisheries & Wildlife, CAS  
Genetic applications in the Conservation and Management of Bighorn Sheep
2:35 – 3:00Break
3:00 – 3:50Fei Fang, Carnegie Mellon
Machine Learning and Game Theory for Biodiversity Conservation
3:50 – 4:00Vrushali Bokil, Associate Professor, Mathematics
Awards and Closing Remarks

Thank you to our conference committee:

Vrushali Bokil – Associate Professor, Mathematics
Rebecca Hutchinson – Assistant Professor, EECS, Fisheries & Wildlife
Duo Jiang – Assistant Professor, Statistics
Molly Megraw – Assistant Professor, Botany & Plant Pathology

Friday, September 8, 2017

Poster Award Winners

 Postdoc/Trainee: Fadi El-Rami, Subcellular proteomics of the 2016 WHO Neisseria gonorrhoeae reference strains for identification of vaccine candidates and antibiotic resistance signatures
 Grad student: Aayushi Manchanda, Loss of otoferlin alters the transcriptome profile and ribbon synapse architecture of sensory hair cells
 Undergrad student: Ryan Kitchen, CASSA: The new fast GPU DNA Sequence Aligner

Program

8:00Registration & refreshments (Poster & sponsor setup) 
9:00Brett Tyler, Director, CGRB
Introduction, CGRB update
  Moderator: Aleksandra Sikora, Pharmaceutical Sciences
9:25Caroline Attardo Genco, Tufts University 
Sex as a variable: Distinct Neisseria gonorrhoeae gene expression signatures expressed during mucosal infection in men and women
10:10Break (Poster & sponsor setup / displays)
10:30Nathan Campbell,  Columbia River Inter-Tribal Fish Commission 
Genotyping in Thousands by sequencing: A low cost, high-throughput, targeted SNP genotyping method
11:15Olena Taratula, College of Pharmacy  
A Tumor-Activatable Theranostic Nanomedicine Platform for NIR Fluorescence-Guided Surgery and Phototherapy
11:40Posy Busby, Botany & Plant Pathology 
Host genetic structuring of leaf endophyte communities in Populus and Maize
12:05Lunch (Poster and Sponsor setups / displays)
  Moderator: Brent Kronmiller, CGRB
1:20Melissa Haendel, OHSU
Crossing the chasm of semantic despair: ontologies to unify genomics and phenomics
2:05Brett Tyler, Botany & Plant Pathology
Does the pathogen always win – the co-evolutionary struggle between soybean and its oomycete pathogen Phytophthora sojae
2:30Molly Burke, Integrative Biology
Genomic lessons from laboratory evolution experiments  
2:55Break 
3:15Marian Waterman, UC Irvine 
WNT signaling and tumor heterogeneity                     
4:00Maria Clara Franco, Biochemistry & Biophysics
The Two Faces of Nitrated Proteins: Neurodegeneration and Cancer
4:25David Myrold, Crop & Soil Science
Glimpses into the microbial communities of Oregon soils
4:50Janine Trempy, Associate Vice Provost for Academic Affairs
Closing remarks
5:00 – 7:30Poster Session/Reception, Sponsor Displays

Thank you to our conference committee:

Pankaj Jaiswal, Botany & Plant Pathology
Ryan Mehl, Biochemistry & Biophysics
Aleksandra Sikora, Pharmaceutical Sciences

Fall Term 2017
September 27, 2017Geoffrey Wahl
The Salk Institute
Understanding Intra-tumoral heterogeneity using a developmental lens
Host: Arup Indra
October 11, 2017David Thomas
Biochemistry, Molecular Biology and Biophysics
University of Minnesota
Muscle Protein Structural Dynamics and Therapeutic Discovery 
Host: Weihong Qiu
October 25, 2017
Cosponsored by the Departments of Microbiology and Chemistry

ROOM CHANGE
**Withycombe 109**
Paul Jensen
Center for Marine Biotechnology & Biomedicine
UC San Diego
Ecological and evolutionary perspectives on secondary metabolism in marine actinobacteria
Host: Sandra Loesgen
November 8, 2017Brenna Henn
Stony Brook University
What do we gain by studying African genomes? : Examples from human evolution
Host: Thomas Sharpton 
December 6, 2017
Pat Schloss
University of Michigan
Understanding Disease through the Lens of the Microbiome
Host: Thomas Sharpton 
Winter Term 2018
February 7, 2018Scott Landfear
Dept of Molecular Microbiology & Immunology
OHSU
Critical Roles for Glucose Transporters in Parasitic Protozoa: From Cell Biology to Drug Discovery
Host: Sandra Loesgen
February 21, 2018Jason Slot
Fungal Evolutionary Genomics
The Ohio State University
Investigating fungal chemical ecology with evolutionary genomics
Host: Michael Freitag
March 7, 2018Rosalie Sears
Molecular and Medical Genetics
OHSU
Modeling and targeting intra-tumor phenotypic heterogeneity and cellular plasticity
Host: Siva Kolluri
Spring Term 2018
April 4, 2018John Taylor
UC Berkeley
The species problem for fungi in the era of genomics
Host: Nik Grünwald
April 18, 2018Catherine Royer
Biological Sciences
Rensselaer Polytechnic Institute
Pressure-based mapping of protein conformational landscapes
Host: Elisar Barbar
May 2, 2018Maret Traber
Linus Pauling Institute
Oregon State University
Ferroptosis, Mechanism of Cell Death in Vitamin E Deficiency During Embryogenesis?
May 16, 2018Steve Reichow
Chemistry
Portland State  University
Native Lens Gap Junctions Visualized at Near-Atomic Resolution by CryoEM
Host: Elisar Barbar
May 29, 2018
NOTE: Date change
Tuesday, May 29   3:30-4:30    ALS 4001
Rebecca Fry
Environmental Sciences and Engineering
UNC Chapel Hill 
The placental epigenome as a driver of early and later life health effects
Host: Molly Kile