Before you know it, Evaluation ’13 will be here and thousands of evaluators will converge on Washington DC, the venue for this year’s AEA annual meeting.

The Local Arrangements Working Group (LAWG) is blogging this week in AEA365. (You might want to check out all the posts this week.)  There are A LOT of links in these posts (including related past posts) that are worth checking.  For those who have not been to AEA before or for those who have recently embraced evaluation, reading their posts are a wealth of information.

What I want to focus on today is the role of the local arrangements working group.  The Washington Evaluators group is working in tandem with AEA to organize the local part of the conference.  These folks live locally and know the area.  Often they include graduate students as well as seasoned evaluators.  (David Bernstein and Valerie Caracelli are the co-chairs of this year’s LAWG .)  They have a wealth of information in their committee.  (Scroll down to the “Please Check Back for Periodic Updates” to see the large committee–it really does take a village!)  They only serve for the current year and are truly local.  Next year in Denver, there will be a whole new LAWG.

Some things that the committee do include identifying (and evaluating) local restaurants, things to do in DC, and getting around DC.   Although these links provide valuable information, there are those of us (me… smiley) who are still technopeasants and do not travel with a smart phone, tablet, computer, or other electronic connectivity and would like hard copy of pertinent information.  (I want to pay attention to real people in real time–I acknowledge that I am probably an artifact, certainly a technology immigrant–see previous blog about civility.)

Restaurants change quicker than I can keep track–although I’m sure that there are still some which existed when I was in DC last for business.  I’m sure that today, most restaurants provide vegetarian, vegan, gluten-free options (it is, after all, the current trend).  That is very different from when I was there for the last AEA in 2002.  I did a quick search for vegetarian restaurants using the search options available at the LAWG/Washington Evaluators’ site–there were several…I also went to look at reviews…I wonder about the singular bad (very) review…was it just an off night or a true reflection?

There are so many things to do in DC…please take a day–the newer monuments are amazing–see them.

Getting around DC…use the Metro–it gets you to most places; it is inexpensive; it is SAFE!  It has been expanded to reach beyond the DC boundaries.  If nothing else, ride the Metro–you will be able to see a lot of DC.  You can get from Reagan-Washington NationalAirport to the conference venue (yes, you will have to walk 4 blocks and there may be some problem with a receipt–put the fare plus $0.05 on the Metro card and turn in the card).

The LAWG has done a wonderful job providing information to evaluators…check out their site.  See you in DC.

I know–how does this relate to evaluation?  Although I think it is obvious, perhaps it isn’t.

I’ll start with a little background.  In 1994, M. Scott Peck published  A World Waiting To Be Born: Civility Rediscovered. scott peck civility In that book he defined a problem (and there are many) facing the then 20th century person ( I think it applies to the 21st century person as well).  That problem  was incivility or the “…morally destructive patterns of  self-absorption, callousness, manipulativeness, and  materialism so ingrained in our routine behavior that we  do not even recognize them.”  He wrote this in 1994–well before the advent of the technology that has enabled humon to disconnect from fellow humon while being connected.  Look about you and count the folks with smart phones.  Now, I’ll be the first to agree that technology has enabled a myriad of activities that 20 years ago (when Peck was writing this book) were not even conceived by ordinary folks.  Then technology took off…and as a result, civility, community,  and, yes, even compassion went by the way.

Self-absorption, callousness, manipulativeness, materialism are all characteristics of the lack of, not only civility (as Peck writes), also loss of community and lack of compassion.  If those three (civility, community, compassion) are lost–where is there comfort?  Seems to me that these three are interrelated.

To expand–How many times have you used your smart phone to text someone across the room? (Was it so important you couldn’t wait until you could talk to him/her in person–face-to-face?) How often have you thought to yourself how awful an event is and didn’t bother to tell the other person?  How often did you say the good word? The right thing?  That is evaluation–in the everyday sense.  Those of us who call ourselves evaluators are only slightly different from those of you who don’t.  Although evaluators do evaluation for a living, everyone does it because evaluation is part of what gets us all through the day.

Ask your self as an evaluative task–was I nice or was I mean?  This reflects civility, compassion, and even community.–even very young children know that difference.  Civility and compassion can be taught to kindergarteners–ask the next five year old you see–was it nice or was it mean?  They will tell you.  They don’t lie.  Lying is a learned behavior–that, too, is evaluative.

You can ask your self guiding questions about community; about compassion; about comfort.  They are all evaluative questions because you are trying to determine if you have made a difference.  You CAN be the change you want to see in the world; you can be the change you want to be.  That, too is evaluative.  Civility.  Compassion.  Community.  Comfort. compassion 2

“In reality, winning begins with accountability. You cannot sustain success without accountability. It is an absolute requirement!” (from walkthetalk.com.)

I’m quoting here.  I wish I had thought of this before I read it.  It is important in everyone’s life, and especially when evaluating.


Webster’s defines accountability as, “…“the quality or state of being accountable; an obligation (emphasis added) or willingness to accept responsibility for one’s actions.”  The business dictionary goes a little further and defines accountability as “…The obligation of an individual (or organization) (parentheses added) to account for its activities, accept responsibility for them, and to disclose the results in a transparent manner.”

It’s that last part to which evaluators need to pay special attention; the “disclose results in a transparent manner” part.  There is no one looking over your shoulder to make sure you do “the right thing”; that you read the appropriate document; that you report the findings you found not what you know the client wants to hear.  If you maintain accountability, you are successful; you will win.

AEA has a adopted a set of Guiding Principles Guiding principlesfor the organization and its members.  The principles are 1) Systematic inquiry; 2) Competence; 3) Integrity/Honesty; 4) Respect for people; and 5) Responsibilities for the General and Public Welfare.  I can see where accountability lies within each principle.  Can you?

AEA has also endorsed the Program Evaluation Standards  program evaluation standards of which there are five as well.  They are:  1) Utility, 2) Feasibility, 3) Proprietary, 4) Accuracy, and 5) Evaluation accountability.  Here, the developers were very specific and made accountability a specific category.  The Standard specifically states, “The evaluation accountability standards encourage adequate documentation of evaluations and a metaevaluative perspective focused on improvement and accountability for evaluation processes and products.”

You may be wondering about the impetus for this discussion of accountability (or, not…).  I have been reminded recently that only the individual can be accountable.  No outside person can do it for him or her.  If there is an assignment, it is the individual’s responsibility to complete the assignment in the time required.  If there is a task to be completed, it is the individual’s responsibility (and Webster’s would say obligation) to meet that responsibility.  It is the evaluator’s responsibility to report the results in a transparent manner–even if it is not what was expected or wanted.  As evaluator’s we are adults (yes, some evaluation is completed by youth; they are still accountable) and, therefore, responsible, obligated, accountable.  We are each one responsible–not the leader, the organizer, the boss.  Each of us.  Individually.  When you are in doubt about your responsibility, it is your RESPONSIBILITY to clarify that responsibility however works best for you.  (My rule to live by number 2:  Ask.  If you don’t ask, you won’t get; if you do, you might not get.)

Remember, only you are accountable for your behavior–No. One. Else.  Even in an evaluation.; especially in an evaluation


We are approaching Evaluation 2013 (Evaluation ’13).  This year October 16-19, with professional development sessions both before and after the conference.  One of the criteria that I use to determine a “good” conference is did I get three new ideasbright idea 3 (three is an arbitrary number).  One way to get a good idea to use outside the conference, in your work, in your everyday activities is to experience a good presentation.  Fortunately, in the last 15 years much has been written on how to give a good presentation both verbally and with visual support.  This week’s AEA365 blog (by Susan Kistler) talks about presentations as she tells us again about the P2i initiative sponsored by AEA.

I’ve delivered posters the last few years (five or six) and P2i talks about posters in the downloadable handout called, Guidelines for Posters.  Under the tab called (appropriately enough) Posters, P2i also offers information on research posters and a review of other posters as well as the above mentioned Guidelines for Posters.  Although more and more folks are moving to posters (until AEA runs out of room, all posters are on the program), paper presentations with the accompanying power point are still deriguere, the custom of professional conferences.   What P2i has to say about presentations will help you A LOT!!  Read it.

Read it especially if presenting in public, whether to a large group of people or not.  It will help you.  There are some really valuable points that are reiterated in the AEA365 as well as other places.  Check out the following TED talks, look especially for Nancy Durate and Hans Rosling.  A quick internet search yielded the following: About 241,000,000 results (0.43 seconds).  I entered the phrase, “how to make a good presentation“.  Some of the sites speak to oral presentations; some address visual presentations.  What most people do is try to get too much information on a slide (typically using Power point).  Prezi gives you one slide with multiple images imbedded within it.  It is cool.  There are probably other approaches as well.  In today’s world, there is no reason to read your presentation–your audience can do that.  Tell them!  (You know, tell them what they will hear, tell them, tell them what they heard…or something like that.)  If you have to read, make sure what they see is what they hear–see hear compatibility is still important, regardless of the media used.

Make an interesting presentation!  Give your audience at least one good idea!bright idea

You implement a program.  You think it is effective; that it makes a difference; that it has merit and worth.  You develop a survey to determine the merit and worth of the program.  You send the survey out to the target audience which is an intact population–that is, all of the participants are in the target audience for the survey.  You get less than 4o% response rate.  What does that mean?  Can you use the results to say that the participants saw merit in the program?  Do the results indicate that the program has value; that it made a difference if only 40% let you know what they thought.

I went looking for some insights on non-responses and non-responders.  Of course, I turned to Dillman  698685_cover.indd(my go to book for surveys…smiley).  His bottom line: “…sending reminders is an integral part of minimizing non-response error” (pg. 360).

Dillman (of course) has a few words of advice.  For example, on page 360, he says, ” Actively seek means of using follow-up reminders in order to reduce non-response error.”  How do you not burden the target audience with reminders, which are “…the most powerful way of improving response rate…” (Dillman, pg. 360).  When reminders are sent they need to be carefully worded and relate to the survey being sent.  Reminders stress the importance of the survey and the need for responding.

Dillman also says (on page 361) to “…provide all selected respondents with similar amounts and types of encouragement to respond.”  Since most of the time incentives are not an option for you the program person, you have to encourage the participants in other ways.  So we are back to reminders again.

To explore the topic of non-response further, there is a booksurvey non-response (Groves, Robert M., Don A. Dillman, John Eltinge, and Roderick J. A. Little (eds.). 2002. Survey Nonresponse. Wiley-Interscience: New York) that deals with the topic. I don’t have it on my shelf, so I can’t speak to it.  I found it while I was looking for information on this topic.

I also went on line to EVALTALK and found this comment which is relevant to evaluators attempting to determine if the program made a difference:  “Ideally you want your non-response percents to be small and relatively even-handed across items. If the number of nonresponds is large enough, it does raise questions as to what is going for that particular item, for example, ambiguous wording or a controversial topic. Or, sometimes a respondent would rather not answer a question than respond negatively to it. What you do with such data depends on issues specific to your individual study.”  This comment was from Kathy Race of Race & Associates, Ltd.,  September 9, 2003.

A bottom line I would draw from all this is respond…if it was important to you to participate in the program then it is important for you to provide feedback to the program implementation team/person.


This Thursday, the U.S. celebrates THE national holiday. independence-2   I am reminded of all that comprises that holiday.  No, not barbeque and parades; fireworks and leisure.  Rather all the work that has gone on to assure that we as citizens CAN celebrate this independence day.  The founding fathers (and yes, they were old [or not so old] white men} took great risks to stand up for what they believed.  They did what I advocate- determined (through a variety of methods) the merit/worth/value of the program, and took a stand.  To me, it is a great example of evaluation as an everyday activity. We now live under that banner of the freedoms for which they stood.   independence

Oh, we may not agree with everything that has come down the pike over the years; some of us are quite vocal about the loss of freedoms because of events that have happened through no real fault of our own.  We just happened to be citizens of the U.S.  Could we have gotten to this place where we have the freedoms, obligations, responsibilities, and limitations without folks leading us?  I doubt it.  Anarchy is rarely, if ever, fruitful.  Because we believe in leaders (even if we don’t agree with who is leading), we have to recognize that as citizens we are interdependent; we can’t do it alone (little red hen notwithstandinglittle red hen).  Yes, the U.S. is known for the  strength that is fostered in the individual (independence).  Yet, if we really look at what a day looks like, we are interdependent on so many others for all that we do, see, hear, smell, feel, taste.  We need to take a moment and thank our farmer, our leaders, our children (if we have them as they will be tomorrow’s leaders), our parents (if we are so lucky to still have parents), and our neighbors for being part of our lives.  For fostering the interdependence that makes the U.S. unique.  Evaluation is an everyday activity; when was the last time you recognized that you can’t do anything alone?

Happy Fourth of July–enjoy your blueberry pie!blueberry pie natural light

A rubric is a way to make criteria (or standards) explicit and it does that in writing so that there can be no misunderstanding.  It is found in many evaluative activities especially assessment of classroom work.  (Misunderstanding is still possible because the English language is often not clear–something I won’t get into today; suffice it to say that a wise woman said words are important–keep that in mind when crafting a rubric.)


This week there were many events that required rubrics. Rubrics may have been implicit; they certainly were not explicit.  Explicit rubrics were needed.


I’ll start with apologies for the political nature of today’s post.

Yesterday’s  activity of the US Senate is an example where a rubric would be valuable.  Gabby  Giffords said it best:  

Certainly, an implicit rubric for this event can be found in this statement:

  Only it was not used.  When there are clear examples of inappropriate behavior; behavior that my daughters’ kindergarten teacher said was mean and not nice, a rubric exists.  Simple rubrics are understood by five year olds (was that behavioir mean OR was that behavior nice).  Obviously 46 senators could only hear the NRA; they didn’t hear that the behavior (school shootings) was mean.

Boston provided us with another example of the mean vs. nice rubric.  Bernstein got the concept of mean vs. nice.

Music is nice; violence is mean.

Helpers are nice; bullying is mean. 

There were lots of rubrics, however implicit, for that event.    The NY Times reported that helpers (my word) ran TOWARD those in need not away from the site of the explosion (violence).   There were many helpers.  A rubric existed, however implicit.

I want to close with another example of a rubric: 

I’m no longer worked up–just determined and for that I need a rubric.  This image may not give me the answer; it does however give me pause.


For more information on assessment and rubrics see: Walvoord, B. E. (2004).  Assessment clear and simple.  San Francisco: Jossey-Bass.


Today’s post is longer than I usually post.  I think it is important because it captures an aspect of data analysis and evaluation use that many of us skip right over:  How to present findings using the tools that are available.  Let me know if this works for you.


Ann Emery blogs at Emery Evaluation.  She challenged readers a couple of weeks ago to reproduce a bubble chart in either Excel or R.  This week she posted the answer.  She has given me permission to share that information with you.  You can look at the complete post at Dataviz Copycat Challenge:  The Answers.


I’ve also copied it here in a shortened format:

“Here’s my how-to guide. At the bottom of this blog post, you can download an Excel file that contains each of the submissions. We each used a slightly different approach, so I encourage you to study the file and see how we manipulated Excel in different ways.

Step 1: Study the chart that you’re trying to reproduce in Excel.

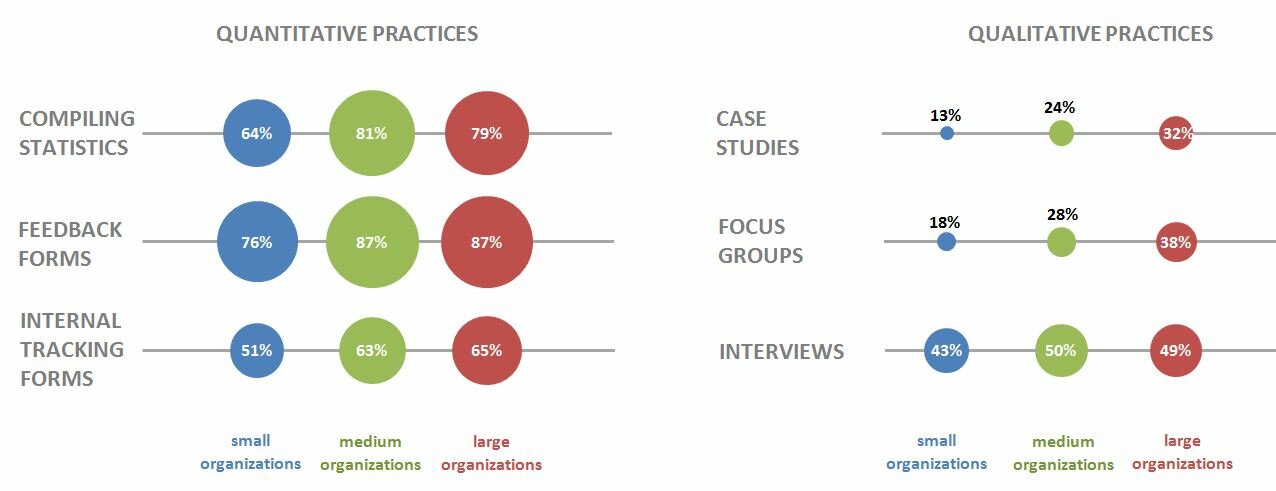
Here’s that chart from page 7 of the State of Evaluation 2012 report. We want to see whether we can re-create the chart in the lower right corner. The visualization uses circles, which means we’re going to create a bubble chart in Excel.

dataviz_challenge_original_chart

Step 2: Learn the basics of making a bubble chart in Excel.

To fool Excel into making circles, we need to create a bubble chart in Excel. Click here for a Microsoft Office tutorial. According to the tutorial, “A bubble chart is a variation of a scatter chart in which the data points are replaced with bubbles. A bubble chart can be used instead of a scatter chart if your data has three data series.”

We’re not creating a true scatter plot or bubble chart because we’re not showing correlations between any variables. Instead, we’re just using the foundation of the bubble chart design – the circles. But, we still need to envision our chart on an x-y axis in order to make the circles.

Step 3: Sketch your bubble chart on an x-y axis.

It helps to sketch this part by hand. I printed page 7 of the report and drew my x and y axes right on top of the chart. For example, 79% of large nonprofit organizations reported that they compile statistics. This bubble would get an x-value of 3 and a y-value of 5.

I didn’t use sequential numbering on my axes. In other words, you’ll notice that my y-axis has values of 1, 3, and 5 instead of 1, 2, and 3. I learned that the formatting seemed to look better when I had a little more space between my bubbles.

dataviz_challenge_x-y_axis_example

Step 4: Fill in your data table in Excel.

Open a new Excel file and start typing in your values. For example, we know that 79% of large nonprofit organizations reported that they compile statistics. This bubble has an x-value of 3, a y-value of 5, and a bubble size of 79%.

Go slowly. Check your work. If you make a typo in this step, your chart will get all wonky.

dataviz_challenge_data_table

Step 5: Insert a bubble chart in Excel.

Highlight the three columns on the right – the x column, the y column, and the frequency column. Don’t highlight the headers themselves (x, y, and bubble size). Click on the “Insert” tab at the top of the screen. Click on “Other Charts” and select a “Bubble Chart.”
dataviz_challenge_insert_chart

You’ll get something that looks like this:
dataviz_challenge_chart_1

Step 6: Add and format the data labels.

First, add the basic data labels. Right-click on one of the bubbles. A drop-down menu will appear. Select “Add Data Labels.” You’ll get something that looks like this:

dataviz_challenge_chart_2

Second, adjust the data labels. Right-click on one of the data labels (not on the bubble). A drop-down menu will appear. Select “Format Data Labels.” A pop-up screen will appear. You need to adjust two things. Under “Label Contains,” select “Bubble Size.” (The default setting on my computer is “Y Value.”) Next, under “Label Position,” select “Center.” (The default setting on my computer is “Right.)

dataviz_challenge_chart_3

Step 7: Format everything else.

Your basic bubble chart is finished! Now, you just need to fiddle with the formatting. This is easier said than done, and probably takes the longest out of all the steps.

Here’s how I formatted my bubble chart:

  • I formatted the axes so that my x-values ranged from 0 to 10 and my y-values ranged from 0 to 6.
  • I inserted separate text boxes for each of the following: the small, medium, and large organizations; the quantitative and qualitative practices; and the type evaluation practice (e.g., compiling statistics, feedback forms, etc.) I also made the text gray instead of black.
  • I increased the font size and used bold font.
  • I changed the color of the bubbles to blue, light green, and red.
  • I made the gridlines gray instead of black, and I inserted a white text box on top of the top and bottom gridlines to hide them from sight.

Your final bubble chart will look something like this:
state_of_evaluation_excel

For more details about formatting charts, check out these tutorials.

Bonus

Click here to download the Excel file that I used to create this bubble chart. Please explore the chart by right-clicking to see how the various components were made. You’ll notice a lot of text boxes on top of each other!”

One of the expectations for the evaluation capacity building program that just finished is that the program findings will be written up for publication in scientific journals.

Easy to say.  Hard to do.

Writing is HARD.

To that end, I’m going to dig out my old notes from when I taught technical writing to graduate students, medical students, residents, and young faculty and give a few highlights.

  1. Writing only happens when words are put on paper (or typed into a computer).  Thinking about writing (I do that a lot) doesn’t count as writing.  The words don’t have to be perfect; good writing happens with multiple revisions.
  2. Schedule time for writing; write it in your planner.  You are making an appointment with yourself and writing.   At 10:00am every MWF I will write for one hour; then stop.  Protect this time.  You protect your program time; you need to protect your writing time.
  3. Keep in mind paper organization.  Generally, the IMRAD structure works for all manuscripts.  IMRAD stands for Introduction; Methods, Results, And Discussion.  Introduction is the literature review and ends with the research question.  Methods section is how the program, experiment, research was conducted in EXCRUCIATING detail.  Another evaluator should be able to pick up your manuscript and replicate your program.  Results are what you discovered, the lessons learned, the what worked and didn’t work.  They are quantitative and/or qualitative.  The Discussion is where you get to speculate; it highlights your conclusions and discusses the implications.  It also ties back to the literature.  If you have done the reporting correctly, you will have gone from the general to the specific back to the general.  Think two triangles placed together with their points (apex) touching.
  4. Follow the five Cs.  This is the single most important piece of advice (after number 2 above) about writing.   The five Cs are  Clarity, Coherence, Conciseness, Correctness, and Consistency.  If you keep those five Cs in mind, you will write well.  The writing is clear–you have not obfuscated the material.  The writing is coherent–it makes sense.  The writing is concise–you do not babble on or use jargon.  The writing is correct–you remember that the word data is a plural noun and takes a plural verb (use proper grammar and syntax).  The writing is consistent–you call your participants the same thing all the way through (no it is not boring).
  5. Start with the section you know best.  That may be what is  most familiar; it may be what is the  most recent; it may be what is the most concrete.  What ever you do, DO NOT start with the abstract; write it last.
  6. Have a style guide on your desk.  Most social sciences use APA; some use MLA or Chicago Style.  Have one (or more) on your desk.  Use it.  Follow and use the style that the journal requires.  That means you have read the “Instructions to authors” somewhere in the publication.
  7. Once you have finished the manuscript, READ IT OUT LOUD TO YOUR SELF.
  8. Run a spell and grammar check on the manuscript–it won’t catch everything; it will only catch most errors.
  9. Have more than one person read the manuscript AFTER you have read it out loud to your self.
  10. Persist.  More than one manuscript has been published because the author has persisted with the journal

Happy writing.

What do I know that they don’t know?
What do they know that I don’t know?
What do all of us need to know that few of us knows?”

These three questions have buzzed around my head for a while in various formats.

When I attend a conference, I wonder.

When I conduct a program, I wonder, again.

When I explore something new, I am reminded that perhaps someone else has been here and wonder, yet again.

Thinking about these questions, I had these ideas

  • I see the first statement relating to capacity building;
  • The second statement  relating to engagement; and
  • The third statement (relating to statements one and two) relating to cultural competence.

After all, aren’t both of these statements (capacity building and engagement)  relating to a “foreign country” and a different culture?

How does all this relate to evaluation?  Read on…

Premise:  Evaluation is an everyday activity.  You evaluate everyday; all the time; you call it making decisions.  Every time you make a decision, you are building capacity in your ability to evaluate.  Sure, some of those decisions may need to be revised.  Sure, some of those decisions may just yield “negative” results.  Even so, you are building capacity.  AND you share that knowledge–with your children (if you have them), with your friends, with your colleagues, with the random shopper in the (grocery) store.  That is building capacity.  Building capacity can be systematic, organized, sequential.  Sometimes formal, scheduled, deliberate.  It is sharing “What do I know that they don’t know (in the hope that they too will know it and use it).

Premise:  Everyone knows something.  In knowing something, evaluation happens–because people made decisions about what is important and what is not.  To really engage (not just outreach which much of Extension does), one needs to “do as” the group that is being engaged.  To do anything else (“doing to” or “doing with”) is simply outreach and little or no knowledge is exchanged.  Doesn’t mean that knowledge isn’t distributed; Extension has been doing that for years.  Just means that the assumption (and you know what assumptions do) is that only the expert can distribute knowledge.  Who is to say that the group (target audience, participants) aren’t expert in at least part of what is being communicated.  Probably are.  It is the idea that … they know something that I don’t know (and I would benefit from knowing).

Premise:  Everything, everyone is connected.  Being prepared is the best way to learn something.  Being prepared by understanding culture (I’m not talking only about the intersection of race and gender; I’m talking about all the stereotypes you carry with you all the time) reinforces connections.  Learning about other cultures (something everyone can do) helps dis-spell stereotypes and mitigate stereotype threats.  And that is an evaluative task.  Think about it.  I think it captures the What do all of us need to know that few of us knows?” question.