Setting up a native plant and native cultivar study

Natives Plants & Native Cultivars Recent studies report an increase in consumer demand for native plants, largely due to their benefits to bees and other pollinators. This interest has provided the nursery industry with an interesting labelling opportunity. If you walk into a large garden center, you find many plant pots labelled as “native” or “pollinator friendly”. Some of these plants include cultivated varieties of wild native plant species, or native cultivars, sometimes referred to as “nativars”. While many studies confirm the value of native plants to pollinators, we do not yet understand if native cultivars provide the same resources to their visitors.
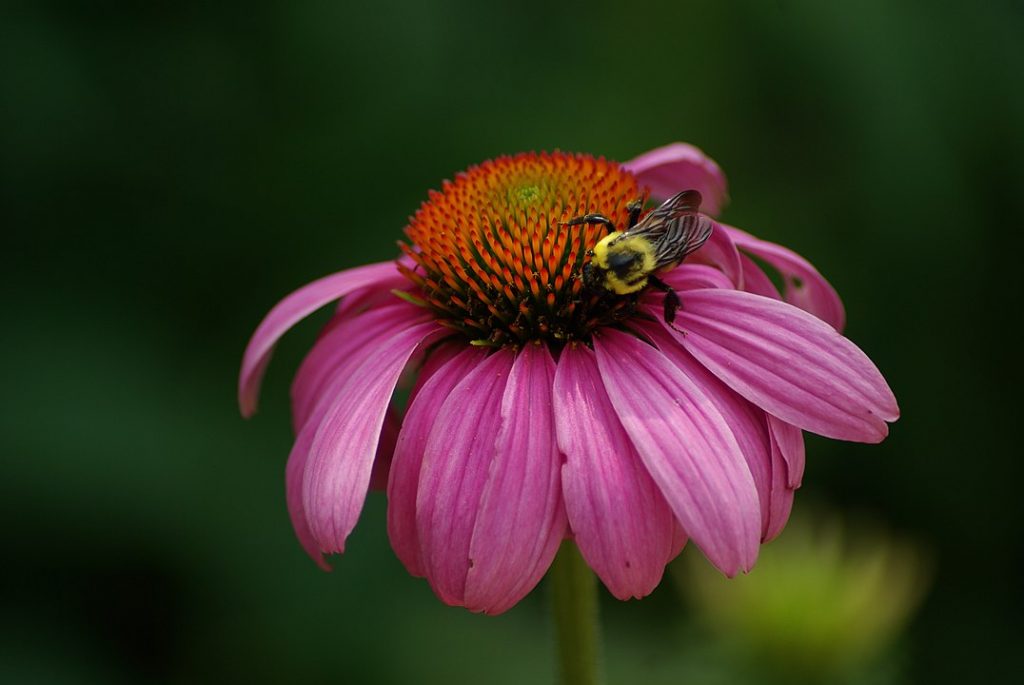
Echinacea purpurea

Photo Source: Moxfyre – Own work, CC BY-SA 3.0,

E. purpurea ‘Maxima’

Photo Source: Ulf Eliasson – Own work, CC BY 2.5,

E. purpurea ‘Secret Passion’

Photo source: National Guarden Bureau

An Echinacea Example Above are three purple cone flower (Echinacea purpurea) plants: on the top is the wild type, in the middle is a native cultivar ‘Maxima’, and on the bottom is another native cultivar ‘Secret Passion’. In some cases, like ‘Secret Passion’s double flower, there is an obvious difference between a native cultivar and a wild type that might make it less attractive to insect visitors. Since we can’t see the disc flowers (the tiny flowers in the center of daisy family plants), we might assume that ‘Secret Passion’ may be more difficult for pollinators to visit. The floral traits displayed by ‘Maxima’ seem similar to the wild type, but it might produce less pollen or nectar, causing bees to pass over it.

Unless we observe pollinator visitation and measure floral traits and nectar, we can’t assume that native plants and native cultivars are equal in their value to pollinators.

Native Cultivar Research One study looking at the difference between native species and their cultivar counterparts has come out of the University of Vermont (my alma mater!). A citizen science effort started by the Chicago Botanic Garden is also currently ongoing. My Master’s thesis will be the first to use a sample of plants specific to the Pacific Northwest. We have selected 8 plants that are native to Oregon’s Willamette Valley and had 1-2 native cultivars available. These plants have shown a range of attractiveness to pollinators (low, medium, or high) based on Aaron’s research. We are including plants with low attractiveness because it’s possible that a native cultivar may have a characteristic that makes it more attractive, such as a larger flower or higher nectar content.

This example of a Randomized Complete Block design shows 2 garden beds containing a native species (California Poppy and Camas) and their cultivar pairs (a yellow poppy cultivar and a white Camas cultivar).

Experimental Design We have four garden beds in our study, and each bed contains at least one planting of each native species and their cultivar counterpart(s). This kind of design is called a “Randomized Complete Block” (RCB). The RCB has two main components: “blocks”, which in our case are garden beds, and “treatments”, which are our different plant species. Above I have drawn a simplified RCB using two of our plants: Camas and California poppy. The bamboo stakes outline each plot and have attached metal tags that label the plants.

We planted our seeds and bulbs in November and will plant out 4″ starts of the other plants in early Spring. Look out for my spring and summer updates to see how these plots progress from mulch and bamboo stakes to four garden beds full of flowers and buzzing insects!

Reference articles: https://www.asla.org/NewsReleaseDetails.aspx?id=53135 http://www.gardenmediagroup.com/garden-media-releases-2019-garden-trends-report

2019 Native Plant Field Season Update

I’m thrilled to announce that this summer I completed the third field season of my study. This is slightly bittersweet – while I’m excited that we are done with hot fieldwork, I will miss chasing bees around the farm and the view of Mt. Hood. I’m incredibly thankful for this third season of data, as it will help account for some of the temporal variation inherent in ecological studies. In fact, pollinator communities in particular tend to be highly variable both within and across field seasons. Having three seasons of data will hopefully allow us to identify more reliable patterns of pollinator visitation between my study plants.

Lots of lab work remains, as I’m tackling the insect samples that we collected with the bee vacuum. With the help of a dissecting scope, I’m attempting to identify the each specimen to at least the taxonomic level of family to get a sense of the broader insect communities associated with each flower species in my study. It will be several months before I can share this species-richness data, but in the meantime I have bee abundance data to share with you!

Aaron and Lucas in the native plant study site, in 2017. You can see the 1m by 1 m plot in the foreground by Aaron, a second one near Lucas, and a few more in the distance.

As a refresher, we performed timed pollinator observations at each plot. This consisted of observing each blooming plot for five minutes and counting all the insects that landed on open flowers. Bees were sorted to “morpho-type” (honey bee, bumblebee, green bee, and other native bee). Though this doesn’t give us species-level information on the floral visitors, it allows us to understand which plants attracted the most pollinators overall, and allows us to detect any patterns of visitation between honey bees, bumblebees, and solitary native bees. Below is a summary of some of the highlights.

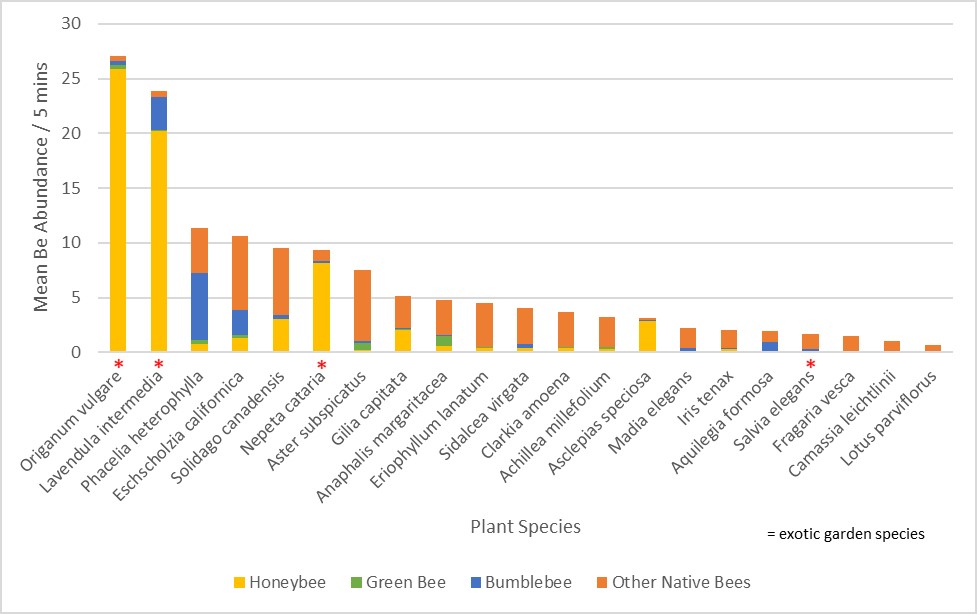
2019 overall bee abundance by plant species:

  • Origanum vulgare, Lavendula intermedia, and Eschscolzia californica were top five bee plants in 2019, just as they were in 2018.
  • In 2019, Phacelia heterophylla and Solidago canadensis jump into the top five, while Nepeta cataria and Gilia capitata fall out of the top five. It should be noted that Nepeta was the sixth most attractive plant, with about the same visitation level as Solidago.
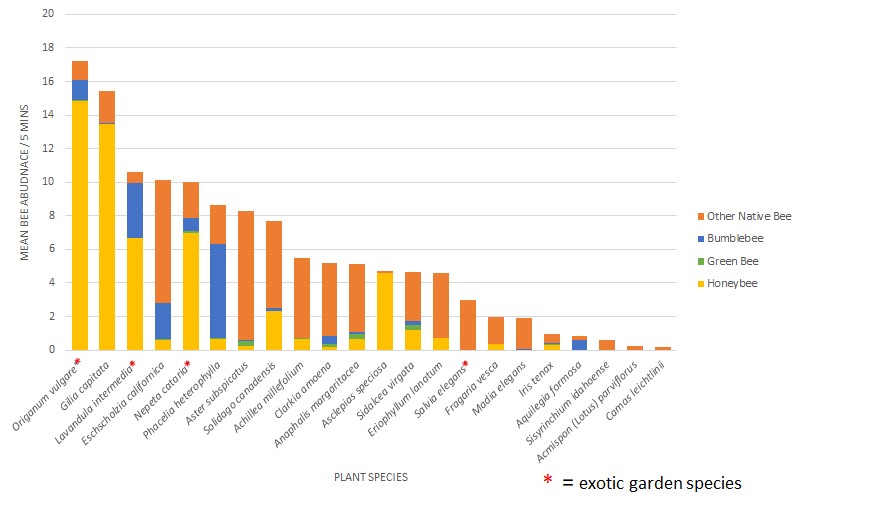
  • Again, similar to 2018, it appears that honey bee visitation was driving the high visitation rates of the popular exotic garden species (marked with a red asterisk), while native wildflowers were being visited more frequently by native bees.
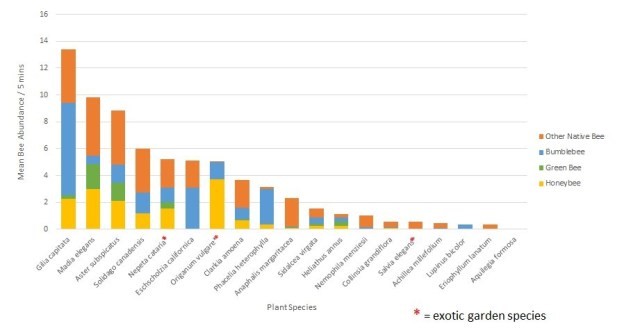
  • I’ve included the 2017 and 2018 overall abundance graphs as well, for comparison. You can see that the overall abundance was higher in 2019 for the two most popular plants, at about ~25 bees per observation period!

2017 overall bee abundance by plant species:

2018 overall bee abundance by plant species:

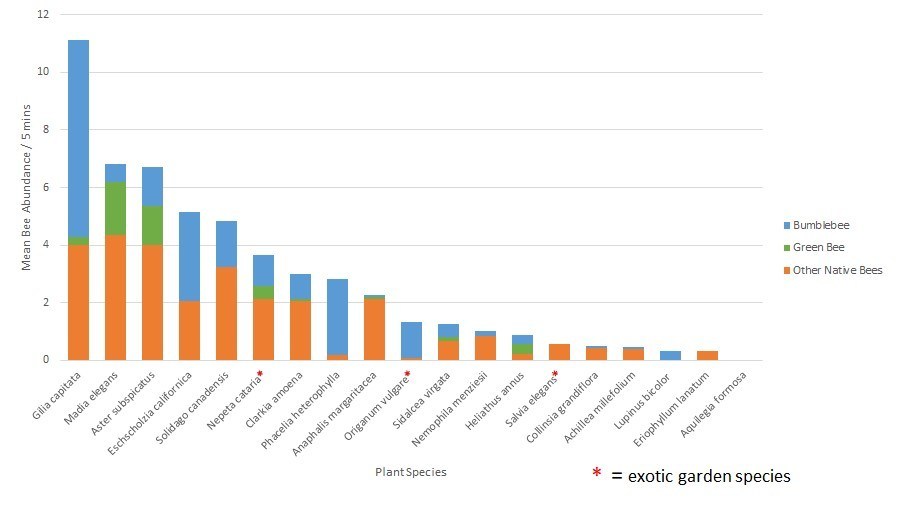
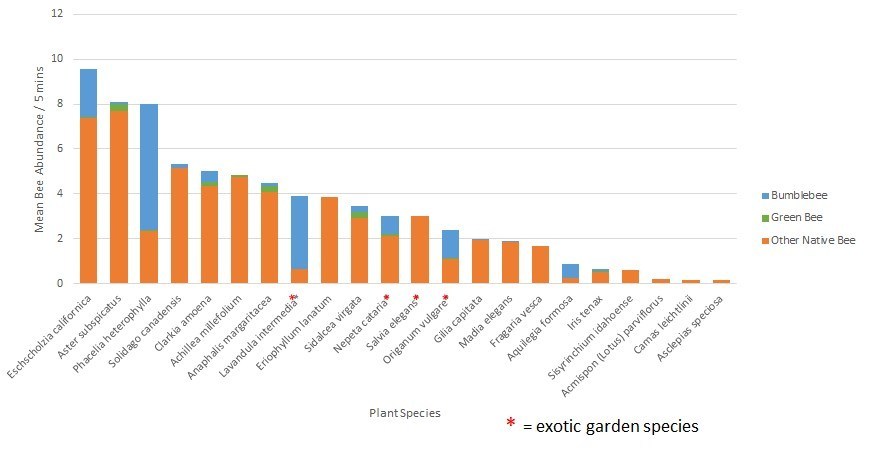
Since honey bee visitation drove the high abundance of many of the top pollinator plants, I took honey bee visits out of the data set and made a new graph, to compare which plants were most attractive to native bees.

2019 native bee abundance by plant species:

As you can see above, honey bees are excluded from the analysis, the top five most popular plant species completely reshuffles.

I’ve included that 2017 and 2018 native bee abundance data below for comparison.

2017 native bee abundance by plant species:

2018 native bee abundance by plant species:

Please stay tuned for more updates on the bee species richness we collected in 2019, as well as data on the other insects (pests and natural enemies) that we collected!