Over the past year CQLS moved HPC users to the new Wildwood HPC. This new HPC included significant upgrades to management servers, operating systems, queuing software (SLURM), ONID authentication, a larger all-access queue (all.q), and custom job submission software (hpcman). Since this transition the CQLS has been working with the other HPC groups on campus to create a consolidated campus-wide HPC and provide unified HPC experience to users, and accessible research computing across OSU.
The College of Earth, Ocean and Atmospheric Sciences (CEOAS) has completed consolidation of users and HPC resources into the Wildwood HPC. The CQLS and CEOAS HPC clusters now share login and management servers, storage, and all.q. The CQLS is currently working with Advanced Research Computing Services (ARCS) and the College of Engineering (COE) to join their HPC clusters with the Wildwood HPC.
The Wildwood HPC has grown in computing capacity and storage. There are approximately 8000 CPUs and 65 GPUs available on the all.q and in priority queues. The all-access queue, all.q, has 480 CPUs and also has an available GPU queue and continues to grow as we intake more users. The Wildwood HPC has 12.3PB of network-attached storage.
The CQLS has also rebuilt the Advanced Cyberinfrastructure Teaching Facility (ACTF), an HPC teaching cluster. The ACTF HPC mimics the Wildwood HPC but has special class-specific resources and areas for students and instructors to work together. Instructors are able to teach linux-based programming and analysis classes and access student directories to check assignments. Please contact us if you are interested in utilizing this resource.
HPC upgrades and changes have necessitated downtimes of servers and storage and we appreciate user’s patience and flexibility for as we continue to make improvements. OSU is decommissioning the Kerr Administration server room where the Wildwood storage servers reside. We are helping the University to vacate the Kerr server room by moving Wildwood HPC storage to a new location in Burt Hall.
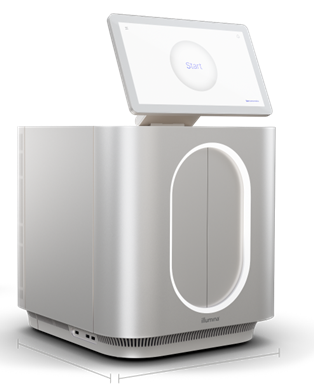
The CQLS was awarded a 2025 Research Equipment Reserve Fund (RERF) to purchase a new Illumina MiSeq i100.
The CQLS has run an Illumina MiSeq for 12 years as the center of a highly successful low-range sequencing service. Primarily used for microbiome, environmental, and amplicon samples, the MiSeq offers a lower volume of Illumina high-throughput sequencing compared to the CQLS’ Illumina NextSeq. Illumina is transitioning the original MiSeq to end-of-life service. By upgrading to the new MiSeq i100, the CQLS will replicate our current sequencing abilities while drastically reducing instrument maintenance costs for the CQLS and consumable costs for OSU researchers.
The Illumina MiSeq i100 is a next-generation sequencer that sequences low-volume flow cells, 5 Million sequences in 300 or 600 base-pair lengths or 25 Million sequences in 100, 300, or 600 base-pair lengths. The MiSeq i100 is quicker and cheaper to run than other short-read sequencers.
Key features include:
Cost efficiency: Cost-effective consumables enable more affordable sequencing
Speed: Dramatic reduction in run times: as fast as four hours, with same-day results (4× faster than MiSeq)
Room-temperature shipping and storage for reagents: Allowing for greater flexibility to sequence on demand without the need to thaw reagents
Simplicity: Simpler, streamlined operations for various levels of sequencing experience
The new MiSeq i100 is upgraded from the original MiSeq in several ways. Flow cells are lower-cost and higher volume so researchers will be able to obtain more sequence at a lower price. The small volume sequencing (1M) of the original MiSeq is no longer offered but researchers will be able to sequence higher volume runs at a lower or similar price. Running the instrument is also more streamlined: run times are 4x faster; many reagents and consumables are now stored in room temperature; the instrument is simpler to maintain resulting in a lower yearly service contract price.
Bing Wang, CQLS; Marco Corrales Ugalde HMSC; Elena Conser HMSC
By leveraging the scalability and parallelization of high-performance computing (HPC), CQLS and CEOAS Research Computing, collaborated with PhD student Elena Conser and postdoctoral research scholar Marco Corrales Ugalde from Hatfield Marine Science Center’s (HMSC) Plankton Ecology Laboratory to complete the end-to-end processing of 128 TB of plankton image data collected during Winter and Summer of 2022 and 2023 along the Pacific Northwest coast of the United States (Figure 1a) .The workflow, which encompassed image segmentation, training library development, and custom convolutional neural network (CNN) model training, produced taxonomic classification and size data for 11.2 billion plankton and particle images. Processing was performed on the CQLS and CEOAS HPC and Pittsburgh Supercomputing Center Bridges-2, consuming over 40,000 GPU hours and 3 million CPU hours. CQLS and CEOAS Research Computing provided essential high-performance computing resources, such as NVIDIA Hopper GPUs, IBM PowerPC system, and multi-terabyte NFS storage. In addition, these computing centers contributed with software development that expedited the processing of images through our pipeline, such as custom web applications for image visualization and annotation, and automated, high-throughput pipelines for segmentation, classification, and model training.
Project introduction
Plankton (meaning “wanderer,” in Greek) are composed of a diverse community of single-celled and multicellular organisms, comprising an extensive size range from less than 0.1 micrometers to several meters. Planktonic organisms also vary extensively in their taxonomy, from bacteria and protists to the early life stages of fishes and crustaceans. The distribution and composition of this diverse “drifting” community is determined in part by the ocean’s currents and chemistry. Marine plankton form the foundation of oceanic food webs and play a vital role in sustaining key ecosystem services, such as climate regulation via the fixation of atmospheric CO2, the deposition of organic matter to the ocean’s floor, and by the production of biomass at lower levels of the food chain, which sustains global fisheries productivity. Thus, understanding plankton communities is critical for forecasting the impacts of climate change on marine ecosystems and evaluating how these changes may affect climate and global food security.
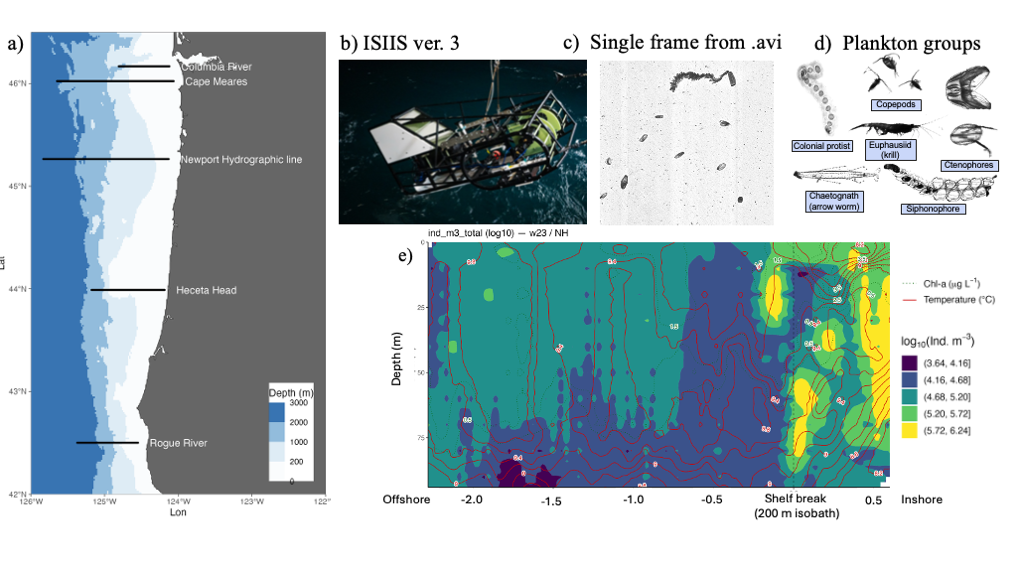
Figure 1. Plankton imagery was collected along several latitudinal transects through the Pacific Northwest coast (a), by the In-situ Ichthyoplankton Imaging System (ISIIS) (b). This data is split into frames (c) and then individual plankton and particle images (d). The high image capture rate (20 frames/second) along a large spatial range allows to provide a detailed description of plankton abundance patterns (colors in panel e) and their relation to oceanographic features (Chlorophyll concentration, dotted isolines, and Temperature, red isolines).
HMCS’s Plankton Ecology Lab, in collaboration with Bellamare engineering, has been the lead developer of the In-situ Ichthyoplankton Imaging System (ISIIS), a state-of-the-art underwater imaging system (Figure 1b) that captures in situ, real-time images of marine plankton (Figures 1c-d). It utilizes a high-resolution line-scanning camera and shadowgraph imaging technology, enabling imaging of up to 162 liters of water per second with a pixel resolution of 55 µm, and detecting particles ranging from 1 mm to 13 cm in size. In addition, ISIIS is outfitted with oceanographic sensors that measure depth, oxygen, salinity, temperature, and other water characteristics. ISIIS is towed behind a research vessel during field deployments. In a single day, a vessel may cover 100 miles while towing ISIIS. ISIIS collects imagery data at a rate of about 10 GB per minute with its paired camera system. A typical two-week deployment produces datasets containing more than one billion particles and approximately 160 hours of imagery, resulting in over 35 TB of raw data. This unprecedented volume of data, together with its high spatial resolution and simultaneous sampling of the environmental context (Figure 1e) allows to address questions of how mesoscale and submesoscale oceanography determine plankton distribution and food web interactions.
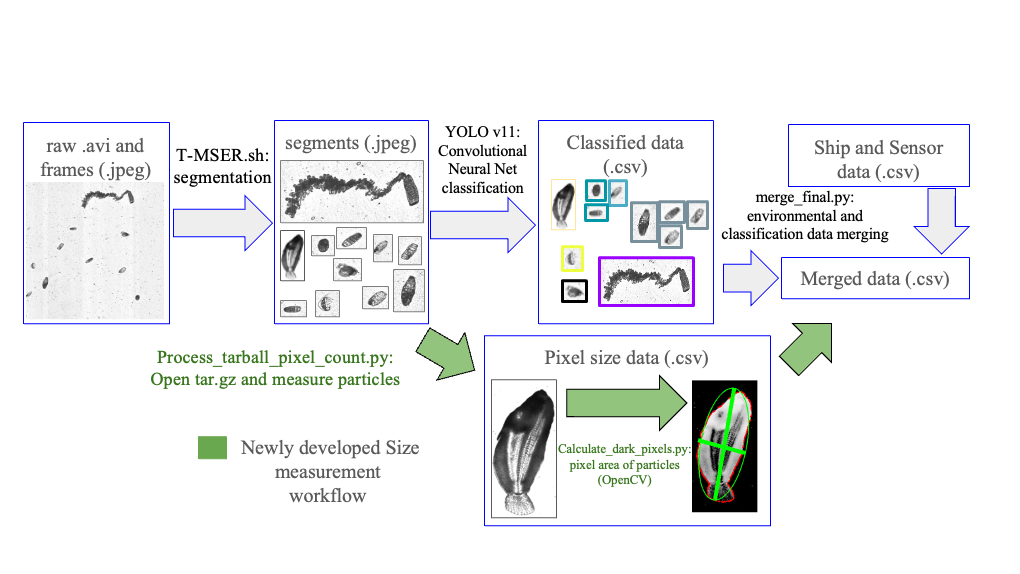
Processing this vast amount of data is complex and highly demanding on computing resources. To address this challenge, CQLS and CEOAS Research Computing developed a comprehensive workflow encompassing image segmentation, training library construction, CNN model development, and large-scale image classification and particle size calculation. In the first step, raw imagery is segmented into smaller regions containing regions of interest. These regions are subsequently classified using a CNN based model (Figure 2). In earlier work, a custom sparse CNN model was developed for classification, but thanks to significant advances in computer vision, more efficient models such as YOLO (“You Only Look Once”) have been developed. To train a new YOLO plankton model, a training library of 72,000 images across 185 classes was constructed. Additionally, a test library of 360,000 images was curated to verify model accuracy and ensure robust performance. This improved workflow was applied to 128 TB of ISIIS video data, enabling the classification and size measurement of 11.2 billion images.
Figure 2. Data processing workflow from raw video to training library development, model training, and plankton classification and particle size estimation
Hardware and software support from CQLS and CEOAS research computing
CQLS and CEOAS Research Computing provide high-performance computing resources for research and is accessible to all OSU research programs. The HPC has a capacity of 9PB for data storage, 45TB of memory, 6500 processing CPUs, and 80+ GPUs. The CQLS and CEOAS HPC can handle more than 20,000 submitted jobs per day.
1. GPU resources
Multiple generations of NVIDIA GPUs are available across architectures on the CQLS and CEOAS HPC, including Tesla V100, Grace Hopper, GTX 1080, and A100, with memory capacities ranging from 11 GB to 480 GB as listed below. GPUs are indispensable for image processing and artificial intelligence, delivering orders of magnitude faster performance than CPUs.
In this project, GPU resources were employed to train YOLO models and to perform classification and particle size estimation of billions of plankton images.
cqls-gpu1 (5 Tesla V100 32GB GPUs), x86 platform
cqls-gpu3 (4 Tesla T4 16GB GPUs), x86 platform
cqls-p9-1 (2 Tesla V100 16GB GPUs), PowerPC platform
cqls-p9-2 (4 Tesla V100 32GB GPUs), PowerPC platform
cqls-p9-3 (4 Tesla V100 16GB GPUs), PowerPC platform
cqls-p9-4 (4 Tesla V100 16GB GPUs), PowerPC platform
ayaya01 (8 GeForce GTX 1080 Ti 11GB GPUs), x86 platform
ayaya02 (8 GeForce GTX 1080 Ti 11GB GPUs), x86 platform
coe-gh01, grace NVIDIA GH200s, 480 GB memory, ARM platform
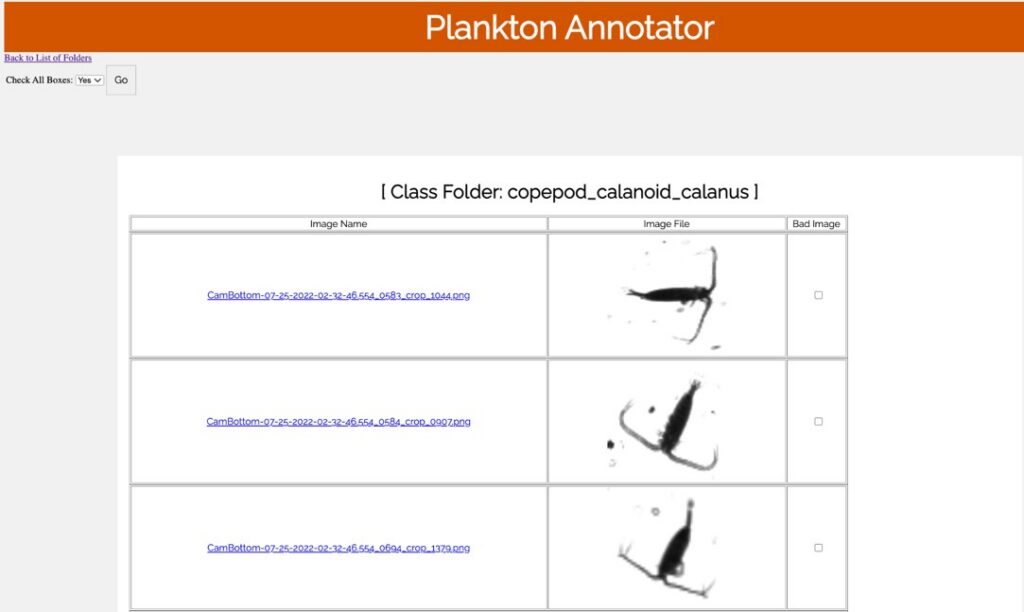
Plankton Annotator (Figure 3) is a web application developed by Christopher M. Sullivan, Director of CEOAS Research Computing. The tool provides an intuitive platform for the visualization and annotation of plankton imagery. The CQLS and CEOAS Research Computing has the capacity for developing and hosting various web applications. In this project, the Plankton annotator was used to efficiently visualize and annotate plankton images, supporting the creation of reliable training library for downstream YOLO models training.
Figure 3. Plankton annotator web application
4. Pipeline developments
CQLS and CEOAS Research Computing has a team of consultants with various programming expertise such as Shell, Python, R, JavaScript, SQL, PHP, and C++. They are available to collaborate on grant proposals, project discussions, experimental design, pipeline development, and data analysis for a wide range of projects in bioinformatics and data science. For this project a series of automated, high-throughput pipelines were updated and created to support image segmentation, model training, species classification and particle size estimation. These pipelines were designed to handle large volumes of data efficiently, ensuring scalability, and reproducibility.
5. Storage
In this project, CQLS and CEOAS HPC provided more than 200 TB of centralized NFS storage to accommodate both raw and processed data. This shared storage infrastructure ensures reliable data access, supports efficient file sharing across the HPC environment, and enables seamless collaboration among researchers.
References
Conser, E. & Corrales Ugalde, M., 2025. The use of high-performance computing in the processing and management of large plankton imaging datasets. [Seminar presentation] Plankton Ecology Laboratory, Hatfield Marine Science Center, Oregon State University, Newport, OR, 19 February.
Schmid, M.S., Daprano, D., Jacobson, K.M., Sullivan, C., Briseño-Avena, C., Luo, J.Y. & Cowen, R.K., 2021. A convolutional neural network based high-throughput image classification pipeline: code and documentation to process plankton underwater imagery using local HPC infrastructure and NSF’s XSEDE. National Aeronautics and Space Administration, Belmont Forum, Extreme Science and Engineering Discovery Environment, vol. 10.
Oregon State University, 2025. Oregon State University Research HPC Documentation. Viewed 18 September 2025, https://docs.hpc.oregonstate.edu.
Sherlock Secure Cloud for Sensitive Research Data Now Available
Researchers conducting research using and analyzing health data often require access to sensitive data such as personally identifiable information (PII), protected health information (PHI), and other controlled unclassified information (CUI). Now after working collaboratively with the Office of Information Security (OIS), University Information Technology (UIT) and the Advanced Research Computing Services (ARCS), OSU researchers have access to a secure cloud environment, known as Sherlock Secure Cloud, for use on a fee basis.
Sherlock Secure Cloud is versatile and customizable for project needs. Customization that covers data collection to analysis and collaboration with others, is possible, all on a fee basis. For example, research that requires collection of sensitive data, using REDCap (Research Electronic Data Capture), is possible, as well a variety of statistical analyses tools can be installed. Project spaces are unique to the approved research team members.
Sherlock Cloud provides a managed multi-Cloud solution that complies with Federal Information Security Management Act (FISMA), Health Insurance Portability and Accountability Act (HIPAA) and NIST CUI requirements. Sherlock Cloud recently achieved a successful SOC2 Type2 certification and follows the NIST 800-53 (Mod) framework that spans over 200 technical, security and administrative controls. These security features are in line with those required for the most common research data use agreements.
CQLS staff coordinate with the ARCS team for access and set up. Researchers may contact CQLS HDI staff to ask about the suitability of Sherlock Secure Cloud and for planning health data and informatics research.
Centralized Local REDCap Software for Data Collection Now Available
For researchers who may not require secure cloud computing, but plan to collect data may now access REDCap on a centralized local OSU server managed by CQLS. REDCap provides features not available in other data management systems including support for large-scale longitudinal studies. CQLS offers free OSU-specific training resources in addition to the REDCap Consortium resources for REDCap users. Use of REDCap locally for research projects is available on a fee-basis. Researchers should review materials on the CQLS website and contact CQLS to set up REDCap accounts for their research teams and to consult on their data management plans.
The CQLS has experienced significant change in the last few years. Throughout this we have increased CQLS staffing, developed new research collaborations, and continued CQLS services without interruption. As we move forward the CQLS will be increasing community outreach and events including restarting the Fall Conference (November 22nd) and working with faculty committees and our users and community to direct the future of the CQLS.
The CQLS is composed of four interconnected functional groups:
CQLS Core Laboratory – Four laboratory staff run the services provided in Genomics Core, Shared Instrumentation Core, and Microscopy Core. Recently the laboratory has been working with the Division of Research and Innovation to move CQLS into the new RELMS instrument billing system.
CQLS Research Computing HPC – Two CQLS staff run and maintain the CQLS HPC, the largest and most widely used computing cluster at OSU. Recent upgrades outlined in this newsletter combine the CQLS HPC with other OSU HPC to create a consolidated OSU research computing cluster.
CQLS Bioinformatics and Data Science – Six CQLS staff consult on computational research and teach our computing and bioinformatics courses. CQLS scientists consult on experimental design, grant proposals, research, and programming projects and are highly utilized in many labs across OSU.
CQLS Health Data Informatics – Led by Denise Hynes, the CQLS provides support and tools for analyzing health data including protected and secure data.
In this newsletter you will find information on CQLS changes and new services, research projects in the CQLS, spotlight on CQLS service, and information on upcoming CQLS events.
After over a year of planning and hard work, CQLS is completing the upgrade of its entire high-performance computing (HPC) infrastructure to create a consolidated campus-wide HPC and provide accessible research computing across OSU.
The old GENOME cluster is being upgraded and replaced by an improved infrastructure with new features and across-the-board updates. These upgrades include new operating systems, Rocky 9 or Ubuntu 22, many software package updates, and improved resource management.
The Wildwood cluster uses SLURM as its primary job queueing system, which provides priority queuing and GPU-aware resource management. Wildwood also has SGE job management, to support those who rely on the SGE work flow for their analysis. To support multiple job management tools, we have also developed a suite of new tools (hpcman) that allow users to submit jobs and manage their work on SLURM or SGE with a unified command set.
One of the other big improvements in Wildwood is that we can now use ONID authentication – users no longer have to maintain a separate CQLS password, they can log in using their ONID password.
Wildwood is also a federated cluster – Wildwood connects to COEAS computing resources, and will soon also connect to the COE HPC. A single log in will allow users to run jobs and manage their data on any of these clusters, and shared storage provides a unified interface to research data.
The CQLS Wildwood HPC contains 9PB of data storage, ~6500 processing CPUs, and 80+ GPUs.
Labs and departments have been making the transition to Wildwood through the summer, but Wildwood also has an expanded ‘all.q’ – general access resources anyone can use, including GPUs and PowerPC architecture machine.
CQLS has installed a new Leica Stellaris 5 Confocal Microscope System which replaces an older confocal system. With this type of microscope one can obtain 3D sectioning of fluorescently labeled cells, or tissues for clearer, sharper images of specimens. People have used confocal systems to examine structures within living or fixed cells and to examine the dynamics of cellular processes.
3D rendering of veins in maize leaves. Yellow: Pin1a-YFP in cell membrane, Red: DR5-RFP in endoplasmic reticulum. Image courtesy of Camila Medina.
A confocal system has the capacity to image in Z and time to better visualize location in 3D than widefield fluorescence microscope by using a pinhole to eliminate out of focus light. The system has a white light laser (WLL) with tunable excitations from 485 nm up to 685 nm in addition to a 405 nm laser and sensitive HyD S detectors with a detection range from 410 to 850 nm. Additionally, the Stellaris system also has TauSense, a set of tools based on fluorescence lifetime information with potential to eliminate autofluorescence, and LIGHTNING which expands the extraction of image details for both classical imaging range and beyond the diffraction limit (120nm).
We will be offering free training and imaging time during this fiscal year to those people who have a project ready for imaging and in order to help with grant writing for future imaging projects. Contact Anne-Marie Girard to discuss potential projects or for more information about the system or its capacities.
The Division of Research and Innovation is combining Center and Institute facility ordering systems into RELMS (https://research.oregonstate.edu/relms) to streamline user management, ordering and billing, instrument usage, and equipment calendar reservations. The CQLS is beginning to transfer our weborder system into RELMS.
The CQLS will create 3 separate RELMS sites, each containing multiple CQLS services:
CQLS Shared Instrumentation and Microscopy
CQLS Genomics Core
CQLS HPC, Research Consulting, and Training
We will move services individually as we transition to RELMS. A service that has transitioned to RELMS will not be available in CQLS weborder. When a service moves we will notify users via the CQLS-Community email list and with a notification on the weborder site. Once a service has moved you will need to create a RELMS account to order this service.
Effective September the following services will be moved to RELMS:
Extractions (DNA and RNA)
Genotyping by Sequencing (GBS)
Effective October the following additional CQLS services will move to RELMS:
Illumina Sequencing (MiSeq and NextSeq)
Sample preparations
Bioanalyzer
DNA size selection
PacBio Sequencing
TapeStation
Bioinformatics Consulting
Effective November the following services will be moved to RELMS:
Thank you again for your patience and support as we transition to RELMS. If you need assistance please contact the CQLS, visit the RELMS website (https://research.oregonstate.edu/relms), or email RELMS staff directly (relms@oregonstate.edu).
Our BluePippin instrument is used for DNA size selection. Several genomic applications benefit from collecting only DNA fragments within a specified size range from a pool of DNA. This service is often used before Illumina sequencing to remove undesired PCR peaks or before long read sequencing to increase the proportion of fragments greater than a given length in a library.
Using pulsed-field electrophoresis on pre-cast gel cassettes, a DNA sample is separated and fragments within the target range are eluted into buffer. Each cassette can run up to 5 samples at once. Up to 5 ug of DNA can be loaded into each well.
The following cassettes are available at CQLS:
3% agarose, 100-250bp
2% agarose, 100-600bp
1.5% agarose, 250bp – 1.5kb
0.75% agarose, 1-50kb
The desired size range must lie within the total size range capability of the cassette. For example, between 200-350 bp on a 2% agarose cassette would be an acceptable range.
The expected collection yield of target sizes is approximately 50-80% based on product validation studies. Yield can vary greatly depending on the desired range and input fragment sizes.
Before and after size selection of Illumina sequencing library to remove undesired peak at approx. 300 bp
Contact Katie Carter for inquiries about this service.
In a collaboration between the Tom Sharpton and Steve Giovannoni labs in the microbiology department, graduate student Seb Singleton designed and performed a study to examine degradation of, and the communities that form biofilms on, plastics in the ocean. Plastic waste accumulation in marine environments is a growing problem that has global effects on the macro and micro scales. In order to understand the ecology surrounding plastic-colonizing bacteria in marine environments, Seb designed a 3 month-long study to examine the changes in biofilm communities as well as structural and chemical changes in the polymer surfaces on high density polyethylene (HDPE), low density polyethylene (LDPE), and polypropylene (PP). An overview of the study design is shown below in Figure 1 from the paper.
Figure 1. Summarized experimental workflow: sample collection (biweekly over 3 months) to downstream analysis [cultivation, 16S (V4) sequence analysis, ATR-FTIR spectral analysis and HIM imaging].
The CQLS, including sequencing using the MiSeq platform in the core lab, as well as bioinformatics consulting done by senior bioinformatics scientist Ed Davis, was integral to the successful outcome of this study. The study encountered several technical roadblocks that were overcome using novel analytical techniques that leveraged the CQLS compute infrastructure. Here is a brief summary of the findings and difficulties overcome:
Initial Dominance: Common marine microbial families such as Alteromonadaceae, Marinomonadaceae, and Vibrionaceae were initially prevalent.
Community Shift: A significant transition in microbial composition occurred between days 42 and 56, with Hyphomonadaceae and Rhodobacteraceae becoming more dominant. These community shifts also coincided with the passing of Tropical Storm Henri!
Rare Taxa: 8,641 colonizing taxa (Amplicon Sequence Variants; ASVs) were identified in total, with 594 overall ASVs enriched on one or more polymer types vs. the glass control, and only 25 ASVs, including known hydrocarbon degraders, significantly enriched on specific plastics.
Plastic types differ in the ‘rare’ taxa they recruit: Five were specifically enriched on HDPE, nine on LDPE, and eleven on PP.
Taxonomic Assignment Difficulties: Of the 594 significant ASVs, many were unable to be classified to lower taxonomic levels using a classifier trained on the Silva database (i.e. Family and/or Genus level). An alternative classification scheme, called Cladal Taxonomic Annotation (CTA), provided additional taxonomic assignments to 171 (29%) of the significantly enriched ASVs. Most importantly, 8 of the 25 plastic-specific significantly enriched ASVs were better assigned after the CTA.
The shift in taxa over the study period are shown below in Figure 5 from the study:
Figure 5. Gradual temporal shift in a/b diversity shared among material colonizing communities. The Shannon alpha diversity plot (A), Bray-Curtis PCoA (MDS) ordination (B), and Relative abundance stacked bar chart (C) showcase the transition in community complexity and inter-, intra-group similarity over time. In plot (A), alpha diversity measures of the substrate attached communities sharply increases following the mid-experimental transition (between days 42 and 56). Plot (B) explores the compositional dissimilarity of the microbial communities (9,069 unique ASVs) present on the plastics, glass and seawater over the incubation period based on a Bray-Curtis distance matrix. Plot (C) shows the community composition of the top 5% taxa present in each substrate type throughout the incubation period.
Taxa enriched on one or more plastics throughout the study are shown below in Figure 7 from the paper:
Figure 7. Polymer enriched marine taxa. The Log2foldchange plot showcases NBC classified ASVs that were significantly enriched (adjusted p-value ≤ 0.05) on either one or more polymer types throughout the incubation. The color, size and shape of the data points are associated with the enriched taxon’s class, mean abundance, and substrate preference, respectively. Mean abundance is the average of the sequence depth normalized count values for all included samples, whereas Log2FoldChange is the effect size estimate. All ASVs listed possess >3 log fold differences in abundance compared to glass. Day 42 (and 56 for HDPE) Log2FoldChange data were not included due to loss of sample replicates at the time point, similar rationale was used for Day 14 for all three polymers in respect to the loss of glass control biological replicates.
Degradation of plastics was confirmed using high resolution helium ion microscropy (HIM), and relevant examples are shown below from Figure 4 of the paper:
Figure 4. Post incubation biodegradation artifacts. HIM images of 77-day incubated polyolefins with biofilm removed in contrast to unexposed controls to exhibit artifacts of biodegradation by colonizing taxa. Marine-incubated LDPE (A) (1–4), HDPE (B) (1–2) and PP (C) (1–2). Unexposed polyolefins: LDPE (A), HDPE (B) and PP (C).
This research highlights the complex interactions between microbes and plastic surfaces in marine environments, offering insights into the ecological impact of plastic pollution.