Over the past year CQLS moved HPC users to the new Wildwood HPC. This new HPC included significant upgrades to management servers, operating systems, queuing software (SLURM), ONID authentication, a larger all-access queue (all.q), and custom job submission software (hpcman). Since this transition the CQLS has been working with the other HPC groups on campus to create a consolidated campus-wide HPC and provide unified HPC experience to users, and accessible research computing across OSU.
The College of Earth, Ocean and Atmospheric Sciences (CEOAS) has completed consolidation of users and HPC resources into the Wildwood HPC. The CQLS and CEOAS HPC clusters now share login and management servers, storage, and all.q. The CQLS is currently working with Advanced Research Computing Services (ARCS) and the College of Engineering (COE) to join their HPC clusters with the Wildwood HPC.
The Wildwood HPC has grown in computing capacity and storage. There are approximately 8000 CPUs and 65 GPUs available on the all.q and in priority queues. The all-access queue, all.q, has 480 CPUs and also has an available GPU queue and continues to grow as we intake more users. The Wildwood HPC has 12.3PB of network-attached storage.
The CQLS has also rebuilt the Advanced Cyberinfrastructure Teaching Facility (ACTF), an HPC teaching cluster. The ACTF HPC mimics the Wildwood HPC but has special class-specific resources and areas for students and instructors to work together. Instructors are able to teach linux-based programming and analysis classes and access student directories to check assignments. Please contact us if you are interested in utilizing this resource.
HPC upgrades and changes have necessitated downtimes of servers and storage and we appreciate user’s patience and flexibility for as we continue to make improvements. OSU is decommissioning the Kerr Administration server room where the Wildwood storage servers reside. We are helping the University to vacate the Kerr server room by moving Wildwood HPC storage to a new location in Burt Hall.
After over a year of planning and hard work, CQLS is completing the upgrade of its entire high-performance computing (HPC) infrastructure to create a consolidated campus-wide HPC and provide accessible research computing across OSU.
The old GENOME cluster is being upgraded and replaced by an improved infrastructure with new features and across-the-board updates. These upgrades include new operating systems, Rocky 9 or Ubuntu 22, many software package updates, and improved resource management.
The Wildwood cluster uses SLURM as its primary job queueing system, which provides priority queuing and GPU-aware resource management. Wildwood also has SGE job management, to support those who rely on the SGE work flow for their analysis. To support multiple job management tools, we have also developed a suite of new tools (hpcman) that allow users to submit jobs and manage their work on SLURM or SGE with a unified command set.
One of the other big improvements in Wildwood is that we can now use ONID authentication – users no longer have to maintain a separate CQLS password, they can log in using their ONID password.
Wildwood is also a federated cluster – Wildwood connects to COEAS computing resources, and will soon also connect to the COE HPC. A single log in will allow users to run jobs and manage their data on any of these clusters, and shared storage provides a unified interface to research data.
The CQLS Wildwood HPC contains 9PB of data storage, ~6500 processing CPUs, and 80+ GPUs.
Labs and departments have been making the transition to Wildwood through the summer, but Wildwood also has an expanded ‘all.q’ – general access resources anyone can use, including GPUs and PowerPC architecture machine.
Chris Sullivan, the CQLS Assistant Director of Biocomputing, has accepted a new position within OSU’s College of Earth Ocean and Atmospheric Sciences. While we are sad to see him leave, his new position provides exciting new opportunities for him, and continues a long relationship he has had with the computing activities of CEOAS. Please join us in congratulating Chris in his new position within OSU.
Chris has been an integral part of CQLS (originally CGRB) since 1999. Under his guidance the high-performance computing resources in the CQLS have grown from a few computing servers to greater than 7000 processors with more than 7 petabytes of storage and serving more than 20 departments across the University. Chris has had great success developing bleeding edge computing research for the CQLS and the University. He has also been phenomenal in his success at obtaining equipment grants from the likes of IBM and OpenPOWER.
Chris will remain with the CQLS at half time for the next three months to enable a smooth transition. He remains committed to the ongoing success of CQLS and to OSU. To ensure there are no interruptions in service the CQLS will fill an interim position to manage this transition before launching a full Assistant Director search in the New Year.
Again, please join us in congratulating Chris. We will miss him, but we know that he’s just across campus.
Another great term of the CGRB’s Bioinformatics User Group (BUG) is in the books!
This term we had a wide range of presenters—graduate students to Principle Investigators. It was nice to get the perspective of folks who are in different parts of their careers.
A special thanks to all of our presenters:
Sept 25: Christopher Sullivan and Ken Lett (Center for Genome Research & Biocomputing)
Title: CGRB’s new DFS for one and all!, i.e., Don’t know what a Distributed File System is? Come find out!
Abstract: The CGRB works with researchers to provide the most robust computational infrastructure available today. Many group rely on file services at the heart of their research computing needs and the CGRB has worked for over 2 decades to provide redundant high speed file services. Over the years users have grown to expect the best solution at a very cheap price. Because of this model the CGRB spends a great deal of time evaluating the available systems to ensure we always have the best at the lowest price. In the past year the CGRB has worked to evaluate and purchase new file service hardware that will replace our existing setups. We will be explaining the pathway taken to bring the new service online and some of the new exciting features.
Oct 9: Lillian Padgitt-Cobb (David Hendrix Lab, Biochemistry & Biophysics)
Title: A phased, diploid assembly of the hop (Humulus lupulus) genome reveals patterns of selection and haplotype variation, i.e., Resolving functional and evolutionary mysteries of a large, complex plant genome with genomic data science
Abstract: Hop (Humulus lupulus) is a plant valued for its use in brewing and traditional medicine. Efforts to determine how biosynthetic pathways in hop are regulated have been challenged by its complex genomic landscape. The diploid hop genome is large, repetitive, and heterozygous, which challenged early attempts at sequencing with short-reads. Advances in long-read sequencing have improved detection of repeats and heterozygous regions, revealing that the genome is nearly 78% repetitive. For our assembly, PacBio long-read sequences were assembled with FALCON and phased into haplotype assemblies with FALCON-Unzip. Using the phased, diploid assembly to assess haplotype variation, we discovered genes under positive selection enriched for stress-response, growth, and flowering functions. Comparative analysis of haplotypes provides insight into large-scale structural variation and the selective pressures that have driven hop evolution. The approaches we developed to analyze the phased, diploid assembly of hop have broader applicability to the study of other large, complex genomes.
Oct 23: Kelly Vining (Kelly Vining Lab, Horticulture)
Title: R/qtl, i.e., Applications and methods for analysis of quantitative traits
Abstract: R/qtl is an R package that is used for genetic mapping and marker-trait association. This presentation will explore specific features of R/qtl applied to plant breeding populations. Data types, functions, and interpretation of results will be explored.
Nov 6: Ed Davis (Center for Genome Research & Biocomputing)
Title: Introductory microbiome analysis using phyloseq, i.e., How to generate exploratory diversity plots and what they mean
Abstract: Generating high quality, publication ready figures for a microbiome study can be somewhat difficult. An understanding of both the statistical tests and how to effectively use R to produce figures is required, so the learning curve can be somewhat steep. Fortunately, there are several easy-to-use packages in R that facilitate the analysis of microbiome studies using 16S amplicon data, including the phyloseq package that will be the focus of my talk. I will cover the basics of analyzing alpha and beta diversity and provide some code and example images to show how to generate publication ready figures starting from the base phyloseq output. I will also generate some exploratory charts and graphs such that one would be able to form and later test hypotheses using microbiome data. I will be happy to share the examples and code as well, so that I might catalyze the analysis of your own microbiome studies.
Nov 20: Cedar Warman (John Fowler Lab, Botany & Plant Pathology)
Title: High-throughput maize ear phenotyping with a custom-built scanner and machine learning seed detection, i.e., Computer counts corn, correctly.
Abstract: Near-incomprehensible amounts of maize are produced each year, but our understanding of the dominant North American crop is fundamentally incomplete. Of particular interest is the seed-producing structure of maize, the ear. Here, we present a novel maize ear phenotyping system. Our system captures a video of a rotating ear, which is subsequently flattened into a projection of the ear’s surface. Seed positions and genetic markers can be quantified manually from this projection. To increase throughput, we applied deep learning-based computer vision approaches to seed and marker quantification. Our progress towards a completely automated phenotyping system will be described, in addition to challenges we continue to face adapting computer vision technology to maize ears.
Dec 4: Christina Mulch (Kelly Vining Lab, Horticulture)
Title: IsoSeq pooling and HiSeq multiplexing comparison for Rubus occidentalis samples to explore Aphid resistance, i.e., Utilizing RNA to find differences between Aphid Resistant and Susceptible plants.
Abstract: Black raspberry (Rubus occidentalis L.) is a small specialty crop produced primarily in the Pacific Northwest of the U.S. A major challenge for its success is Black raspberry necrosis virus vectored by the Large Raspberry Aphid (Amphorophora agathonica A.). We used Pacific Biosciences IsoSeq long read sequencing technology to study the gene expression patterns in leaves following aphid inoculation. We collected samples from a segregating population for resistance to the pest. High quality RNA was extracted from 20 samples, 10 resistant (R) and 10 susceptible (S) using a modified RNA extraction protocol. Data processing was preformed using the IsoSeq3 pipeline. Alignment of each R and S pool to the latest chromosome level black raspberry reference genome used minimap2 according to recommended options for IsoSeq. Reads were filtered based on mapping quality, alignment length, and presence or absence in multiple samples. This study seeks to reveal the genetic underpinning of aphid resistance with the ultimate goal of enabling marker assisted selection.
Thank you for attending and we look forward to seeing you in
2020!
All of the slots for winter 2020 are full, but please contact us if you’re interested in presenting in the future.
The CGRB will be offering three different workshops this fall. For more information and to register, see the CGRB website.
All workshops are available for credit for students or available to non-students as non-credit workshop(s).
To give perspective students a better insight on each course, we’ve conducted short interviews with the instructors about their course.
See course descriptions and the interviews with the instructors below!
Courses Offered:
Introduction to Unix/Linux and Command-Line Data Analysis (2 modules x 5 weeks @ 2 hrs per week)
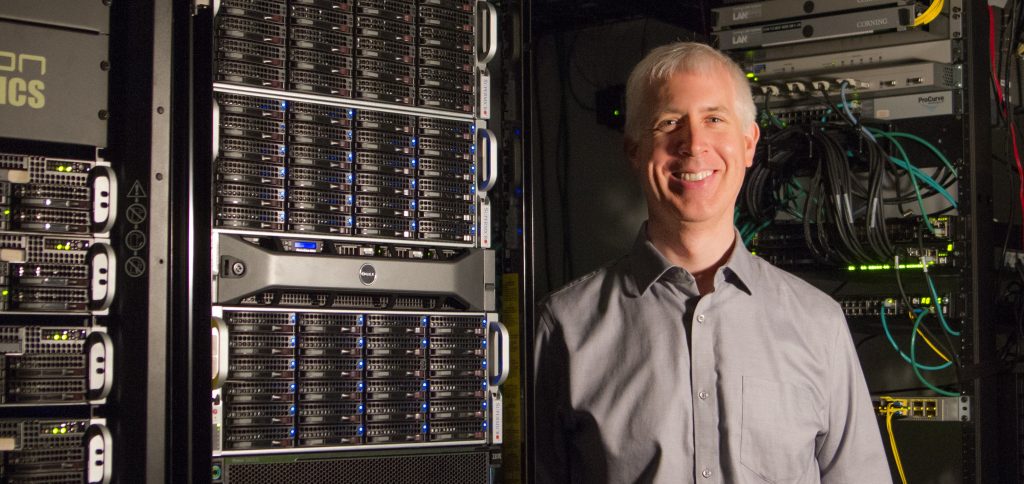
Instructor: Matthew Peterson
Course Description:
Introduction to Unix/Linux (5 weeks @ 2 hrs per week)
Logistics: Date & Time: Sep 25 – Oct 23, Mon/Wed 2:00pm – 2:50pm For credit: BDS599 CRN 20579 Workshop Cost: $250 This module introduces the natural environment of bioinformatics: the Linux command line. Material will cover logging into remote machines, filesystem organization and file manipulation, and installing and using software (including examples such as HMMER, BLAST, and MUSCLE). Finally, we introduce the CGRB research infrastructure (including submitting batch jobs) and concepts for data analysis on the command line with tools such as grep and wc.
Command-Line Data Analysis (5 weeks @ 2 hrs per week)
Logistics: Date & Time: Nov 4 – Dec 4, Mon/Wed, 2:00pm – 2:50pm For credit: BDS599 CRN 20580 Workshop Cost: $250
The Linux command-line environment has long been used for analyzing text-based and scientific data, and there are a large number of tools pre-installed for data analysis. These can be chained together to form powerful pipelines. Material will cover these and related tools (including grep, sort, awk, sed, etc.) driven by examples of biological data in a problem-solving context that introduces programmatic thinking. This module also covers regular expressions, a useful syntax for matching and substituting string and sequence data.
Matthew Peterson in the CGRB server room
Q1: What do you hope students gain from this workshop?
My hope is that students come to appreciate the power and flexibility of using the text-based command-line interface to interact with (Linux) computational infrastructures. With practice students will become self-sufficient in utilizing the infrastructure to conduct their own research.
Q2: Favorite topic in your course?
Pipelines! The ability to chain the inputs and outputs of multiple commands to filter data is immensely powerful.
Q3: Who should register for this course?
From the first page of the course syllabus: “Linux/Unix Commands, Bioinformatics Utilities, Computational Infrastructure: If you know nothing about the above, then you are exactly in the right course! WELCOME!”
Q4: Advice for users new to bioinformatics and/or programming?
Practice, practice, practice! Learning how to use the command-line effectively is like making a clay pot, you need to get your hands dirty!
RNA-Sequencing (10 weeks @ 2 hrs per week)
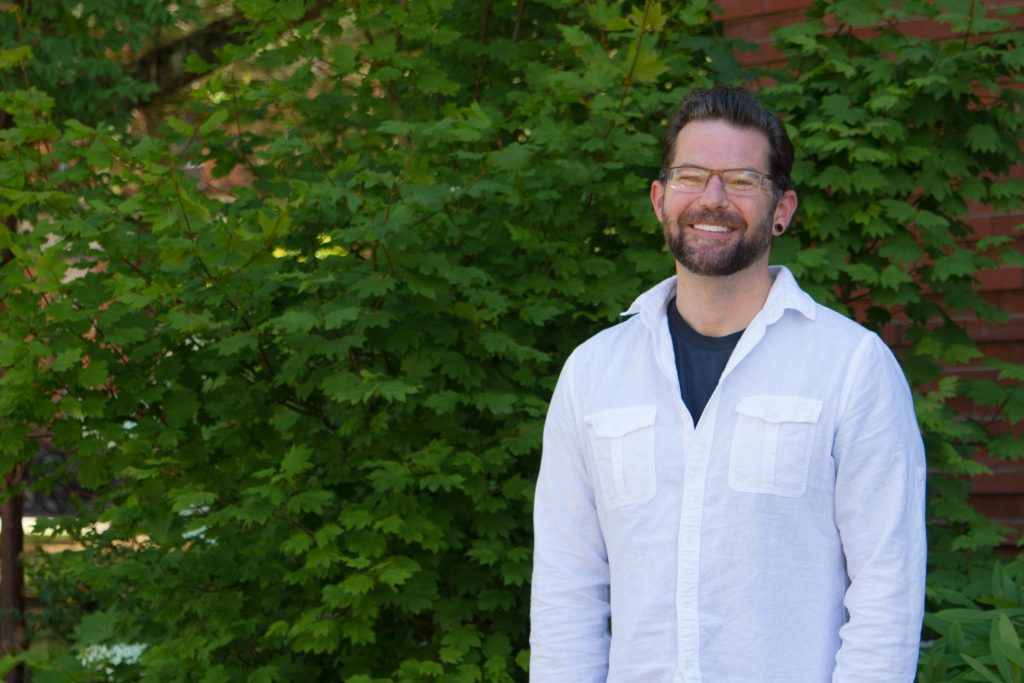
Instructor: Dr. Andrew Black
Course Description:
Logistics: Date & Time: Sept 25 – Dec 5, Tue/Thur 11:00am – 11:50am For credit: BDS 599, CRN 20581 Workshop Cost: $500
This course provides an introduction to, and practical experience with, the computational component of bulk-RNA-sequencing. After a general overview, participants will obtain a working introduction to command line, R-studio, and accessing and utilizing a computing infrastructure. Students with then work through a series of exercises cleaning raw FASTQ files, aligning reads to a reference genome, quasi-mapping reads to a transcriptome / de novo assembly, followed by data visualization and Differential Gene Expression analysis.
Dr. Andrew Black will teach the RNA-seq workshop this term.
Q1: What do you hope students gain from this workshop?
I hope that students gain an understanding of the computational workflow involved with RNA-seq and an appreciation of the methodology! My overarching goal with this course is that people can use material from this course as scaffolding for analyzing their own data on the CGRB infrastructure.
Q2: Favorite topic in your course?
I added a lord of the rings theme to my course; students are looking for differentially expressed genes between hobbits and golems. I’m a dork, I know, but I had fun spiking different genes into the data and enjoy having students visualize this.
Q3: Who should register for this course?
Graduate students, postdocs, faculty, or anyone outside of OSU that are interested in receiving an introduction to RNA-seq or for those that are needing to learn the workflow for their own project(s).
Q4: Advice for users new to bioinformatics and/or programming?
Take it one step at a time and get comfortable with several commands before expanding your scope. Also, record your commands / code in a text document, because if you aren’t using it on a daily basis, you’ll forget it!
Data Programming in R (6 weeks @ 3 hrs per week)
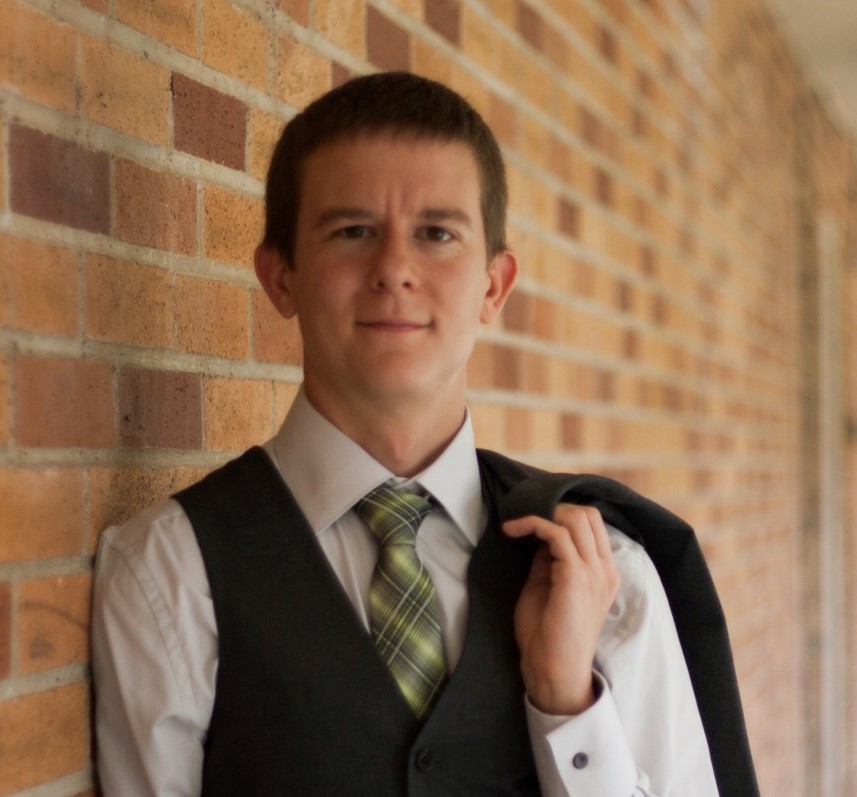
Instructor: Dr. Shawn O’Neil
Logistics: Date & Time: Sept. 25 – Nov. 6, Mon/Weds/Fri 9:00am – 9:50am For credit: ST 599, CRN 17196 Workshop Cost: $500
The R programming language is widely used for the analysis of statistical data sets. This course introduces the language from a computer science perspective, covering topics such as basic data types (e.g. integers, numerics, characters, vectors, lists, matrices, and data frames), importing and manipulating data (in particular, vector and data-frame indexing), control flow (loops, conditionals, and functions), and good practices for producing readable, reusable, and efficient R code. We’ll also explore functional programming concepts and the powerful data manipulation and visualization packages dplyr and tidyr, and ggplot2.
Q1: What do you hope students gain from this workshop?
I really hope that students gain an appreciation for programming as a creative activity. It’s not just a means to an end, even with a statistical language like R; there’s a lot of room for play and exploration. Simulation, for example, is a great way to explore complex systems and ask ‘what if’ questions. Many languages (including R) support programmatic drawing and data visualization which can be quite fun.
Q2: Favorite topic in your course?
I always enjoy the point when we first start scaling analyses to thousands of statistical tests. It’s an eye-opening moment, and doing so in R introduces ‘functional programming,’ a powerful and increasingly important paradigm for software design.
Q3: Who should register for this course?
Anyone who is interested in doing data analysis, especially of a statistical sort. For those interested in learning programming in a broader sense, our winter Intro to Python series is an excellent overview of fundamental concepts. Although we cover the same topics in the R course, R organizes its features differently than most mainstream programming languages like Python, Java, and C++. Learning both Python and R provides a solid foundation for data science!
Q4: Advice for users new to bioinformatics and/or programming?
I do recommend learning more than one programming language, eventually, as this helps separate deeper concepts from syntax. Find what motivates you and explore it via programming — this could be your primary research project, some field you’ve been wanting to learn more about, or even a hobby.
The CGRB’s biocomputing infrastructure was highlighted in AMD CEO Lisa Su’s keynote speech at the Consumer and Electronics Show (CES) in Las Vegas on January 9, 2019. Watch below:
This blog post was originally published on September 10, 2018 and written by Christopher M. Sullivan, Assistant Director for Biocomputing. Read the whole article here.
The Oregon State University’s Center for Genome Research and Biocomputing (CGRB) and the Plankton Ecology Lab at OSU Hatfield have been collaborating in implementing an image processing pipeline to automate the classification of in situ images of plankton: microscopic organisms at the base of the food web in the world’s oceans and freshwater ecosystems. The imagery collection from a 10-day cruise typically contains approximately 80 TB worth of video, which, in some cases, may convert into image data yielding several billions of segments representing individual plankton and particles that need to be identified; a near impossible task to carry out manually by human experts. While we have a fully functional Convolutional Neural Net (CNN) algorithm that does an excellent job at predicting the identity of the plankton organisms or particles, we have been limited by GPU computational capabilities. We started working with PCI bus based Tesla K40 and K80 GPUs, which were good enough to manage millions of segments. However, when it came to billions of segments, it became a near insurmountable challenge.