Drone applications in productionPot in Pot productionCover crop researchStudents collecting data on run-off padContainer type researchStudents renovating run-off padSensor controlled irrigationLiDAR sprayer systemsNackley Lab research activities at NWREC
Nackley Lab nursery production open house takes place August 23. 2023 from 11am – 2pm
Parking: follow signs to south side of the Cravo North Willamette Research and Extension Center and then follow signs walk 5 mins (west) to Nackley Lab Welcome Center.
The tour route will travel through fields with uneven terrain. Farm cart transport (e.g. gators) can be available for those who request assistance.
Schedule of Events
Field Tour 11 :00 -11:15 Station 1. Welcome, overview of the program and biostimulant research on Shade-Trees 11:15 – 11:30 Station 2. Plant-based irrigation scheduling: pressure bomb and infra-red thermography 11:30 – 11:45 Station 3. ET-based irrigation scheduling and Flatheaded borer research 11:45 – 12:00 Station 4. Cover cropping and Heat-stress prevention 12:00 – 12:15 Station 5. Boxwood blight control 12:15 – 12:30 Station 6. LiDAR “smart” air-blast sprayer and drone demonstration
12:30 – 1:00 Station 1. Open chat with research team, refreshments and grilled sides.
Open House 1:00 – 2:00 Self guided tour. Researchers will be at each of the six stations to answer questions. Sprayer demos will take place at station 6 every 15 mins.
Shade tree growers need to be prepared for the effects of climate change in Oregon.
In order to equip growers with the tools necessary for production success, we aim to determine critical shade tree stress thresholds, characterize plant responses to drought conditions, and correlate remotely collected spectral images with ground based plant water stress measurements.
Previous studies have sought drought response measurements for Acer rubrum (Red Maple) and Quercus rubra (Red Oak), but never in a nursery production setting.
We aim to disseminate this information to Oregon shade tree growers at the completion of this experiment with the hope to aid growers in making data driven irrigation decisions and demonstrate the use of these technologies in nursery production settings.
Sadie Keller in the shade trees equipped with soil moisture sensors and a weather station.
The Problem:
In Oregon’s Willamette Valley, the heart of the nursery country, rainfall is scarce during the summer and humidity is low. Oregon’s dry summer conditions can lead to low moisture stress conditions for maples and oaks in normal years. Plant stress resulting from low soil moisture, high heat, and low relative humidity have been exacerbated in recent years with the increasing frequency of heatwaves and drought. Drought and heat stress scorch the maple and oak canopies, which can lead to decreased plant quality and economic losses for shade tree growers. Sensor-based technologies can be used to model plant responses to environmental gradients to develop warning systems to help growers prevent stress and bridge a knowledge gap in the nursery production industry regarding drought responses.
How are we studying plant stress responses?
Starting late June 2022, we will implement two irrigation treatments (well-watered and drought) in our shade tree planting with each row having independent irrigation control. The well-watered rows will be maintained at a soil water potential of >-1.0 mPa. The drought treatment rows will be allowed to naturally dry down to a soil water potential of -4 mPa. If during the experiment, our metrics (stomatal conductance and stem water potential) do not show considerable responses at -4 mPa tension, we will allow the drought treatment to continue to dry down progressively (-1 mPa) until stress is evident.
Why and how do we measure stem water potential?
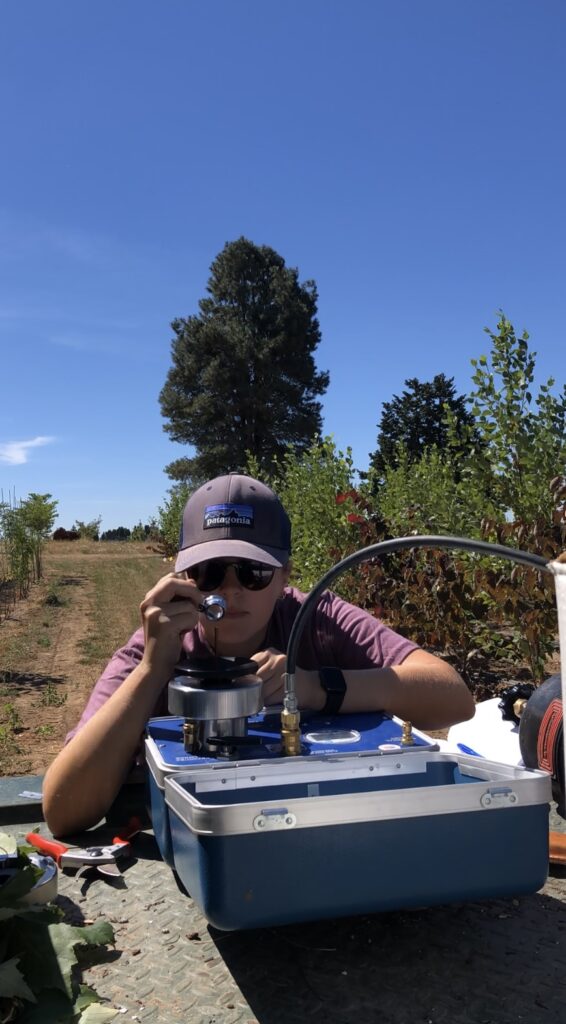
Plant water status is commonly defined in terms of water potential or the ability of the water to do work. In most cases, well watered plants have “high” water status and drought conditions lead to a “low” water status (Levin and Nackley 2021). Using the pressure chamber, we will take midday stem water potential measurements twice weekly from 12pm-3pm. This time frame is important because it represents the time of day where leaf transpiration is at its maximum.
First, we will cover the leaf and stems to be measured with an opaque bag for at least 10 minutes before pressurization to allow the plant to stop transpiring. Once we excise the sample from the tree it should be placed into the pressure chamber or “pressure bomb” within 30 seconds (Levin 2019). Once the stem is placed into the chamber and pressure is applied, the amount of pressure that it takes to cause water to appear at the cut surface tells us how much tension the stem is experiencing.
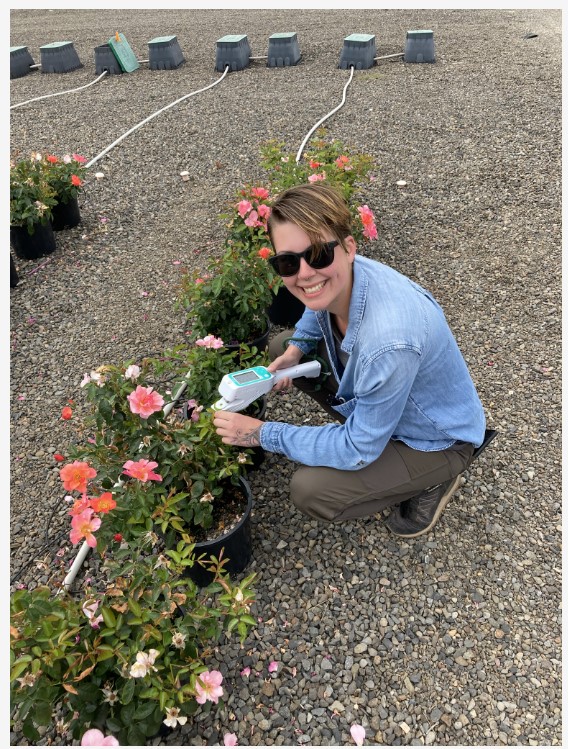
We measure stomatal conductance using a porometer that measures the degree of stomatal openness and the number of stomata (Licor.com). This indicates the plant’s physiological response to its current environment. If a plant is stressed, it will tend to close its stomata and lower the stomatal conductance rate. We will be using a combination of the LI-6800 Portable Photosynthesis System and the LI-600 Porometer/Fluorometer to make our measurements twice a week from 12pm-3pm.
For more information:
Please stay tuned in the coming months for more blog posts about how we will find plant stress thresholds by measuring the hydraulic conductivity of these shade trees. We will also correlate remotely collected spectral and thermal images with our ground based plant stress measurements to demonstrate how implementing a UAS equipped with a multispectral and thermal camera can be used to detect water stress in nursery production.
I spent my childhood in western New York where my mom took us hiking, mushroom foraging, and taught us how to identify the deciduous trees around us. We moved to Oregon when I was 10 and not much has changed except the forests were now coniferous and we learned to brave the rain. My love of plants and ecology was sparked during these weekend trips as I learned how all organisms are interconnected.
Raven taking leaf measurement with a Licor-600 at NWREC.
When I started my undergraduate degree, I had no idea what I wanted to do and jumped from major to major. After 2 years at community college, I transferred to Oregon State University and landed on marine biology. During this time, I had the opportunity to be a research assistant in Utila, Honduras for Operation Wallacea and lead scientific dives for PhD student Nadia Jogee. Through this experience I realized my love of problem solving that goes along with field research, but despite my enjoyment I felt that marine biology wasn’t quite what I wanted for a career.
Once the pandemic hit and I was suddenly home all the time, I started to collect house and landscape plants to improve my living space. I had a lot of fun learning to care for them and read up on nutrient needs, soil types, watering, pruning, and propagation. A lot of this information I found in extension articles that led me to the College of Agricultural Science at OSU. I now have research experiments that focus on improving plant care and management practices in nursery production systems.
I’m now in the last term of my undergraduate degree in Horticulture and am fortunate to have been in the accelerated master’s platform (AMP) for the last year, with Dr. Lloyd Nackley and Dr. Ryan Contreras as co-advisors. This program has allowed me to get a head start on my graduate coursework and field research with the support of my advisors and other faculty. I have gotten to learn so much in the last year from propagating cuttings, to finishing plants, best management practices, and so much more. I also get valuable lab experience working for Dr. Carolyn Scagel at the USDA-ARS Horticulture Crops Research Lab where I have assisted with tissue collection, water sampling and nutrient and data analysis to aid in her plant physiology research. My favorite part of research is getting to work outside to conduct experiments and getting to work alongside so many great and knowledgeable people!
An overhead view of Raven’s project on container grown oak trees at the North Willamette Research and Extension Center (NWREC).
The pretty flowers of spring, shade providing leaves of summer, and fire like colors of fall help us know when the seasons are changing. We use calendars to plan everything in our lives. Nature does the same but not in the same way.
Shade tree seasonal progression from spring (top left) to fall (bottom right).
What causes trees to change?
We can all remember early spring weather that was warm and dry as well as those years when we hoped our 4th of July BBQ would not get rained out. These weather differences from year to year influence events in nature that are crucial for species to survive. Plants and insects go dormant over the cold winter and begin growing in the spring and do it without a single calendar. They use day length and temperature to schedule their life events. The day length in the Willamette valley changes from 8 hours and 46 minutes in winter to 15 hours and 36 minutes in summer. These changes are predictable because they are cause by the tilt of the Earth, which doesn’t change. Our calendars align with these dates (winter solstice and summer solstice).Temperature, however, is unpredictable because there are a vast number of factors that influence it.
What changes are we monitoring?
A large part of the nursery industry in Oregon is dedicated to growing shade trees. Best management practices require monitoring for signs of event changes throughout the tree’s life cycle. This is known as Phenology, defined as the study of cyclic and seasonal natural phenomena, especially in relation to climate and plant and animal life. The Nackley Lab has a small in ground tree nursery that we use for experiments. For the past 3 years we have been conducting a Phenology Study where we have tracked the dates our tree events happened.
Monitored events in our Phenology study
Bud Break: Date when the protective scale coating is shed from the bud exposing the tender new growth shoot
First leaf: Date the first leaves are completely unfolded on at least 3 branches
All Leaves Unfolded: Date when 90% of buds have reached first leaf
First Flower: Date the first flowers are opened and stamens are visible on at least 3 branches.
Full Flower: Date when half or more of the flowers are fully open
First Ripe Fruit: date when the first fruits become fully ripe or seeds drop naturally
Full Fruiting: Date when half or more branches have fully ripe fruit or have dropped seeds
50% Color: Date when half or more of the branches have leaves that have started to change color
50% Leaf Fall: Date when half or more of the leaves have fallen off the tree
Phenological stages of flowering trees from bud break (top left) to full flower (bottom right).
How can this information be useful?
As we collect data in year 3 (2022) of this study we are excited for how this data may be used in the future. Temperature data can be used to make degree day models which are based on heat units. The number of heat units per day are added together in a running total. This information is much better at predicting events in nature when compared to calendars. When growing shade trees in a production nursery setting, defending the crop from disease and predators is essential. Spraying a tree with a fungicide at bud break keeps them growing healthy. Spraying pesticides at first flower protects trees from insect attacks. By creating degree day models, growers can predict when to apply chemical protection for trees, eliminating double applications caused by calendar reliance.
Growers know the uncertainty caused by a changing climate impacts tree growth events. It’s hard not to trust the calendar dates which we plan everything else in our lives by. Future projects include modeling the events recorded over the last 3 years, and seeing how they align with degree day accumulation. The end goal is to use what we’ve learned to help keep the labor and pesticide costs down for the local nurseries while the produce the beautiful tree’s we all depend on.
My path to pursuing a Master of Science in Horticulture has not been straight and narrow. Ironically, growing up in California’s Central Valley, I wasn’t aware of the career possibilities in agriculture and horticulture. I’d always possessed an affinity for plants and the outdoors for as long as I can remember. My earliest memories involve working in our backyard garden with my dad and raising chickens.
I graduated high school with a love of science and headed to college to pursue an engineering degree. After two years of struggling with my major, it was time to come home and assess my options. I started attending classes at a local community college and found a job working farmers markets on the weekends. Little did I know, this experience would change the rest of my life. I loved this job and it showed me what I was passionate about; the environment, sustainability, irrigation efficiency, and building climate resilient landscapes and agriculture systems.
Sadie measures stem water potential using a pressure bomb.
I transferred to California State University, Stanislaus to obtain a Bachelor of Science in Agriculture. From this point on, I have thrown myself into every possible internship and work experience to expand my skills and deepen my knowledge. I’ve worked as a nursery technician, a field scout, a CSA assistant, a standards program aide for the county, a trapper, an inspector, and research assistant. In February of 2020, I was selected to attend the Future Leaders in Agriculture Program in Washington D.C. with 20 other students from around the U.S. where my eyes were opened to the vast opportunities available in agriculture.
Now, as a Graduate Research Assistant in the Nackley Lab, I study ornamental plant vascular systems responses to drought conditions and stem hydraulics. Being at Oregon State and a member of the Nackley Lab, I feel like I am getting the most hands-on experience and interdisciplinary education possible. I am getting lab experience working for Dr. Carolyn Scagel at the USDA-ARS Horticulture Crops Research Lab where I support her plant physiology research by helping with tissue and water sample collection, processing, and laboratory analyses related to plant water relations and plant mineral nutrition. With Dr. Nackley, I am getting to explore my interests in remote sensing technologies and learning how I can incorporate these technologies into my thesis project. I am also a TA for his Plant Nursery Systems class this Spring. My favorite part about doing research is working at NWREC over the summer with our lab team and other graduate students.