Five Scientific Studies that Changed the Way I Think About Gardens: Part 2, Putting a Price on Nature

This is the second is a series of articles that I am writing for the Hardy Plant Society of Oregon Quarterly Magazine. I extend my thanks to the HPSO editorial team for improvements to my narrative.

***************

Humans benefit from the natural world in many ways. These benefits include the products (such as food, fiber, or timber) that we can harvest from nature, or the processes (such as pollination, biological control, or nutrient cycling) that make earth such a nice place to live. Whether people recognize the importance of these so-called “ecosystem services” to our health and well-being varies considerably as a function of education, past experiences with nature, and other socio-economic factors. In fact, some people find abundant ecosystem disservices in nature. For example, some people view natural areas as dangerous places that should be avoided.

A major focus of the Garden Ecology Lab research program is to discover which garden plants may help maximize the ecosystem services of pollination and biocontrol.

In an increasingly urbanized world, where many people lack meaningful interaction with the natural world, how can we help ensure that the importance of nature is recognized and valued? As Robert Michael Pyle wrote in his book The Thunder Tree: Lessons from an Urban Wildland (1998: Oregon State University Press), “What is the extinction of a condor to a child who has never seen a wren?”

One approach to helping society value the natural world is to put a dollar value on it, and that’s just what Robert Costanza and 12 colleagues did over the course of a five-day workshop hosted by the National Center for Ecological Analysis and Synthesis in 1996. A few months later, they published the second global accounting of the monetary value of the ecosystem goods and services of our planet1.

The authors found over 100 studies that valued one or more ecosystem services. They standardized the dollar value of each ecosystem service as the 1995 dollar value per hectare. They noted the location of each study and categorized the biome where the study occurred. They also generated novel estimates of the dollar value of various ecosystem services in various biomes by constructing what were essentially supply and demand curves. With these curves, they mathematically asked questions such as “How much more valuable would pollinators be, if they were endangered?” In this way, they were able to mathematically manipulate supply and demand curves and estimate what is known as the “marginal value” of each ecosystem service. In short, they used a lot of math. On a global map, they measured the area taken up by each biome. They multiplied the dollar value of each ecosystem service per unit area by the area taken up by each biome and developed a global map of sum-total value of ecosystem services.

The authors estimated that the value of the earth’s ecosystem services averaged $33 trillion dollars per year (1995 dollar value), which was 1.8 times the global gross national product. Nutrient cycling represented the highest valued ecosystem service, at $17 trillion per year. Coastal systems were identified as the most valuable biome, at $12 trillion per year.

Urban and suburban areas were included in the study. What struck me about this paper, however, was that the dollar value of ecosystem services of urban areas was not listed. Instead, the authors noted that ecosystem services in urban areas (like desert, rocks, tundra) “do not occur or are known to be negligible.”

When I read this paper as a young Ph.D. student in 1997, I was incensed. My family grew food and raised chickens and rabbits in the backyard of our Baltimore rowhouse (ecosystem service = food). As a child, I captured water striders, turtles, and tadpoles from urban streams (ecosystem service = habitat). As an undergraduate, I loved exploring the urban forests of Patapsco Valley State Park for exercise and stress management (ecosystem service = recreation). Did urban areas really deserve a zero? This paper made me want to study the ecosystem services of cities, just to prove the authors wrong!

Composting is an example of the ecosystem service of waste treatment.

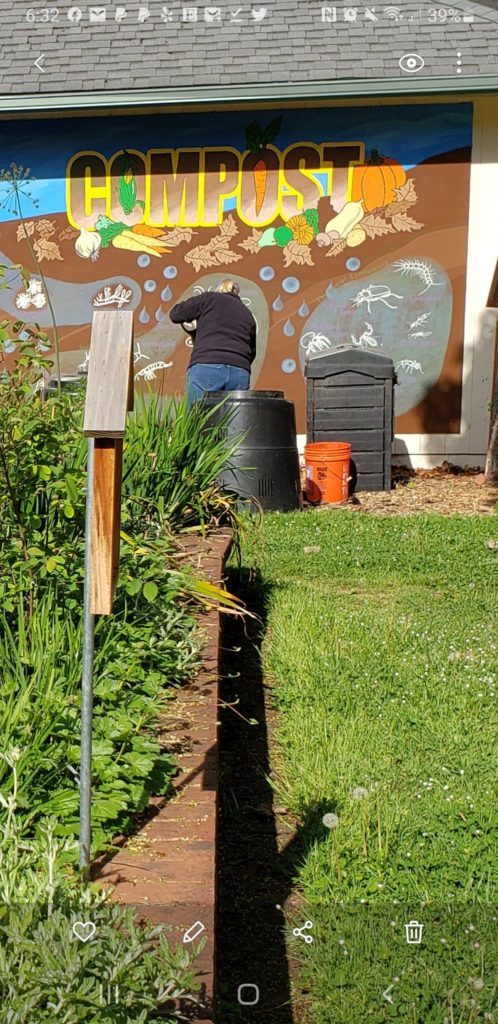
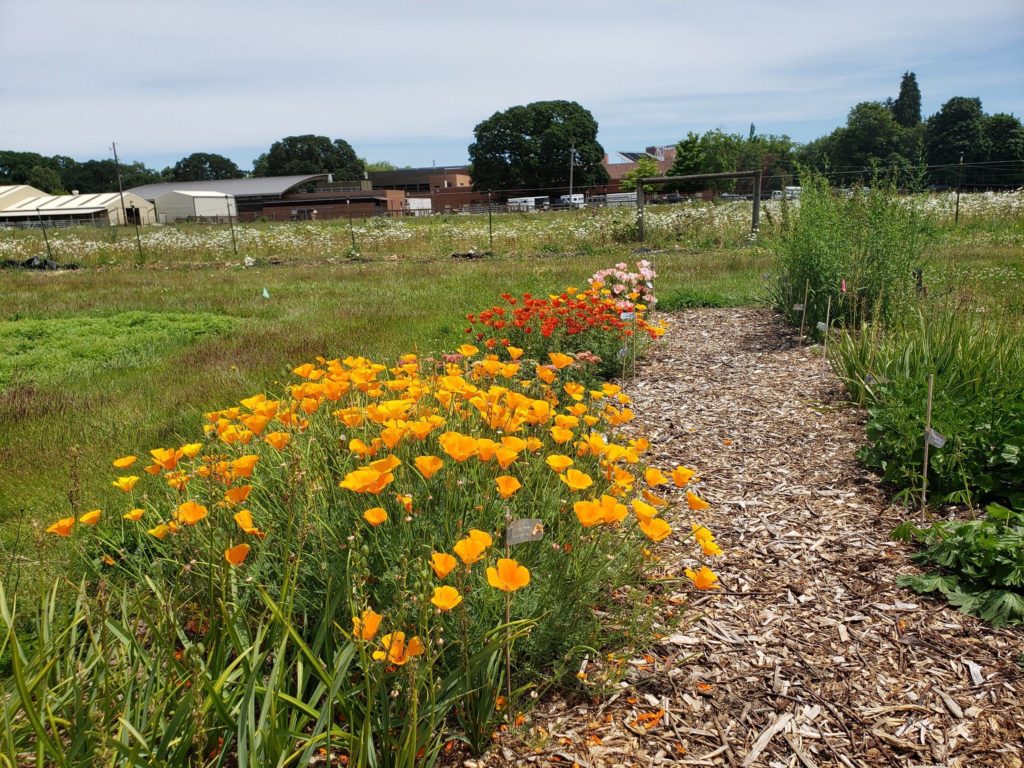
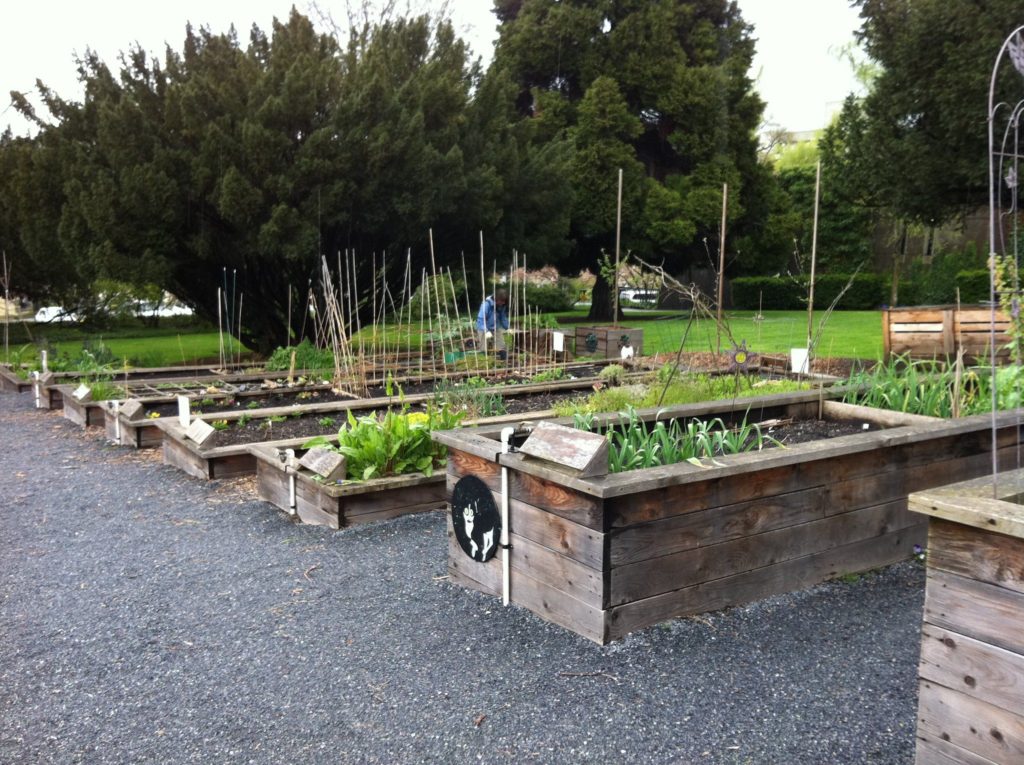
In 2002 I started to study the ecology of urban areas, as an assistant professor of biology at Fordham University in New York City. I collaborated with doctoral student Kevin Matteson to study the value of urban gardens as wildlife habitat and pollinator conservatories. We found that 18 small gardens dotting one of the most urbanized landscapes on earth were used by a diversity of insects, including 24 species of butterfly and 54 species of bee. At this same time, others were also documenting the ecosystem services of urban areas. For example, The New School’s Timon McPhearson estimated that raised bed gardens in New York City annually helped to retain and manage 12 million gallons of stormwater from flooding city streets. Karin Burghardt, as a University of Delaware undergraduate studying with Doug Tallamy, showed how plant choices can increase bird abundance and diversity in suburban gardens in Pennsylvania.

Raised beds in urban areas retain rainwater and reduce run-off and storm system overflows. This is an example of the ecosystem service of disturbance regulation.

In fact, the early 2000s were a heyday for urban ecology research, due in large part to National Science Foundation funding of urban long-term ecological research efforts in Phoenix, Arizona, and Baltimore, Maryland. Whereas less than one-half of one percent of all papers published in nine leading ecological journals between 1995 and 2000 focused on urban systems or urban species (Collins et al. 2000), by 2016 over 1,000 articles, books, and book chapters have been published; and over 130 students have been trained in urban ecology by the Phoenix and Baltimore programs, alone (McPhearson et al. 2016). Despite these advances, the field of urban ecology is still relatively young, and much remains to be discovered.

In 2014, Costanza and colleagues published a new paper, with an updated estimate for the value of our globe’s ecosystem services.2 They estimated that natural systems annually provided $125 trillion (2011 US$ value) in ecosystem services to humanity. At least part of this increase is due to improved documentation of the portfolio of ecosystem services provided by different biomes (see table). And this time, ecosystem services provided by urban areas were valued at $2.3 trillion dollars, or $2.9 trillion in inflation-adjusted dollars for 2020.

”Hmph,” I thought. “At least it’s a start.”

1Robert Costanza et al. (1997): “The value of the world’s ecosystem services and natural capital.” Nature 387: 253-260.

2Costanza (2014): “Changes in the global value of ecosystem services.” Global Environmental Change 26: 152-158.

Table 1. The Value And Ecosystem Services Provided By Various Biomes On Earth. All dollar values have been inflation adjusted to 2020 dollar values, and are reported as TRILLIONS of dollars. Red Text: Identified as a service in Costanza et al., 1997, but not 2014; Green Text: Identified as a service in Costanza et al., 2014, but not 1997; Black Text: identified as a service across both papers.

BiomeValue from 1997 PaperValue from 2014 PaperEcosystem Services
Open Ocean$14.8$27.9Gas regulation, Cultural, Climate regulation, Genetic resources, Recreation, Nutrient cycling, Biocontrol, Food
Coastal$22.1$35.3Climate regulation, Erosion control, Genetic resources, Disturbance regulation, Nutrient cycling, Biocontrol, Waste treatment, Habitat, Food, Raw materials, Recreation, Cultural
Forest$8.3$20.7Gas regulation, Pollination, Habitat, Climate regulation, Disturbance regulation, Water regulation, Water supply, Erosion control, Soil formation, Nutrient cycling, Waste treatment, Biocontrol, Food, Raw materials, Genetic resources, Recreation, Cultural
Grassland$1.5$23.5Climate regulation, Water supply, Habitat, Raw materials, Genetic resources, Cultural, Gas regulation, Water regulation, Erosion control, Soil formation, Waste treatment, Pollination, Biocontrol, Food, Recreation
Wetlands$8.5$33.65Gas regulation, Climate regulation, Erosion control, Nutrient cycling, Biocontrol, Genetic resources, Disturbance regulation, Water regulation, Waste treatment, Habitat, Food, Raw materials, Recreation, Cultural
Lakes/Rivers$2.9$3.1Water regulation, Water supply, Waste treatment, Food, Recreation
Desert$0$0 
Tundra$0$0 
Ice/Rock$0$0 
Cropland$0.3$11.9Climate regulation, Water supply, Erosion control, Soil formation, Waste treatment, Raw materials, Genetic resources, Recreation, Pollination, Biocontrol, Food,
Urban$0$2.9Climate regulation, Water regulation, Recreation

Five Scientific Studies that Changed the Way I Think About Gardens: Part 1

[Preface: For the past few years, I have written a column for the Hardy Plant Society of Oregon’s (HPSO) Quarterly Magazine. It has been a wonderful experience, as the HPSO provides excellent editorial assistance. Below, I share my most recent article for the HPSO Quarterly, and thank Eloise Morgan and her team for helping to improve and elevate my writing.]

I spend my nights thinking about gardens: not about the plants that I want to purchase or the crops that I want to plant. Instead, I puzzle over how to study a system that is incredibly variable (from person to person, or even in the same person’s garden from year to year) and complex (with more plant species than just about any other system that has been studied). Gardens are both wild and managed, and unlike other systems I have worked, it is impossible to divorce human behavior from the ecology and evolution of the garden.

In this series, I wanted to share five scientific studies that have had a large role in shaping how I think about gardens. Because of space limitations, I will share the first study in this article. I will wrap up the remaining four studies, in subsequent issues. The five studies are:

Simberloff and Wilson (1969). This study commenced 54 years ago, and yet remains a ‘must read’ for any ecology student. In 1966, Dan Simberloff and Ed Wilson selected six small mangrove islands off the coast of Florida. The islands varied in distance from the mainland coast, from near to far (Figure 1a), as well as size, from small to large (Figure 1b)

Figure 1. In Simberloff and Wilson’s experiment, they selected mangrove islands that varied in their (a) distance from the mainland (the coastline of Florida) and (b) their size. Attribution: Hdelucalowell15 / CC BY-SA (https://creativecommons.org/licenses/by-sa/4.0)

Simberloff and Wilson constructed a scaffold that encircled the edge of each island, covered the scaffold with a tarp, and then proceeded to ‘defaunate’ each island with methyl bromide pesticide. In other words, they killed every arthropod on the islands. After removing their ‘death tents’, and over the course of the next year, they carefully monitored, cataloged, and counted every arthropod that arrived and survived on each island. What they discovered was formulated into the ‘Theory of Island Biogeography’, or a theory about how organisms colonize new habitat, and assemble into a biological community.

They found that islands that were closer to the mainland coast of Florida were colonized earlier, and accumulated species faster, compared to islands that were farther (Figure 2). They also found that species would accumulate on each island, over time, until a maximum peak is reached (not shown). Then, the number of species would begin to drop, as ecological interactions (such as competition for food) would allow some species to prosper, while others went locally extinct. They found that smaller islands were more prone to species extinctions, than larger islands (Figure 2).

Figure 2. Island size (small or large) and distance from the mainland coast (near or far) infuenced the dynamics of species colonization and extinctions on mangrove islands. Image Source: https://commons.wikimedia.org/wiki/File:Island-biogeography.jpg#file

Size, distance, age: those are the three things that Simberloff and Wilson predicted would govern the diversity and assembly of organisms within a habitat.

My first faculty position was at Fordham University in New York City, where I studied pollinators in 18 community gardens in Harlem and in the Bronx. During the course of this study, I was inspired by Simberloff and Wilson. I could not help but see the 600+ community gardens that dot the landscape of New York City as islands of green in a sea of concrete.

We expected that gardens that had been long-established would have more pollinator species than newer gardens. We expected that larger gardens would host more pollinator species than smaller gardens. And, we expected that gardens that were closer to ‘mainland’ sources of pollinators, such as Central Park or the New York Botanical Garden, would have more species of pollinator than those that were distant.

We were wrong on two out of three predictions (Matteson and Langellotto 2010). Larger gardens had more pollinator species than smaller gardens, but neither distance nor age had any impact. I was so disappointed that we did not find an effect of distance, or of garden age. I had visions of ‘revitalizing’ the Theory of Island Biogegraphy for urban landscapes, but it was not to be. If anything, our study suggested that the ‘sea of concrete’ was not exactly a wasteland, afterall. The street trees, potted plants, windowsill gardens, and patio gardens all provided resources for urban pollinators, even in one of the most densely populated and heavily developed cities in the world.

This study showed me that it will be much more difficult to track pollinator movements among urban gardens, than I had hoped. We tried to use a traditional mark-recpture approach (see Matteson and Langellotto 2012), but out of 476 marked butterflies we only found four in a garden other than which it was marked and released. We were searching for the ‘needle’ of small butterflies in the ‘haystack’ of the New York City landscape. My students tried to follow pollinators as they left our study gardens, and almost got hit by a car, as they were running across the street. We played around with the molecular markers of a few bumblebees (see Morath 2007), to see if there was evidence of genetic differentiation, but were stymied by a lack of reliable primers that could help us look for any genetic differences in bees from different gardens. And then I moved to the Willamette Valley, where gardens are islands of green in an ocean of green. Understanding what draws pollinators to particular gardens will be even more difficult in this landscape, where pollinators have so many other choices for finding nectar and pollen.

Based upon our initial results from our Portland Garden study (2017-2019), I think I have a new hypothesis as to what might draw pollinators to home and community gardens. Our second study year (2018) was characterized by a hot and dry summer. Our first sampling season was also dry, but the spring months were wet, and the summer was cooler. In 2018, we collected far more bees (abundance) and more types of bees (species) than we collected in 2017 or 2019. In 2018, the landscape of the Willamette Valley was toast! Almost all flowering plant materials seems to shut down photosynthesis, so that they could conserve pressure water that would otherwise escape through open stomates. In this type of situation, bees seemed to concentrate in home gardens, which seemed to be one of the few places where they could reliably find nectar and pollen.

If this is the case, gardens aren’t necessarily going to be an important source of floral resources across all years. In a good year, there should be other plants in bloom in the greater landscape that bees can use. But in a hot, dry year, gardens may become an even more important refuge for bees. Most gardeners provide irrigation, which extends the bloom season beyond what is natural in the valley. Or, gardeners select plants that can prosper and bloom without supplemental irrigation, such as goldenrod or Douglas aster. It’s important to note that, even in the hot, dry weather of 2018, we still collected more bees from gardens that used drip irrigation, rather than overhead sprinklers. I think that the overhead irrigation physically blocks bees from navigating through a garden, which lessens their abundance and diversity.

Ultimately, I hope that our studies can lead us to a more predictive model of the resource value of home gardens to pollinators. The goal isn’t necessarily to understand what gardeners should do to attract pollinators, but to describe the conditions where gardens become increasingly important to pollinator conservation. In addition, I’d love to describe the value of gardens, relative to other habitat types, to pollinators. And finally, I hope to better understand the direction and movement of pollinators between gardens and other habitat types.