

Every summer, vineyard staff spend days to weeks gathering data from field counts and weights to obtain harvest yield estimates. Getting as close to harvest estimates as possible is a primary goal of many producers. It is critical to make cluster thinning decisions to meet contract stipulations, purchase enough winery supplies, and ensure sufficient space is available at the winery for processing.
Over the past six or seven years, Oregon has had some of the highest and lowest wine grape yields. Vine yield was at a record low in 2020 due to poor climatic conditions during bloom. Crop estimation is challenging in a typical year, but it is especially challenging in poor fruit set years. This is due to the greater berry and cluster weight variability that requires more attention to detail in sample collection.
My lab has been working on ways to improve crop estimation for Pinot noir growers for a decade. This work was done to improve our current methods of estimating crop, and I have shared some of that work with the industry over the years (see Additional Information below). By using day count since bud break and bloom, and heat units (growing degree-days in Fahrenheit, GDD50) accumulated after those phenological stages, we found the berry development curve was tightly related to both day count and thermal time. These relationships allowed us to develop equations for cluster weight increase factors that would help growers estimate crop yields. I had many questions come in last year about how crop estimation methods would change due to the poor fruit set, so we took advantage of the year to understand how well our model works.
In 2020, we began monitoring berry development in a new project to quantify vine physiology and growth amongst different soil types. Within that project, we monitor berry development in the same way we did in our prior work from 2011-2016, starting with cluster sampling from ~20 days post-bloom and continuing until harvest. We collected 60 Pinot noir clusters once or twice weekly. Each cluster was measured for cluster weight, berry count, berry weight, rachis weight, rachis length, berry diameter, and seed hardness.
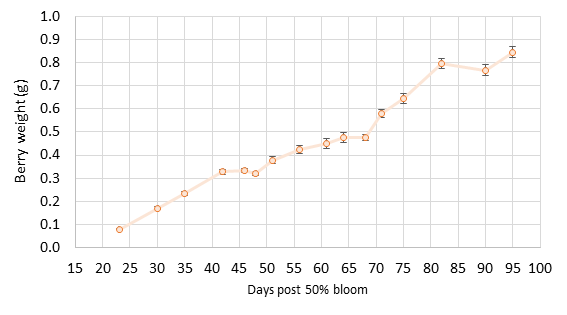
The findings. Berry size was smaller than normal, reaching an average size of 0.85 g (+0.2 g) at harvest (Figure 1). The typical Pinot noir berry is 1.0 g at harvest. There was also more variability in berry size with many “hens and chicks” throughout the entire season. Many small berries persisted with fewer larger berries. Clusters had substantial weight variation (Figure 2) due to varying berry count and berry size per cluster. By harvest, clusters ranged from 21 berries to as many as 186 berries, with the mean size of 81 berries per cluster. Mean cluster weight was under 80 g per cluster. A few veteran grape growers and winemakers comment that small berries do not double in size, so increase factors during lag phase crop estimation need to be lower than normal. We tested this question with our data in 2020, and we found that berries still double in size from lag to harvest (Figure 1). Cluster weight also increased as usual. Berry weight plateaued at 50-60 days post 50% bloom (lag phase), and this related to a cluster weight increase factor of 1.9 by harvest. This matched our prior study findings. The increase factor refers to the number used to multiply the mean cluster weight at sampling to obtain the final cluster weight for harvest. Berries reached their full size by 90 days post-bloom, about 5-10 days later than for berries in our model from 2011-2016.

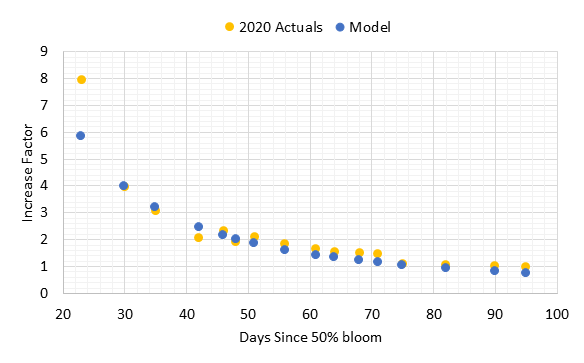
When the cluster weight increase factors for 2020 were compared with the model, there was strong agreement at and after 30 days (Figure 3). The one sample date at 23 days post 50% bloom was higher than the model. However, the model matched precisely for 30 days post-bloom, and all other dates had agreement at 90% or better except for the two dates closest to harvest that underestimated cluster weight by 20-30%. Often the pre-harvest cluster weights may be variable due to berry desiccation with warm weather or extended hang time. These results show that the standard procedures for increase factor determination would apply for clusters with variable set.
How to estimate yield in poor set years. An essential part of crop estimation is obtaining a representative cluster sample that represents the vineyard spatially. Good vine and cluster counts are also needed. How the cluster sample is obtained is important in any year but particularly critical to do well in a poor set year where there is more variability than normal in berries per cluster and berry weight. To ensure the best crop estimates, employ sound sampling protocols to get cluster counts per vine and cluster weights from representative vines spatially distributed throughout the vineyard block and use appropriate increase factors. If you have inadequate sampling procedures (not enough clusters and not well distributed spatially), you can expect that your estimations will be even more variable and likely less accurate. I do not recommend a certain number of clusters, as it will vary by your vineyard size and level of variability. However, it should be a large enough sample to explain variability across the vineyard block accurately. Keep notes on your methods and be sure to train those who are sampling to follow those methods.
If you wish to use the OSU increase factor equations this year, contact Dr. Patty Skinkis, Professor and Viticulture Extension Specialist, OSU at patricia.skinkis@oregonstate.edu.
Additional Information
Skinkis, P. 2017. Crop Estimation: It’s all about timing and good data. Oregon Wine Research Institute Vine to Wine Newsletter, July 2017.
Skinkis, P. 2019. Improved Crop Estimation Methods for Oregon Pinot Noir. Oregon Wine Symposium, Portland, OR (seminar video).
