Can Altering Canopy Shape Increase Productivity of Pinot noir: a new experiment at OSU’s Research Vineyard

Dr. R. Paul Schreiner, Research Plant Physiologist, USDA-ARS, Corvallis, OR

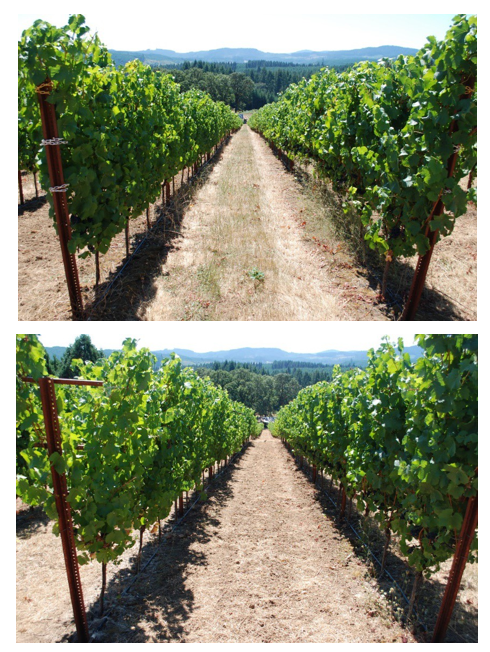
The newest block at Woodhall Research Vineyard is now six years old, and we will begin work in earnest next growing season to ask some fundamental production questions for Pinot noir. The key question is whether opening the top of a standard VSP training system (resulting in a Y-shaped canopy) will increase Pinot noir productivity without sacrificing quality (Figure 1). A second question is whether planting vines at a higher density impacts vine productivity or fruit quality. These questions are being addressed using a factorial experiment where two trellis treatments (traditional VSP & wide VSP) and two vine density treatments (3-foot and 6-foot in-row spacing) are applied in a randomized block design with five blocks. Each experimental plot has five continuous rows of vines about 100 feet long. Data will be collected from the middle three rows, allowing a border row of identical treatment on each side. Different crop levels will be applied to each of the trellis × density treatments by randomly assigning the north or south half of each plot to either low or high crop levels. The trellis and vine density treatments have been in place since 2015, and crop load will be manipulated for the first time next year. The vines were established using industry-standard practices (irrigation, fertilization, no crop in first two years, slowly increasing crop levels thereafter). In the last two years, vines were irrigated only twice each summer, when leaf water potential values reached about -1.4 MPa.

Why this design? Pinot noir producers in western Oregon use a VSP trellis system nearly exclusively where the shoots exist in a tight vertical plane that exposes only a small fraction of leaves to sunlight at midday when solar radiation is maximal. Opening the top of the trellis using a wide VSP system should increase net vine photosynthesis and the vine’s overall carbon budget, allowing more fruit to be produced per acre compared to a traditional VSP. This change can be implemented without removing the existing trellis, keeping costs low for this modification. A similar trellis design was shown to increase yield without compromising quality in Riesling vineyards (Reynolds et al. 1996). Pinot noir producers still thin crop to low levels, leaving 25-40% of their fruit on the vineyard floor. If opening up the canopy can allow Pinot noir producers to ripen more fruit per acre without negatively affecting quality, this approach can increase profits and sustainable production. Vine density per acre may also impact vine productivity or quality directly or by interacting with the altered trellis system. Still, such impacts cannot be predicted based on current knowledge. Since grafted grapevines cost about $5 each, reducing the number of plants needed per acre will significantly reduce establishment costs.

We have collected baseline data from the past five years. The block produced 2.2 US tons per acre in 2019 when the fruit was thinned to one cluster per shoot. Yield in 2020 was 2.5 tons per acre when no fruit thinning was applied due to low set in 2020. Thus far, yield has not been altered by the trellis or vine density treatments. However, vine vegetative growth based on pruning weights was altered for the first time in 2019. The high-density vines produced more shoot biomass in the wide VSP than the traditional VSP, but the low-density vines did not. Thus, the wide VSP appeared to capture more carbon than the traditional VSP in 2019, but only in high-density vines. We do not yet know if a similar response occurred in 2020 since pruning weights have not been obtained yet. Treatments have not altered yield parameters such as cluster weight and berry weight. Fruit composition based on must soluble solids, pH, titratable acids, and mineral nutrient concentrations has not been altered either. The application of different crop levels next year will result in a different yield, and this will begin to provide the true test of this experiment. I am excited to test these ideas on a large scale.

This research addresses improving vineyard production efficiency by altering the most common Pinot noir training system. If our hypothesis is correct, this research will improve Pinot noir wine grape growers’ profitability by increasing yield per acre, thus improving overall land and resource use efficiency.

Figure 1. Pinot noir in the Trellis Experiment at Woodhall Research Vineyard near midday on August 26, 2020. Top panel: Standard VSP. Bottom panel: Wide VSP. Note: larger shadow under Wide VSP vines.

Literature Cited

Reynolds AG, Wardle DA and Naylor AP. 1996. Impact of training system, vine spacing, and basal leaf removal on Riesling. Vine performance, berry composition, canopy microclimate, and vineyard labor requirements. Am J Enol Vitic 47:63-76.

Renovating the OSU Research Winery

A vital component of the Oregon Wine Research Institute’s “vine to wine” research approach is the ability to conduct a large number of controlled, research scale fermentations. This has allowed studies such as “Managing Nitrogen in the Vineyard or the Winery” to be performed or the 2020 project where eighty-four micro-fermentations of smoke impacted grapes from all across Oregon were conducted to provide information on the impact of smoke exposure in different regions and on different grape varieties. While the current research winery has served us admirably in the past, it is undersized and underequipped to meet our current and future needs. This hinders the ability for OSU to conduct research to address current and emerging industry priorities, such as mitigating the impact of smoke exposure from wildfires and recruiting and training the next generation of winemakers and viticulturists. Therefore, the primary need of the OSU enology program is a well-equipped winery with increased capacity for experimental winemaking.

An exciting opportunity to expand and update the winery has recently presented itself. The building the research winery is currently housed in, Withycombe Hall, will soon undergo a $55 million, fully funded renovation. This renovation will increase available space for the winery from approximately 800 sq feet to over 2,000 sq feet. With the infrastructure needs taken care of, all we need to do is fill that space with equipment essential for enology research and teaching. This will include the addition of a large number of small capacity research fermenters and appropriately scaled processing equipment, as well as a winery laboratory fully equipped to conduct essential grape and wine analysis. Investment in the new winemaking facility will provide the OSU enology program with a state-of-the-art winery with outstanding capabilities comparable to our peers at other Universities. In addition, larger-scale equipment for teaching purposes will strengthen training of current students along with providing improved work force training through extension courses.

The Erath Family Foundation has generously kicked off our $531,000 fundraising campaign with a gift of $100,000 and a promise to fund another $100,000 if the remaining $331,000 is raised by December 2022. Sam Tannahill and Cheryl Francis also committed to a $100,000 gift for this opportunity leaving $231,000 left on our goal. There are opportunities at many different levels to contribute as we fundraise towards this goal. If you are interested in finding out more about the winery renovation, please contact James Osborne at james.osborne@oregonstate.edu or call 541-737-6494. He would be happy to talk with you about the plans for the winery and how this facility will have a profound impact on our ability to conduct enology and viticulture research and train the next generation of winemakers and viticulturists. You can also contact Amy Crumley (amy.crumley@osufoundation.org), the Senior Director of Development for the College of Agricultural Sciences, for more details on how to partner with us on this project.

Winery processing room.
Fermentation room with temperature-controlled tanks.
Fermentation room with plastic fermenters waiting to be filled with grapes.

Impact of Grapevine Red Blotch Virus on Pinot noir grape and wine composition

Dr. Michael C. Qian, Professor (food chemistry), Oregon State University

Grapevine Red Blotch Virus (GRBV) is a single-stranded circular DNA virus that can cause Grapevine Red Blotch Disease (GRBD). The virus was first identified in Cabernet Sauvignon grapes in 2008 in California, and now the disease is known to be widespread in many wine grape-growing regions in North America. The leaves of infected grapevines turn red, and the fruit does not ripen, typically having reduced Brix and color (anthocyanin). Specifically, GRBV inhibits grape ripening pathways by altering transcription factors and hormone networks, disrupting normal grape berry development.

To better understand the impacts of GRBD on grape and wine quality – and potentially remedy the issue – we examined wine aroma composition of wines produced from GRBV positive vines that had undergone two different leaf removal treatments. This work was done in conjunction with Dr. Patty Skinkis (Professor and Viticulture Extension Specialist) and Dr. James Osborne (Professor and Enology Extension Specialist), both of OSU. The leaf removal trial was implemented in 2018-2020 growing seasons with 100% cluster zone leaf removal applied pre-bloom and compared with east-side cluster zone leaf removal by machine at fruit-set (industry-standard method). The result showed that earlier and more complete leaf removal increased monomeric anthocyanin and phenolic compounds in wines. The early 100% leaf removal led to higher levels of bound form grape-derived aroma compounds in wines compared to the standard practice (E side only leaf removal at fruit set by machine). While leaf removal increased bound grape-derived aroma compounds, it did not impact fermentation-derived volatiles as there were no significant differences in these compounds between treatments. This study suggests early leaf removal may lessen the effect of red blotch disease on grape anthocyanin content and potentially improve aroma composition.

This research was funded by industry donations granted to the Oregon Wine Research Institute.

Is Crop Estimation More Challenging in a Poor Fruit Set Year?

Every summer, vineyard staff spend days to weeks gathering data from field counts and weights to obtain harvest yield estimates. Getting as close to harvest estimates as possible is a primary goal of many producers. It is critical to make cluster thinning decisions to meet contract stipulations, purchase enough winery supplies, and ensure sufficient space is available at the winery for processing.

Over the past six or seven years, Oregon has had some of the highest and lowest wine grape yields. Vine yield was at a record low in 2020 due to poor climatic conditions during bloom. Crop estimation is challenging in a typical year, but it is especially challenging in poor fruit set years. This is due to the greater berry and cluster weight variability that requires more attention to detail in sample collection.

My lab has been working on ways to improve crop estimation for Pinot noir growers for a decade. This work was done to improve our current methods of estimating crop, and I have shared some of that work with the industry over the years (see Additional Information below). By using day count since bud break and bloom, and heat units (growing degree-days in Fahrenheit, GDD50) accumulated after those phenological stages, we found the berry development curve was tightly related to both day count and thermal time. These relationships allowed us to develop equations for cluster weight increase factors that would help growers estimate crop yields. I had many questions come in last year about how crop estimation methods would change due to the poor fruit set, so we took advantage of the year to understand how well our model works.

In 2020, we began monitoring berry development in a new project to quantify vine physiology and growth amongst different soil types. Within that project, we monitor berry development in the same way we did in our prior work from 2011-2016, starting with cluster sampling from ~20 days post-bloom and continuing until harvest. We collected 60 Pinot noir clusters once or twice weekly. Each cluster was measured for cluster weight, berry count, berry weight, rachis weight, rachis length, berry diameter, and seed hardness.

The findings. Berry size was smaller than normal, reaching an average size of 0.85 g (+0.2 g) at harvest (Figure 1). The typical Pinot noir berry is 1.0 g at harvest. There was also more variability in berry size with many “hens and chicks” throughout the entire season. Many small berries persisted with fewer larger berries. Clusters had substantial weight variation (Figure 2) due to varying berry count and berry size per cluster. By harvest, clusters ranged from 21 berries to as many as 186 berries, with the mean size of 81 berries per cluster. Mean cluster weight was under 80 g per cluster. A few veteran grape growers and winemakers comment that small berries do not double in size, so increase factors during lag phase crop estimation need to be lower than normal. We tested this question with our data in 2020, and we found that berries still double in size from lag to harvest (Figure 1). Cluster weight also increased as usual. Berry weight plateaued at 50-60 days post 50% bloom (lag phase), and this related to a cluster weight increase factor of 1.9 by harvest. This matched our prior study findings. The increase factor refers to the number used to multiply the mean cluster weight at sampling to obtain the final cluster weight for harvest. Berries reached their full size by 90 days post-bloom, about 5-10 days later than for berries in our model from 2011-2016.

Figure 1. Pinot noir berry mass increase based on day count post mid-bloom through harvest in 2020. Data points represent berry mass from 60 clusters, and error bars are standard deviations of the mean. The error bars are difficult to see given the small berry weight in the first six sample dates.
Figure 2. Pinot noir cluster mass increase based on day count post mid-bloom through harvest in 2020. Data points represent means from 60 clusters, and error bars are standard deviations of the mean.

When the cluster weight increase factors for 2020 were compared with the model, there was strong agreement at and after 30 days (Figure 3). The one sample date at 23 days post 50% bloom was higher than the model. However, the model matched precisely for 30 days post-bloom, and all other dates had agreement at 90% or better except for the two dates closest to harvest that underestimated cluster weight by 20-30%. Often the pre-harvest cluster weights may be variable due to berry desiccation with warm weather or extended hang time. These results show that the standard procedures for increase factor determination would apply for clusters with variable set.

Figure 3. Increase factors for cluster weights at day count post 50% bloom. The 2020 data points represent the increase factor mean of 60 clusters sampled at each date compared to the mean weight at harvest on 13 Sept 2020 (n=54 clusters). The calculated values are based on an increase factor model developed by Skinkis and McLaughlin (in progress).

How to estimate yield in poor set years. An essential part of crop estimation is obtaining a representative cluster sample that represents the vineyard spatially. Good vine and cluster counts are also needed. How the cluster sample is obtained is important in any year but particularly critical to do well in a poor set year where there is more variability than normal in berries per cluster and berry weight. To ensure the best crop estimates, employ sound sampling protocols to get cluster counts per vine and cluster weights from representative vines spatially distributed throughout the vineyard block and use appropriate increase factors. If you have inadequate sampling procedures (not enough clusters and not well distributed spatially), you can expect that your estimations will be even more variable and likely less accurate. I do not recommend a certain number of clusters, as it will vary by your vineyard size and level of variability. However, it should be a large enough sample to explain variability across the vineyard block accurately. Keep notes on your methods and be sure to train those who are sampling to follow those methods.

If you wish to use the OSU increase factor equations this year, contact Dr. Patty Skinkis, Professor and Viticulture Extension Specialist, OSU at patricia.skinkis@oregonstate.edu.

Additional Information

Skinkis, P. 2017. Crop Estimation: It’s all about timing and good data. Oregon Wine Research Institute Vine to Wine Newsletter, July 2017.

Skinkis, P. 2019. Improved Crop Estimation Methods for Oregon Pinot Noir. Oregon Wine Symposium, Portland, OR (seminar video).

Developing a new methodology for marker-free gene editing in grapevine

Dr. Laurent Deluc, Associate Professor, Department of Horticulture, Oregon State University

In March 2018, the U.S. Department of Agriculture (USDA) released a statement that they will not regulate plants modified through genome editing. Gene editing, the most popular being the CRISPR/Cas9 system, holds enormous promise for the development of accelerated breeding programs focused on the release of improved plant materials. A current significant focus is to identify grapevine material resistant or tolerant to extreme environmental conditions like drought, cold, and heat. Another research avenue is to generate new material resistant to major pests and diseases like Powdery and Downy Mildew and Botrytis. The wine grape industry may benefit from this federal decision to breed future elite cultivars more amenable to abiotic and biotic stresses. Unfortunately, the generation of transgenic plants is, in most cases, necessary to conduct the gene editing. This results in integrating bacterial-related sequences in the plant genome, making the engineered materials labeled Genetically Modified Organisms. Because of the GMO’s poor acceptance, there is a need to identify new methods to deliver gene-editing components to the plants without inserting “foreign DNA” in the targeted plant genome. The grapevine commodity will then fully benefit from the outstanding potential of gene-editing technology for genetic improvement.

Delivering a Ribonucleoprotein (RNP) like the protein Cas9 complexed to an RNA molecule to intact plant cells could be a very innovative solution for accepting the gene-editing technology for many crops. The RNP delivery has been tested for years in animal cells (Ramakrishna et al. 2014). In grapevine, initial studies to deliver the RNP are to date mostly limited to “naked” plant cells (protoplasts) (Malnoy et al. 2016). Unfortunately, grapevine plant regeneration from protoplasts has yet to be optimized. The physical delivery of the RNP to regenerable plant tissue (material from which you can regenerate a plant) will be significant to fully maximize gene editing applications for the grapevine. Though, the RNP complex will have to deal with a substantial barrier, the cell wall. The cell wall is an integral component of plant cells. It performs many essential functions, including, but not limited to, the shape and strength of cells, the protection against physical shocks, the control of cell expansion, the transport of substances between and across the cell, and a barrier between the interior cellular components and the external environment. A plant cell wall’s structure and composition are complex, tissue-specific, and vary over time, making a pretty complicated structure to be crossed. Nanoparticles were shown to deliver different molecules (DNA, RNA, and protein) in mammalian cells. In plant cells, their use in agriculture begins to gain more attention with relative success to deliver different molecules in normal plant cells containing cell walls.

The scientific community currently pays much attention to a particular class of nanoparticles, the Cell-wall Penetrating Peptide (CPP). Compared to other nanoparticles like gold or silicone particles, they tend to be much less cytotoxic to the plants. They can help deliver large cargo molecules like protein, DNA, and RNA (Numata et al. 2018). It consists of short peptide sequences (5 to 30 amino acid residues) that facilitate the cargo’s penetration through the cell membrane. Recent studies have demonstrated CPP’s efficacy to penetrate intact plant cells (Numata et al. 2018). The development of methodology for CPP-mediated delivery of a CRISPR/CAs9 system to a regenerable grapevine plant material will then be a game-changer because it will align with the pursuit of generating edited grapevine material that is GMO-free.

In our lab, we have developed two research projects to examine the efficacy of several CPPs to deliver the CRISPR/Cas9 complex. In our lab, we have generated transgenic lines that express the Green Fluorescent Protein (GFP) ectopically. As proof of concept, we tested the penetration efficiency of various CPPs to deliver a RNP to knock out the GFP gene expression. Preliminary results are promising, but they need reproducibility. We are currently designing experiments to improve the penetration efficiency rate of several tested CPPs.

Consideration and conclusions:
The discovery of CRISPR/Cas9 for more than ten years has dramatically opened new perspectives for advancing fundamental knowledge and genetic improvement in plant sciences and breeding. As a major crop in the U.S., Grapevine will benefit from its technology tool to develop innovative and accelerated breeding programs. Introducing new performance traits into existing cultivars is a major quest for the grapevine industry. The resistance to major fungal and bacterial pathogens is often cited as essential traits for which conventional breeding and traditional biotechnology (genetic transformation) may not be suitable. The development of a new methodology to create gene-edited material that is marker-free is an attractive alternative to time-consuming breeding programs. Likewise, the application of synthetic biology via precise gene editing is of particular value for crop production. One significant example for synthetic biology is the editing of DNA regions involved in inducing or repressing gene expression, the promoter region. Gene editing of promoter regions can generate plant materials for which the expression of multiple genes associated with a particular cellular process and/or a trait could be modulated at a given time. Chemically inducible systems are fundamental tools in modern agriculture with many potential uses to control plant growth. For better public acceptance, this will require the generation of scarless precise genome-edited material of the promoter regions. The public will likely accept an editing process that is transgene-free and does not affect plant proteins’ integrity.

This work is currently funded by the Oregon Wine Board, the Erath Family Foundation, and a forthcoming USDA-National Institute of Food and Agriculture award.

Literature Cited

Malnoy M, Viola R, Jung M-H, Koo O-J, Kim S, Kim J-S, Velasco R, Nagamangala Kanchiswamy C. 2016. DNA-Free Genetically Edited Grapevine and Apple Protoplast Using CRISPR/Cas9 Ribonucleoproteins. Front Plant Sci 7:1904. DOI: 10.3389/fpls.2016.01904

Numata K, Horii Y, Oikawa K, Miyagi Y, Demura T, Ohtani M. 2018. Library screening of cell-penetrating peptide for BY-2 cells, leaves of Arabidopsis, tobacco, tomato, poplar, and rice callus. Scientific Reports 8:10966. DOI: 10.1038/s41598-018-29298-6

Ramakrishna S, Kwaku Dad A-B, Beloor J, Gopalappa R, Lee S-K, Kim H. 2014. Gene disruption by cell-penetrating peptide-mediated delivery of Cas9 protein and guide RNA. Genome Res 24:1020-1027. DOI: 10.1101/gr.171264.113

Can you trust your pH meter?

Dr. James Osborne, Associate Professor and Enology Extension Specialist, Dept. Food Science & Technology, OSU

The pH meter is arguable the most important piece of laboratory equipment you have in your winery. It is used for many routine analyses such as pH, titratable acidity, and as part of the analysis of volatile acidity. Accurately knowing your grape and wine pH is also critical in the management of microbial stability. Spoilage microorganisms such as Pediococcus and Brettanomyces are less acid-tolerant than beneficial microorganisms such as Saccharomyces cerevisiae and Oenococcus oeni. Lower pH, lower microbial spoilage risk; higher pH, higher microbial spoilage risk. Furthermore, there is a key relationship between pH and free SO2. At lower pH, a greater proportion of free SO2 is present as molecular SO2, the most effective antimicrobial form of SO2. Because of this, free SO2 concentrations should always be evaluated in conjunction with pH when considering target SO2 levels. A pH meter will provide you with a pH value, but how do you know that the value is accurate? The consequences of using a pH meter that is not functioning properly can be significant. For example, an inaccurate pH meter may lead to over or underestimation of SO2 additions needed to achieve a target molecular SO2 concentration and/or what acid adjustments are required pre- or post-fermentation. 

So how can you ensure you are getting accurate and reliable results from your pH meter? Firstly, make sure you are using an appropriate pH electrode probe for grapes and wine. Not all pH electrode probes are suited to the unique physical and chemical composition of grape juice and wine. Many manufacturers have pH probes specific for grape and wine analysis, ensuring you are using the right tools for the job. Secondly, instigate a regularly scheduled calibration schedule in the winery lab. It should be standard practice to perform a calibration the first time the pH meter is used for the day. A logbook kept by the pH meter can be used to keep track of when calibration has been conducted and the result. If you have multiple people using the pH meter, they can quickly see when the last calibration occurred and know whether calibration is needed. Keeping track of the calibration results can help indicate if the probe may need to be cleaned or other reoccurring issues. Typically, you will have a small vial of each buffer for the calibration. These vials of buffer should be regularly changed out for fresh buffer solutions bi-weekly or monthly, depending on how often you use them. Make sure the buffers you are using match the built-in calibration set points for your pH meter. Most commonly, you will be using pH 4.0 and 7.01 set points, but some pH meters use pH 3.0 and 7.01. A buffer of 10.01 can also be used as a third calibration point, although in wine, you will be mainly measuring between pH 3.0 and pH 4.0, so this is where the greatest accuracy is required. The slope should be within ± 5% of the ideal (100%), while ± 10% or greater is considered out of range. Make sure you store the probe in an electrode storage solution (typically a KCL solution). A dried-out probe slows the exchange of ions between the probe and the solution you are measuring and results in false readings. Do not store in water or pH 7.01 buffer as this will result in leaching of the electrolyte solution from the pH probe. Some pH probes allow re-filling of the electrolyte solution, so keep an eye on this level if this is the case and re-fill when necessary (see manufacturers recommendations).

If you are starting to see pH drift and/or calibrations are challenging to conduct or have low accuracy, your pH probe may need cleaning. The build-up of grape and wine deposits on the outside of the pH probe bulb will cause fouling of the membrane and interfere with the interaction of ions in your juice/wine and the electrolyte solution. During heavy use, it may be necessary to clean your pH probe weekly or bi-weekly. This involves soaking the probe in a probe cleaning solution (often provided by probe manufacturers) for 30-60 minutes, followed by rinsing with DI water. This will improve the accuracy of your data as well as extend the life of your pH probe. Keep track of when cleanings occur in your pH meter logbook. By following a regular calibration and cleaning schedule for your pH meter/probe, you can ensure reliable and accurate pH data and improve the lifetime of the probe.

A bright idea? Ultraviolet light as an integrative pest management tool for grape powdery mildew

Alexander Wong, Graduate Research Assistant, Dept. of Botany and Plant Pathology, OSU
Dr. Walt Mahaffee, Research Plant Pathologist, USDA-ARS and FRAME Networks group (USDA-NIFA-SCRI)

The concerning emergence of fungicide resistant grape powdery mildew (Erysiphe necator) to numerous fungicides (Beresford et al. 2016; Cherrad et al. 2018; Colcol et al. 2012; Colcol and Baudoin 2016; Kunova et al. 2016; Miles et al. 2012; Wong and Wilcox 2002) has led to a need for new integrative pest management strategies in grape production. Ultraviolet spectrum C (UVC) radiation has been used for over a century to kill or disable microorganisms by damaging their DNA. However, prolonged exposure times have been required because the microbes have very efficient DNA damage repair machinery (Beggs 2002). A recent discovery (Janisiewicz et al. 2016; Suthaparan et al. 2016) showed that this machinery is shut off at night to conserve energy, which indicates that UVC light applied at night might be effective with shorter exposure times (e.g., strawberry powdery mildew (Onofre et al. 2019), and wheat powdery mildew spores (Zhu et al. 2019)). In collaboration with David Gadoury at Cornell University and Michelle Moyer at Washington State University, we began testing whether UVC could be used to manage grape powdery mildew and bunch rot this past growing season.

Our research tests were conducted in a 22-year-old block of vertical shoot positioned (VSP) trellised Pinot noir trained at the OSU Botany and Plant Pathology Farm in Corvallis, Oregon using an over-canopy array of UVC light banks (Figure 1). UVC treatments were applied once per week, one hour after sundown at a speed of two or three miles per hour, which relates to a theoretical dose of 120 and 80 joules per square meter (J/m2), respectively. We also applied fungicide programs to subplots within rows of 5 lb/A sulfur on 7- to 14-day intervals, 10 fl oz/A Azoxystrobin on a 14-day interval, an alternation of sulfur and a QoI on a 14-day interval, or untreated control. Powdery mildew incidence ratings were performed every other week starting in mid-May and ending at veraison with leaf and cluster mildew severity ratings completed just before veraison. Grape powdery mildew leaf incidence was significantly (TukeyHSD, p < 0.05) reduced with weekly UV treatments (Figure 2). The UVC treatments did not lead to a significant reduction of mildew severity on clusters, mildew colonies, or rater’s gloves to monitor the amount of mildew (Thiessen et al. 2016) and presence of QoI resistance of each of the plots (Miles et al. 2020).

Botrytis cluster disease severity and incidence was measured at harvest after incubating clusters for 48 hours at 68°F and high humidity. There was no significant difference in Botrytis incidence between treatments. Due to the heavy mildew pressure, many of the clusters with high mildew severity had clusters too desiccated or decayed at harvest to be colonized by Botrytis. Botrytis isolates collected from diseased clusters are being tested for fungicide resistance.

These results suggest that UVC treatments, in conjunction with fungicide programs, has the potential to improve disease management of grape powdery mildew, but the frequency or dose of the application need to be increased. Future field studies at the BPP field site will examine increasing dose and/or UVC application frequency. In collaboration with Willamette Valley Vineyards and Saga Robotics, we will begin exploring the use of an autonomous drive base to apply the treatments on a commercial vineyard scale. Using UVC as part of an integrative pest management tool for powdery mildew will hopefully reduce costs and environmental impacts of disease management by reducing the amount of chemical inputs for disease control.

Figure 1. The tractor mounted UVC array in operation.

Figure 2. Area under disease progress curve for the powdery mildew epidemic based on foliar mildew incidence ratings. Error bars represent the standard error of the mean.

Literature Cited

Beggs CB 2002. A quantitative method for evaluating the photoreactivation of ultraviolet damaged microorganisms. Photochem Photobiol Sci 1:431-437.

Beresford RM, Wright PJ, Wood PN and Agnew RH. 2016. Sensitivity of grapevine powdery mildew (Erysiphe necator) to demethylation inhibitor and quinone outside inhibitor fungicides in New Zealand. N Z Plant Protec 69:1-10.

Cherrad S, Charnay A, Hernandez C, Steva H, Belbahri L and Vacher S. 2018. Emergence of boscalid-resistant strains of Erysiphe necator in French vineyards. Microbiol Res 216:79-84.

Colcol JF and Baudoin AB. 2016. Sensitivity of Erysiphe necator and Plasmopara viticola in Virginia to QoI Fungicides, Boscalid, Quinoxyfen, Thiophanate Methyl, and Mefenoxam. Plant Dis 100(2):337-344.

Colcol JF, Rallos LE and Baudoin AB. 2012. Sensitivity of Erysiphe necator to demethylation inhibitor fungicides in Virginia. Plant Dis 96(1):111-116.

Janisiewicz, WJ, Fumiomi T, Glenn DM, Camp MJ and Jurick WM. 2016. Dark period following UV-C treatment enhances killing of Botrytis cinerea conidia and controls gray mold of strawberries. Phytopathology 106(4):386-394.

Kunova A, Pizzatti C, Bonaldi M and Cortesi P. 2016. Metrafenone resistance in a population of Erysiphe necator in northern Italy. Pest Manag Sci 72(2):398-404.

Miles LA, Miles TD, Kirk WW and Schilder AMC. 2012. Strobilurin (QoI) resistance in populations of Erysiphe necator on grapes in Michigan. Plant Dis 96(11):1621-1628.

Miles TD, Neill T, Colle M, Warneke B, Robinson G, Stergiopoulos I and Mahaffee WF. 2020. Allele-specific detection methods for Qol fungicide resistant Erysiphe necator in vineyards. Plant Dis.

Onofre RB, Ortiz GA, de Mello Neto PP, Gadoury DM, Stensvand A, Rea M, Bierman A and Peres N. 2019. Evaluation of UVC for suppression of powdery mildew and other diseases of strawberry in open field production. In Technical Abstracts for the American Phytopathological Society (APS) Annual Meeting, Plant Health 2019. Cleveland, OH.

Suthaparan A, Solhaug KA, Stensvand A and Gislerød HR. 2016. Determination of UV action spectra affecting the infection process of Oidium neolycopersici, the cause of tomato powdery mildew. J Photoch Photobio B 156:41-49.

Thiessen LD, Keune JA, Neill TM, Turechek WW, Grove GG and Mahaffee WF. 2016. Development of a grower-conducted inoculum detection assay for management of grape powdery mildew. Plant Pathol 65:238-249.

Wong FP and Wilcox WF. 2002. Sensitivity to azoxystrobin among isolates of Uncinula necator: baseline distribution and relationship to myclobutanil sensitivity. Plant Dis 86(4):394-404.

Zhu M, Riederer M and Hildebrandt U. 2019. UV-C irradiation compromises conidial germination, formation of appressoria, and induces transcription of three putative photolyase genes in the barley powdery mildew fungus, Blumeria graminis f. sp. hordei. Fungal Biol 123(3):218-230.

Understanding the Economic Consequences of Smoke Events for the Oregon Wine Industry

James A. Sterns, Associate Professor, Applied Economics, OSU, jasterns@oregonstate.edu

With genuine concerns for the loss of life and property during this time of still-burning wildfires, I am also challenged by questions about the economic consequences of these fires for Oregon’s wine industry. With most grapes still in the vineyard, the potential for significant loss of this year’s harvest weighs heavily on vineyard managers throughout the state. The short-run answer, unfortunately, is frustratingly vague. It’s like I am trapped in an NPR radio broadcast of Michael Feldman’s comedy quiz show, Whad’Ya Know? Each episode begins with the show’s namesake and host asking his live audience that question, to which the audience replies in unison, “Not much!” 

This article has two goals – first, summarize and provide links to the limited amount of information that is available; and second, to outline suggestions for creating the necessary records, data sets and documentation that will allow us to be better positioned to answer questions about the economic consequences of future smoke events.

First, what do we know? Several websites provide one-stop sourcing of available information. These include the Oregon Wine Board Wildfire Smoke Toolkit webpage and the University of California-Davis Wildfire and Smoke Exposure Resources website. Another comprehensive source of information is available from the Australian Wine Research Institute, which has been very active in recent years in supporting research on how smoke events can affect wine grapes and wine making.

These and other sources (reference links throughout this article) help frame questions about the overall consequences of smoke events. Still, in general, economic impacts are not addressed in any detailed manner. That type of substantive research-based information is still needed. As Associate Professor Elizabeth Tomasino and her colleagues reported in the August 2020 Vine to Wine issue, plans are in the works for grant-funded research on this topic. Their first step was to conduct a needs assessment with industry stakeholders, which included a shortlist of research topics related to smoke events’ economic impacts. As that research moves forward, one of the key constraints will be the availability of data from Pacific Northwest vineyards and wineries. Vineyard managers and wine makers can help resolve this ongoing challenge. Here are a few suggestions for how to help by documenting what is happening now and keeping records of this information for future reference.

Data needs for Estimating Economic Consequences in Vineyard and Wineries:

Weather & Air Quality Data – Keep track of your local smoke event data, which may be simple observational data (e.g., dates and duration of when you can smell smoke in your locality). Alternatively, some vineyards may have contracted with private farm management service providers, and in some instances, these providers have installed weather sensors. If this is the case, then the key is to archive in an easily accessible database detailed daily wind, temperature, humidity, and air quality readings as site- specific as possible. Understanding “trigger” levels of exposure that lead to smoke compounds in wines can become the basis for future vineyard management decision making. This starts with our ability to link vineyard conditions with test results of smoke contamination in wine crushes.

Variable, Fixed, and Total Costs – I often ask my students if it is ever a good idea to keep farming when losing money. I am trying to have them understand that a decision to go idle for a season or not harvest a crop will still have fixed costs to be paid. The choice to lose money is relative, so the better question a manager needs to ask is, “Which option will involve the least amount of loss?” In terms of this year’s grape harvest, can a vineyard manager hope to make enough from a harvested crop to cover all the variable costs associated with that harvest plus cover some of the fixed expenses that will always need to be paid? If so, then that’s the better choice. If the harvested crop’s value is less than the sum of variable costs of harvesting it, then obviously, it’s better not to harvest. In terms of data to be tracked, keeping detailed estimates of fixed and variable costs will not only help with decisions that must be made now, but also this financial information can be evaluated in a broader context for future smoke events. If enough vineyards track these costs, that data could be collected and aggregated anonymously, and then financial benchmarks could be established for making more informed decisions in years to come.

Dump, divert, or distill – A current recommendation for vineyard managers is to conduct small lot fermentations (a.k.a. micro-ferments or bucket-ferments) on grapes that have been exposed to smoke. Should results from these tests indicate that the grapes are unusable for wine, there are still managerial decisions to make. Once again, cost and price data are needed to inform this decision. Option one is to dump the grapes in the vineyard, either in the near future, or possibly waiting until pruning. Both options have vineyard management issues, but also economic ones. For example, what are the labor (and possibly machine costs if mechanically harvested) to dump the grapes now compared to potentially higher pruning labor time and costs if the grapes are left on the vine until then? Another possibility – grapes have nutritional value as animal feed. Could harvested grapes be sold to a neighboring livestock operation? And more importantly, what is the price the neighbor is willing to pay and is that price high enough to cover harvesting costs? A third option might be to use the grapes for distilling alcohol for the hand sanitizer market – a new market opportunity that has emerged during the COVID-19 pandemic. Again, the critical issue is the potential market value of the smoke-affected grapes for use as an input in this alternative product market.

Market responses, on inventory and current year crop – Another key area of data to track will be the market responses to these wildfire events. Two prices to track and record will be the value of any residual 2019 harvest in inventory, such as bulk wine. If this year’s smoke events leave wine makers shy on volume, will this lead to a price increase in the value of that inventory? If so, that is an economic consequence to document. Similarly, depending on the severity of this year’s smoke event, grapes grown in 2020 that are unaffected by smoke may see a price increase. Again, documenting any smoke-event driven shifts in prices will be critical for future work in estimating economic consequences.

Consumer responses, on-site and online – The COVID-19 pandemic complicates the analysis, but there still needs to be data collected about how winery customers are responding to the wildfires. On-site tasting room visits, which were already diminished by social distancing and other public health measures, will be further eroded by the wildfires. Collecting data on declines in visitations attributable to the wildfire will help future analyses. Similarly, tracking online sales, especially if consumers are shifting their buying habits, is also needed. Will consumers buy more of the current inventory in fear of future shortages? What are wine club members asking you during this time? Tracking their concerns and questions may be early indicators of how future sales of the 2020 vintage will be impacted. Aggregating these data, even if the overall effect on demand is negligible, will provide vital information for future analysis and forecasts of smoke events’ economic consequences.

Insurance Costs and Compensation – A final area of data that is needed concerns crop insurance. Data on insurance premiums paid by vineyards are needed. Even if a vineyard or winery opted not to purchase crop insurance, records of insurance companies’ quotes for proposed premiums are valuable for future analysis. Also needed are the costs of checking for potential, and if needed, proof of damage (e.g., costs of testing for smoke compounds and any other expenses of documenting the damage and certifying rejected sales). Finally, records about the amount of financial compensation received, should an insurance claim be paid will be important for future economic analysis. This should include any details about factors that affected the overall level of compensation (for example, some insurance policies will adjust claims and reduce the amount of payment if a vineyard is not harvested).

As we look to the future, we can anticipate a need for a better understanding of how wildfires and smoke events can affect the Oregon wine industry’s economic viability. Tracking and recording what is happening now, as decisions are being made in vineyards and wineries, will be vitally important sources of information for future research. With resiliency, the Oregon wine industry will emerge from the tragedies of this wildfire season. Let us work together to ensure that we can do better in the future by learning through our current adversities.

Avoid mixing biologicals with antimicrobials

Dr. Jay W. Pscheidt and Lisa Jones, Dept. of Botany and Plant Pathology, Oregon State University

Actinovate AG (Streptomyces lydicus WYEC 108) and many other biological products are used in the management of organic grapes. Tank mixing more than one product is both economical and time-saving but tank mix compatibilities with biological control products such as Actinovate have not been thoroughly evaluated. In 2016, we examined the tank mix compatibility of Actinovate AG with commonly used organic products.

Actinovate AG was prepared at a concentration of 0.1g/ml. A 300 ml solution of Actinovate was prepared in a 500 ml beaker then mixed with each material and allowed to stand for 30 minutes. The mixture was then plated onto agar and incubated for 7 days at room temperature. The number of colony-forming units (CFU) of S. lydicus exposed in each mix was assessed daily and compared to an Actinovate plus water only control. The percentage of S. lydicus CFU in each tank mix compared to the CFU in the Actinovate control was calculated.

An average of 3.2×10⁵ S. lydicus CFU developed after 7 days incubation on the various media when Actinovate was just mixed with water. Several products inhibited the growth of S. lydicus when prepared in as a mixture in the laboratory. No growth of S. lydicus was observed on plates when Actinovate was mixed with Horticultural Vinegar, a high rate of Regalia, Rex Lime Sulfur, Serenade Optimum, or Solubor DF. Less than 10% of the S. lydicus CFU grew when Actinovate was mixed with Biomin Calcium, Botector, Neptune’s Harvest 2-4-1 fish fertilizer, or Thuricide. Significantly fewer S. lydicus CFU grew when Double Nickel, the low rate of Regalia, Serenade Max, the high rate of Stimplex or Toggle were mix with Actinovate. There was no significant difference in the number of S. lydicus CFU that grew when Zen-O-Spore was mixed with Actinovate. The number of S. lydicus CFU was greater than double (219%) or quadruple (482%) that of the Actinovate control when mixed with Nitrozyme or the low rate of Stimplex, respectively.

Many of the biological products in this study grew quicker than S. lydicus under laboratory conditions. These fungi or bacteria generally outcompeted S. lydicus for space and resources on the agar plates. The fungus found in Zen-O-Spore was slower to grow and did not outcompete S. lydicus during the 7-day incubation.

This data does not imply a lack of or enhanced disease control in the field. For example, blueberry field trials over a 2-year period where Actinovate was mixed with Simplex did not result in disease control that was different than when either product was used alone. The data does indicate incompatibility between various products used in organic production.

For a complete data set please visit: http://sites.science.oregonstate.edu/bpp/Plant_Clinic/Fungicidebooklet/2016/Blueberry3.pdf

What’s New with Malolactic Fermentation

Dr. James Osborne, Associate Professor and Enology Extension Specialist, OSU

The malolactic fermentation (MLF) is a vital step in the production of cool climate red wines as well as some white wines. But despite its importance, MLF often gets taken for granted and just considered a step to reduce wine acidity. However, MLF is much more than just a biological de-acidification process and can have a number of other impacts on wine quality. Our lab has been conducting a number of projects over recent years investigating various aspects of MLF. One project is investigating interactions between Oenococcus oeni and the spoilage yeast Brettanomyces bruxellensis. An interesting result from this study was discovering that some O. oeni strains were capable of increasing the concentration of the volatile phenol precursors p-coumaric acid and ferulic acid. These pre-cursor compounds are found in grapes and wine mainly bound to a tartaric acid and in this form are not utilized by Brettanomyces. However, some O. oeni strains can remove the tartaric acid through the action of an enzyme, cinnamic esterase, and release free p-coumaric and ferulic acid that Brettanomyces can then metabolize to 4-ethylphenol and 4-ethyl guaiacol. This finding has led to the labelling of many commercial O. oeni strains as either cinnamic esterase (+) or (-) with the recommendation being to avoid use of cinnamic esterase (+) strains in situations where the wine may be at risk for Brettanomyces spoilage.

An additional area of research has been determining the effect of MLF on red wine color. We know that MLF changes wine pH which can cause a shift in red color, but were there other impacts on color due to MLF? Our lab demonstrated that independent of pH change, MLF results in a loss of color and lower formation of polymeric pigments. Results from a number of studies showed that this color loss was likely due to the metabolism of acetaldehyde by O. oeni. Acetaldehyde plays a key role in the development of polymeric pigments and so metabolism of acetaldehyde during MLF reduced formation of these color compounds. Delaying MLF was shown to help mitigate this color loss but delaying MLF for long periods is risky from a microbial spoilage point of view, as SO2 cannot be added to the wine until MLF is complete. Additional strategies to mitigate color loss due to MLF are currently being explored. One such strategy is the use of ML bacteria that do not metabolize acetaldehyde. To date, all O. oeni strains screened can metabolize acetaldehyde but other lactic acid bacterial species such as Lactobacillus look more promising. There has been renewed interest in using certain Lactobacillus species and strains to conduct MLF. In particular, homofermentative species of Lactobacillus have been studied as potential ML starter cultures. These bacteria do not produce acetic acid from glucose metabolism and so could be used for conducting concurrent alcoholic and malolactic fermentations without the risk of increased acetic acid. Currently, there are commercially produced L. platarum cultures available outside of the USA for use in winemaking. However, at this time these cultures are not available for winemaking use in the USA. The use of concurrent alcoholic and malolactic fermentation is one final area our lab has been studying. While there are obvious time advantages to conducting alcoholic and malolactic fermentation at the same time, there are still some concerns over the impact on wine quality, particularly for red wines. We recently completed a study investigating how the timing of MLF impacts Chardonnay aroma and mouthfeel and will be continuing work in this area focused on concurrent fermentations of red wines. As we continue to study malolactic bacteria, we are gaining a better appreciation for the impact they can have on wine quality and potential new strategies for their use. For additional information on any of the studies we have conducted on MLF please contact me at: james.osborne@oregonstate.edu