Category Archives: Science Background

A First Look at the Data

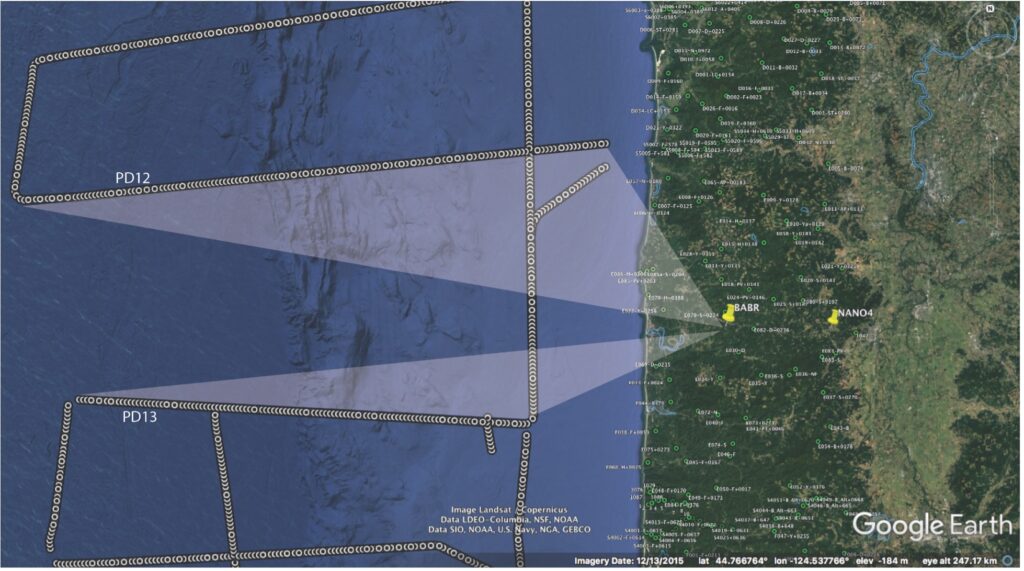
Although the data from the nodes must be downloaded at the IRIS/PASSCAL instrument center (a national facility that provides seismological instrumentation to universities throughout the US for experiments around the globe), we can get a first look at the data by processing the data recorded on stations from the Pacific Northwest Seismic Network (PNSN) and on 5 temporary stations that were provided for this experiment by Nanometrics Inc. An example of data from two different offshore lines (PD12 and PD13) as recorded on PNSN station BABR is very promising. Sources along these two offshore lines travel a different path to the station, as shown by the triangles on the map.

The map shows the Cascadia2021 experimental layout. The small green dots onshore represent the locations of all the nodes that were installed for this project.  Every 30th offshore source is shown by a circle. Stations discussed in this blog entry are indicated by yellow pins. The seismic energy from each offshore source follows an approximately straight line from the source to the station, penetrating farther into the subsurface with increasing distance between the source and receiver. Triangles on the map show the region imaged by sources along PD12 and PD13 as recorded on station BABR.
The image shows seismic record sections of the data from offshore lines PD12 and PD13 as recorded by PNSN station BABR. To construct these record sections, data were extracted from the continuous data based on the source times logged by the ship; the distance between the source and the seismometer was also calculated and associated with the data during this step of the processing. Both the ship and the onshore seismometers must record time very precisely because time differences of a small fraction of a second can represent large differences in subsurface structure. For this display, seismograms were filtered with a bandpass of 8-30 Hz.  The seismograms were then aligned side by side and displayed as a column of colored pixels as a function of time measured from the time of the source. Numbers above every 3rd tick mark along the top of the record sections on the left are the calculated distance between the source and the seismometer every 600th seismogram; on the right, distance labels are 200 seismograms apart. Before being added to the image, each seismogram was shifted by an amount equal to the source-seismometer distance divided by 8 km/s.  We chose 8 km/s for these displays because it visually separates waves traveling with a speed > 8 km/s through the upper mantle below the crust (labeled Pn), which has a negative slope on this display, from those traveling through the crust (labeled Pg), which generally have a positive slope. Local departures from this rule are due to changes in seafloor depth or local structural variations.   Wave that bounce off the base of the crust (labeled PmP) have both negative and positive slopes and are characterized by very large amplitudes at a distance that is very sensitive to the structure in the region of the bounce point.
The cartoon illustrates the paths along which these seismic “phases” travel through the subsurface. On the left is a cross-section into the earth showing the paths taken by seismic phases that travel through the crust (Pg), that bounce off the base of the crust (PmP) and that travel through the mantle beneath the crust (Pn).  The red dashed line represents the boundary between the subducting Juan de Fuca plate and the edge of the North American plate.  On the right is a diagram showing how we can use PmP arrivals to map the topography of the base of the crust.  While PmP is the strongest reflection we expect to see in the data, we hope to also observe reflections from the plate boundary.  Pg arrivals will provide information on structures within the North American plate, including the depth of basins that affect the pattern of ground shaking.  Pn arrivals provide information on the mantle beneath the crust as well as on the crust through which they pass to get to the mantle.  Complex subsurface structure can be deduced from many overlapping paths using computer analyses similar to those used to image in the human body

For an animation of the process of extracting information on subsurface structure from seismic data, see this short video from IRIS.

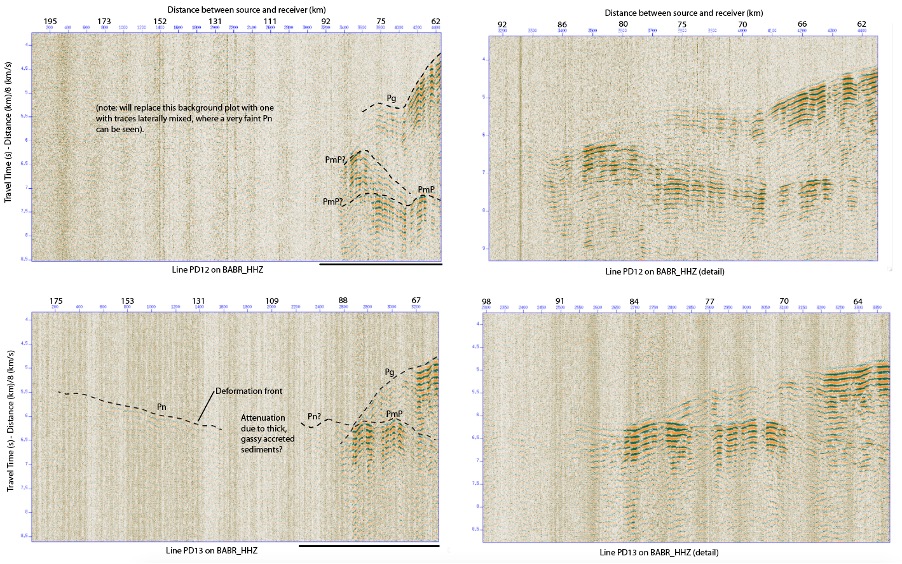
If the crustal structure were uniform along this portion of the Cascadia margin, the data from the two lines would look the same at this station.  However, we see that they are quite different, indicating that there are 3-D structural variations in the subsurface. Some of the differences to note include:

  1. Different amplitude of the weak energy arriving from very distant shots labeled Pn in the data.  These are arrivals that travel in the uppermost mantle below the crust. These arrivals are observed without the need to smooth data laterally on both BABR and NANO4 for sources along PD13. They are present but much fainter on these stations for source along PD12, indicating either that the sediment overlying the subducting plate along PD12 attenuates the energy more strongly than along PD13 or that differences in(?) deep structure leads to attenuation of the energy. 
  2. The first arrival patterns show inflections in a different place for the two source lines, signaling structural difference in the upper plate.  These will be mapped into a 3-D model using first arrival tomography, a mathematical approach to processing and interpreting these data that is analogous to a CAT scan. 
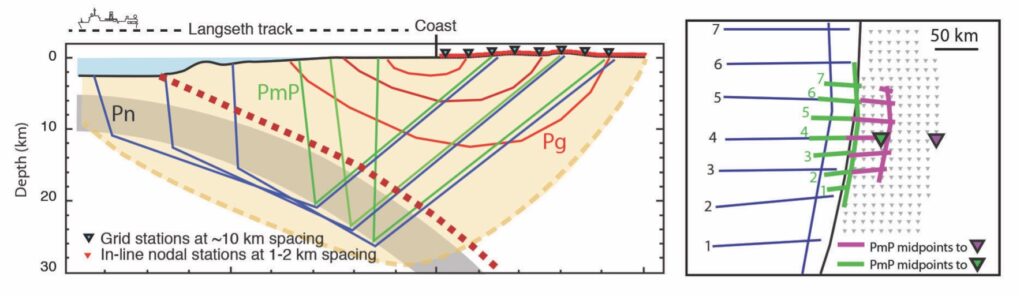
  3. Strong Pg and PmP arrivals in the source-to-seismometer distance range of 60-90 km, which represents energy sensitive to plate boundary structure in the region where great earthquakes originate.
  4. Possible bifurcation of PmP into two waves with different arrival times for sources along PD12. This could be due to complex 3-D crustal structure. Analysis of the entire data set is need to test this hypothesis. 

Similar patterns are seen on NANO4, indicating that these differences are due to regional variations rather than to local site effects.  Somewhat different patterns are seen for these two lines of sources on other stations in this region, providing information that will be mapped into structural variation as analysis proceeds.  Spot checks of PNSN stations in SW Washington (PNSN station RADR) and near the Oregon/California border (PNSN station KBO) indicate that the observations in the northern and southern parts of the onshore network are very different from those in the middle, signaling large variations in the dip of the subducting plate and the composition of the upper plate beneath Cascadia. 

The data shown here represent less than 0.01% of the entire data set, and all the data have to be processed, modeled and interpreted.  We anticipate that these results will lead to significant refinement of the depth and character of the subducting slab. This is important because studies of subductions zone elsewhere that have experienced great earthquakes in recent years suggest that the geologic characteristics of the plate boundary and adjacent plates exert a strong influence on the rupture process of great earthquakes, which in turn affects the pattern of strong ground shaking and other hazards, such as landslides, that result from the shaking. 

-Anne Tréhu


The Cascadia Subduction Zone

The Cascadia Subduction Zone, or CSZ, runs from Northern Vancouver Island in BC, Canada to Cape Mendocino in California. A subduction zone is created when one tectonic plate sinks and slides, or subducts, below another tectonic plate. Usually, this occurs with a dense oceanic plate subducting below a less dense continental plate. In the case of the CSZ, the Juan de Fuca plate is sinking below the North American plate. The Juan de Fuca plate is located in between the Pacific plate and the North American plate, making up the ocean floor along the coastline. The Juan de Fuca plate is being pushed towards the North American plate by a mid-ocean ridge between itself and the Pacific plate. A mid-ocean ridge is where new material in the form of magma is being pushed to the surface, causing the ground on either side to spread. The Juan de Fuca plate is a remnant of a much larger plate that is gradually disappearing as subduction, which is driven primarily by gravity pulling down on the dense subducting plate, overtakes spreading from the ridge. Further south, the ridge has subducted entirely and the Pacific plate has come into contact with the North American plate, creating the San Andreas fault system.

Map of the Cascadia Subduction Zone outlining the plate motions, as well as the location of subduction zone earthquakes (Map graphic courtesy Wash. Dept. of Natural Resources).

When one plate slides beneath another, it’s not a smooth process. The weight of the overlying plate wedge generates a lot of friction, which will lock the plates together until the frictional forces are overcome. An earthquake occurs when plates overcome friction in a certain location, allowing stress to be released and the plates to slip past one another. These slips can be slow or fast, small or large. Subduction zone earthquakes are located along the line of subduction, where the most severe slipping can occur. Here, the plates are strongly locked by friction, building up stress until there is a large release in the form of a megathrust earthquake. Topography on the subducting plate, sediments and fluids trapped between the plates, and the geology of the upper plate all vary along and across the plate boundary and affect the frictional stress on the plate boundary. All of these factors make predicting earthquakes extremely difficult.

Earthquakes also occur deeper down within the subducting Juan de Fuca plate or shallower within the North American plate. At greater depth along the plate boundary is a transitional zone, where there are distinct episodes of slow slip accompanied by seismic tremor. During a slow slip event, the Juan de Fuca plate will move a few cm past the North American plate over a period of a few weeks. These motions are imperceptible to all but the most sensitive GPS instrumentation. However, they relieve stress between plates just like megathrust events. At still greater depth, the plates move past each other continuously because of the impact of high temperature and pressure on the plate boundary. Processes deep within the subduction zone are also responsible for the beautiful Cascade volcanoes.

Because stress builds up gradually over time, large earthquakes do not occur often. The last megathrust earthquake on the CSZ was in 1700. Based on geologic evidence, earthquakes like this have recurred every 400 to 600 years. This suggests that we are due for a megathrust event in the next hundred years or so. The timing and size of this expected earthquake, however, is impossible to predict with our current understanding. Observations from megathrust earthquakes around the globe suggest that at least some earthquakes had subtle precursors that were not previously recognized because of inadequate data. A better understanding of the mechanisms causing such precursors may eventually improve earthquake forecasts.

One of the goals of Cascadia2021 is to improve our imaging of the plate boundary using techniques analogous to those used to image within the human body. If we know what the interface between the Juan de Fuca plate and the North American plate looks like, we can better understand the forces at play and assess the risk of a large slip event in the near future. The more detailed images we obtain, the better our models of expected ground shaking will be for various earthquake scenarios.

– Kaisa Autumn


Sources:

https://pnsn.org/outreach/earthquakesources/csz