Field Data Report
Leave a reply

(Please move your cursor out of the movie window to see the whole map.)
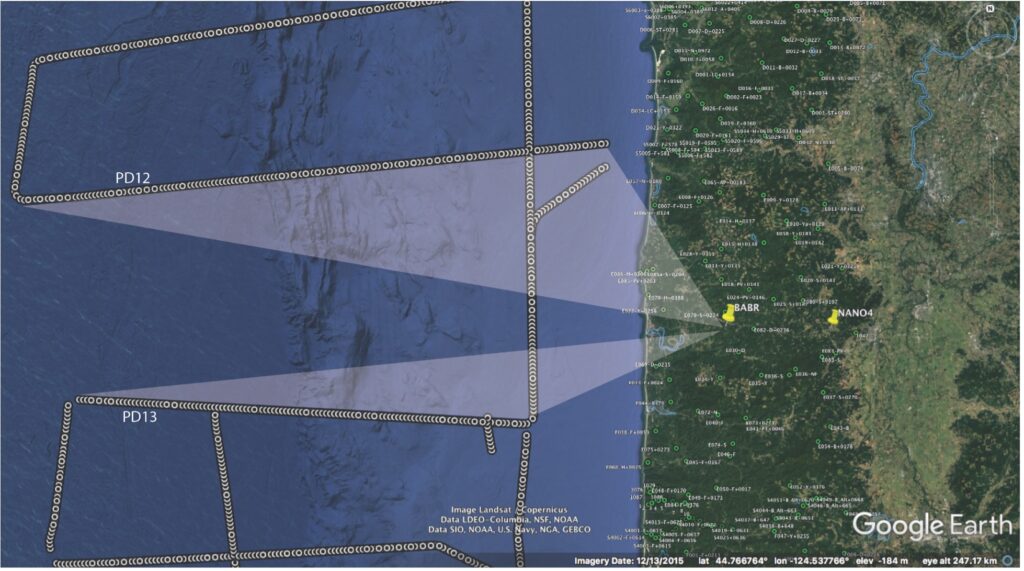
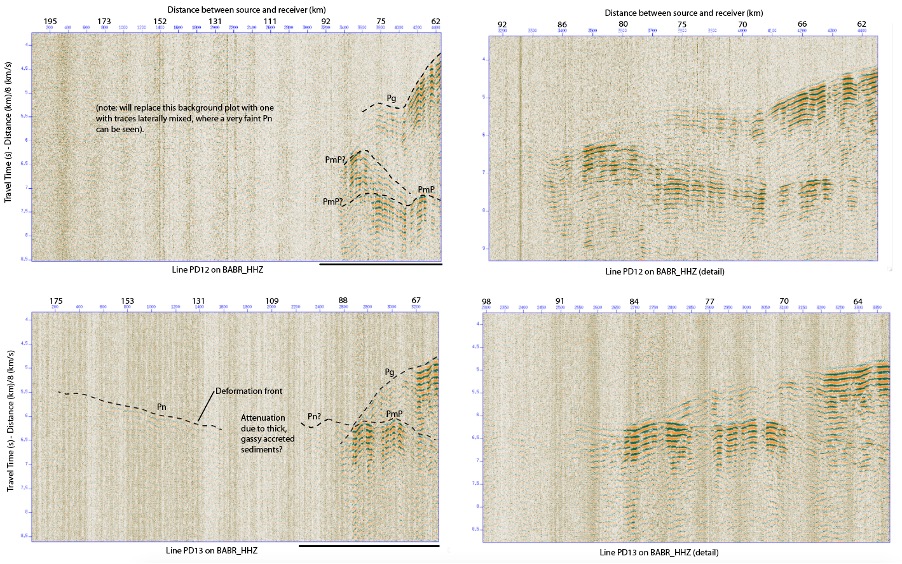
Although the data from the nodes must be downloaded at the IRIS/PASSCAL instrument center (a national facility that provides seismological instrumentation to universities throughout the US for experiments around the globe), we can get a first look at the data by processing the data recorded on stations from the Pacific Northwest Seismic Network (PNSN) and on 5 temporary stations that were provided for this experiment by Nanometrics Inc. An example of data from two different offshore lines (PD12 and PD13) as recorded on PNSN station BABR is very promising. Sources along these two offshore lines travel a different path to the station, as shown by the triangles on the map.
For an animation of the process of extracting information on subsurface structure from seismic data, see this short video from IRIS.
If the crustal structure were uniform along this portion of the Cascadia margin, the data from the two lines would look the same at this station. However, we see that they are quite different, indicating that there are 3-D structural variations in the subsurface. Some of the differences to note include:
Similar patterns are seen on NANO4, indicating that these differences are due to regional variations rather than to local site effects. Somewhat different patterns are seen for these two lines of sources on other stations in this region, providing information that will be mapped into structural variation as analysis proceeds. Spot checks of PNSN stations in SW Washington (PNSN station RADR) and near the Oregon/California border (PNSN station KBO) indicate that the observations in the northern and southern parts of the onshore network are very different from those in the middle, signaling large variations in the dip of the subducting plate and the composition of the upper plate beneath Cascadia.
The data shown here represent less than 0.01% of the entire data set, and all the data have to be processed, modeled and interpreted. We anticipate that these results will lead to significant refinement of the depth and character of the subducting slab. This is important because studies of subductions zone elsewhere that have experienced great earthquakes in recent years suggest that the geologic characteristics of the plate boundary and adjacent plates exert a strong influence on the rupture process of great earthquakes, which in turn affects the pattern of strong ground shaking and other hazards, such as landslides, that result from the shaking.
-Anne Tréhu
I am a B.S. graduate of geology from Oregon State University. I have plans to continue on with a Master’s degree with a focus on earthquakes. It will be really exciting to see the data from this experiment and see how it is used in different areas of research.
Emilie is a geophysicist studying the structure of the Cascadia subduction zone and how magma is transported from Earth’s mantle to the surface. She has led numerous field expeditions and her current research uses novel, dense geophysical data sets and inverse modeling on high performance computers. Emilie is an Associate Professor of Earth Sciences at the University of Oregon. For Emilie, this project represents an exciting opportunity to create a detailed model of the geology and topography of the megathrust to better understand the along-strike segmentation of locking at Cascadia and the transition from shallow locking to deep stable sliding.
I’m a geophysics professor at Oregon State University who has been conducting research in the Cascadia subduction zone since moving here from the USGS in Woods Hole MA in 1987. Since then, in partnership with the USGS and various universities, I have been involved with a series of controlled source imaging projects in Cascadia on land and at sea. In general, each project has been more ambitious than the previous project as instrument capabilities provided by the Incorporated Research Institutions for Seismology (IRIS) has grown. The Cascadia2021 project is by far the most ambitious so far, and was enabled by technical improvements in portable seismometers.
In recent years, I have also worked offshore Chile in places that had recently experienced subduction zone earthquakes with M>8 in order to determine how the geologic structure influenced the distribution of slip on the fault plane during the earthquake. That is knowledge that we hope to transfer to our interpretation of the data from Cascadia2021 so that we can better anticipate what will happen next time the Cascadia subduction ruptures.
Click here for more information on the various aspects of my research.
Notes:
Our project aims to create a model of the subsurface to better understand the seismic hazards of the Cascadia Subduction Zone. Offshore Oregon and southwest Washington, the Juan de Fuca plate offshore is diving beneath North American plate (or, more precisely, the Oregon microplate, which is itself rotating slowly relative to the core of North America). The plate boundary is at or near the surface at the offshore “deformation front, which is visible in the seafloor elevation, and gets steadily deeper towards the east. Beneath the coastline, it is approximately 15-20 km beneath the surface, and beneath the Cascade volcanos, it is 80-100 km deep. When averaged over long periods of time (100s to 1000s of years), the subduction rate is ~4 cm/yr. At great depths, where the plates are hot, the plate motion occurs gradually and silently. At shallow depths, it can occur in rapid bursts, with meters of motion occurring within seconds (great earthquakes) separated by 10s to 100s of years when the plates are locked together. The most recent large subduction zone earthquake occurred in 1700, as indicated by a geologic evidence, indigenous oral histories, and a tsunami recorded in Japan. There appears to be a transitional depth range beneath the Coast Ranges in which the motion occurs at intervals of several months but is too slow to generate strong earthquakes. This phenomenon, known as episodic tremor and slip, was only detected in the past 3 decades, when GPS data capable of measuring it became available. One objective of our project is to image the plate boundary across this transition to provide insights into the underlying physics that can contribute to understanding whether non-destructive plate motion at this depth is loading the shallow part of the plate boundary.
In addition to this cross-sectional view of the subduction zone, modeling of the GPS data indicates that the degree to which the Cascadia fault is currently clamped varies from north to south. We seek to understand the geological reasons for this difference and how these changes may affect the way in which the Cascadia fault could break in the future. Observations from other parts of the globe, where large subduction zone earthquakes have occurred recently, indicate that segments where the plates are not fully locked can sometimes act as barriers to rupture in individual earthquakes. The magnitude of an earthquake is controlled, in large part, by the area that slipped in that earthquake. A magnitude 9+ earthquake in Cascadia must rupture the entire plate boundary at once from Vancouver Island to Cape Mendocino, CA. The relationship between subsurface geologic structure revealed by our project and the variations in how well the plates are coupled inferred from the GPS data will lead to a better understanding of how likely Cascadia is to rupture all at once.
Finally, the geologic model we derive from the data will also be used to produce more realistic models of the ground shaking to be expected from various types of earthquake. The shaking at any location depends on the nature of the rocks beneath that site. For example, sedimentary basins such as the Tualatin basin beneath Hillsboro, can focus the energy and amplify the motion at certain frequencies. Current ground shaking predictions are based on very simplified models of the geology. Our results will enable an updated set of the ground motion predictions used to define building codes and plan emergency response.
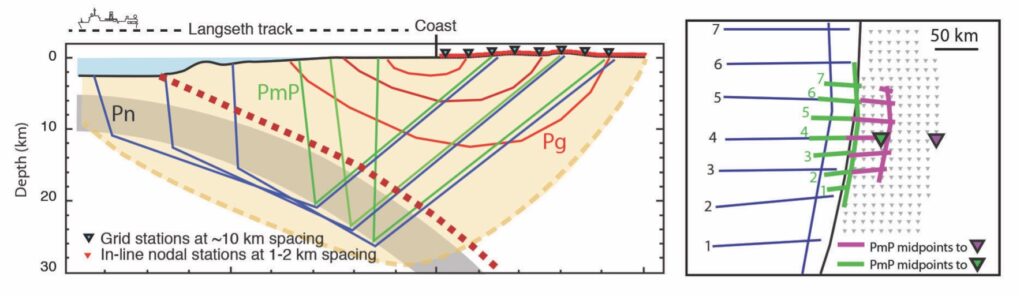
To develop our geologic model of the subduction zone, we installed 755 mini-seismometers onshore to record sound sources generated by a ship offshore. All instruments were recovered a month later. Installations and recoveries were done by teams of volunteers driving SUVs and pickup trucks provided by the OSU/UO motor pool. Volunteers were recruited from around the country and represented a diverse group that included college undergraduates, graduate students, veterans, and community college students (and one instructor). Over ½ the volunteers and principle investigators are women in a field traditionally dominated by men.
The locations of the onshore seismometers and offshore sources are shown in the map below. The grid of stations provides data that will be used to develop a 3-dimensional model of the earth beneath the Pacific Northwest. The lines of closely-spaced seismometers are extensions of lines offshore and will result in more detailed vertical slices through the 3-D model.
The data will be processed using mathematical techniques analogous to those behind medical imaging. In fact, these techniques were originally developed to image beneath Earth’s surface and then adapted for use in medicine. Several graduate students will work on the data, and we will use the parallel computer clusters at UO and OSU. Complementary studies using natural sources recorded on the onshore network will be undertaken by collaborators at the USGS and South Dakota School of Mines and Technology and elsewhere. Colleagues at the Lamont Doherty Earth Observatory in New York and at the Woods Hole Oceanographic Institution in Massachusetts will work on the marine data. Because all data are open access (i.e. available to all through the IRIS Data Management Center), we anticipate that many investigators will ultimately use the data to develop new analysis approaches, refine the geologic model for the Pacific Northwest, and improve our understanding of seismic hazards in Cascadia.
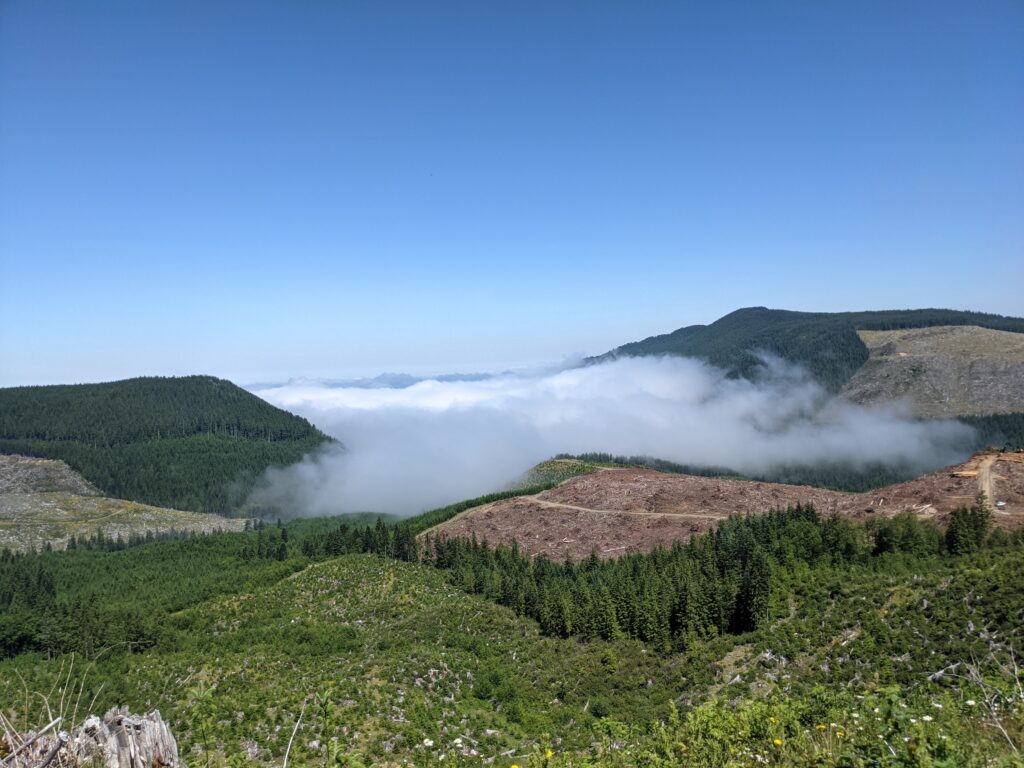
When I was driving around the Oregon Coastal Range as part of the team of volunteers for the Cascadia 2021 Project, I was not only enjoying the great views that the region offers, but was also experiencing a constant déjà vu while I was there.
I am a Chilean Geoscientist who grew up in the central valley of Chile, a long-skinny country that is located on the boundary between the Nazca and South American tectonic plates. The margin is a subduction zone where compression causes mountain building, active volcanoes, and a lot of earthquakes. As Chileans we have a long history of big earthquakes and were home to the largest seismic event of modern times: the 1960 Valdivia magnitude 9.5.
If this starts to sound familiar, I’m going to say: yes, it is like the Cascadia Subduction Zone! In other words, Oregon and Washington have a lot of similarities with my country.
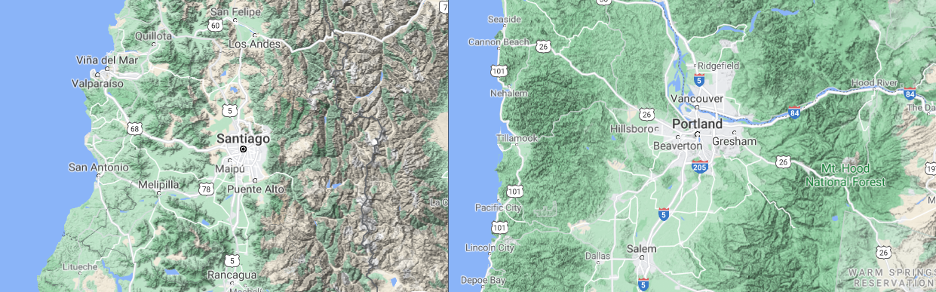
In fact, if we go through the geographic domains in Chile and Oregon from west to east we find the same physiography: Coast, Coast Range, Valley and Volcanic Arc. The main cities are in the valley, characterized by flat areas eroded by rivers that allowed the settlement of agriculture and urban development.
For those who have experienced being far from home, you know that is a normal process to miss what you are used to seeing and living. For that reason, for me having the chance to be surrounded by landscapes that remind me of my origin makes the transition much easier. However, even though the geography geologic setting of Chile and Cascadia are similar, there are also some big differences.
Can you guess what I’m missing the most from Chile? The answer is probably what mainly differentiates these two subduction zones and that is: earthquakes. In Chile, it is very usual to feel the shaking of earthquakes over magnitude 5 every month, and I can guarantee that the majority of the adult population has experienced an earthquake over magnitude 8. We are very used to feeling the seismic waves (you can really notice the S wave arrival), receiving tsunami alerts and continuing our lives after the shaking because it is part of our culture. I call it seismic culture and it is the result of multiple seismic events that became catastrophes in the past and the oral tradition of passing these experiences from generation to generation. Big earthquakes occurring frequently made us create a robust Seismic Building Code, where strict regulations allowed us to save lives and keep infrastructures without major damages. In other words, Chile has an advantage over Cascadia in terms of their population knowledge about earthquakes because basically every Chilean knows that earthquakes are going to happen suddenly and we have to be prepared for it.
Taking the huge seismic cultural contrast into account, and how difficult it is to teach people about earthquakes when they have never experiencing them, the scientists in the Pacific Northwest have big challenges for the Cascadia Subduction Zone. For years, many geoscientists have been working hard to better understand the structures, seismic hazards, and processes that are happening in the megathrust fault zone, and The Cascadia 2021 Project is an example of it.
As geoscientists living in the PNW region we can play an important role in our non-scientist communities by disseminating our knowledge about the potential for a 9+ magnitude earthquake and subsequent tsunami. In addition, taking a look into other active subduction zones areas like Chile or Japan, among others, can give us important signs about similar processes that could happen in Cascadia. Comparison is a great method of learning, observations are an essential part of our training as scientists, and taking a broader view is always useful. It is important to include different perspectives on our research questions.
I will continue learning about Cascadia during my stay in the PNW, and I am sure that I will bring that knowledge home to Chile. Every time that I look at the Andes, the Cascades will be in my memories.
Cuando iba manejando en la Cordillera de la Costa de Oregón como parte del equipo de voluntarios del Proyecto Cascadia 2021, no solo disfrutaba de las hermosas vistas que ofrece la región, sino que también vivía una especie de Déjà vu constante mientras estaba allí.
Soy una geocientífica chilena y crecí en el valle central de Chile, un país largo y delgado que se encuentra en el límite de las placas tectónicas de Nazca y Sudamérica. El margen es una zona de subducción, donde la compresión de las placas genera la formación de montañas, volcanes activos y muchos terremotos. Como chilenos tenemos una larga historia de grandes terremotos y somos el hogar de uno de los eventos sísmicos más emblemáticos: el terremoto de Valdivia de 1960 de magnitud 9.5.
Si esto comienza a sonar familiar, te voy a decir: sí, ¡se parece a la zona de subducción de Cascadia! En otras palabras, los estados de Oregon y Washington tienen muchas similitudes con la morfotectónica que tenemos en mi país.
De hecho, si observamos los dominios morfoestructurales de Chile y Oregon de oeste a este nos encontramos con la misma fisiografía: Costa, Cordillera de la Costa, Valle y Cordón Volcánico. En ambos lugares las principales ciudades se encuentran en el valle, caracterizadas por áreas planas erosionadas por ríos que permitieron el asentamiento de la agricultura y el desarrollo urbano.

Para aquellos que han experimentado estar lejos de casa, saben que es un proceso normal extrañar lo que están acostumbrados a ver y vivir. Por eso, para mí tener la posibilidad de estar rodeada de paisajes que me recuerdan a mi país de origen hace que la transición sea mucho más sencilla. Sin embargo, aunque la geografía de Chile y Cascadia es bastante similar en muchos aspectos, y la zona de subducción podría hacernos pensar que el comportamiento de las regiones es similar, también existen grandes diferencias.
¿Puedes adivinar qué es lo que más extraño de Chile? La respuesta es probablemente lo que más diferencia a estas dos zonas de subducción: la frecuencia de los terremotos. En Chile es muy común sentir algún temblor de magnitud 5 cada mes, y puedo garantizar que la mayoría de la población adulta ha experimentado un terremoto de magnitud 8. Estamos muy acostumbrados a sentir las ondas sísmicas (puedes realmente notar la llegada de la onda S), a recibir alertas de tsunami y a continuar con nuestras vidas después de un temblor porque es parte de nuestra cultura. Yo lo llamo cultura sísmica y es el resultado de múltiples eventos sísmicos que se convirtieron en catástrofes en el pasado y la tradición oral de pasar estas experiencias de generación en generación. Grandes terremotos ocurriendo con frecuencia nos llevaron a crear un Código Sísmico para la construcción muy robusto y exigente, donde una normativa estricta ha permitido salvar vidas y mantener las infraestructuras sin mayores daños. En otras palabras, Chile tiene una ventaja sobre Cascadia en términos del conocimiento de su población sobre terremotos, porque prácticamente todo chileno sabe que los terremotos van a seguir ocurriendo sin previo aviso y que se debe estar preparado.
Teniendo en cuenta el enorme contraste cultural que estas dos regiones tienen y lo difícil que es enseñar a las personas sobre los terremotos sin haberlos experimentado nunca, los científicos del noroeste del Pacífico tienen grandes desafíos para la zona de subducción de Cascadia. Durante años, muchos geocientíficos han trabajado arduamente y se han esforzado por comprender mejor las estructuras, los peligros sísmicos y los procesos que están sucediendo en la zona de falla, y el Proyecto Cascadia 2021 es un ejemplo de ello.
Como geocientíficos que vivimos en el PNW, podemos desempeñar un papel importante en nuestras comunidades no científicas al difundir nuestro conocimiento sobre el potencial que tiene la región de generar un terremoto de magnitud 9+ y su posterior tsunami. Además, observar otras áreas de zonas de subducción activa en el mundo como Chile o Japón, entre otras, puede darnos señales importantes sobre procesos similares que podrían ocurrir en Cascadia. La comparación es un gran método de aprendizaje, las observaciones son una parte esencial de nuestra formación como científicos y siempre es útil tener una visión más amplia para incluir diferentes perspectivas en nuestras preguntas de investigación.
Por mi parte, continuaré aprendiendo sobre Cascadia durante mi estadía en el PNW, y estoy segura de que cuando vuelva a Chile llevaré ese conocimiento conmigo, y cada vez que mire a los Andes, las Cascades estarán en mi memoria.
We thank the many landowners who gave us access to their land. Without their cooperation and support, this project would not have been possible. If we have forgotten anyone, please let us know and accept our apologies.
Federal and State Agencies:
Timber companies:
Local Agencies:
Schools & Churches:
Other Companies:
Individuals:
We also thank the Oregon Hazards Lab, University of Oregon, for assistance with permitting and fieldwork.
Navigating in the backcountry was no easy task! Many of our nodes were installed in remote regions with no cell service. Teams spent time each evening or in the early morning studying maps and using feedback from property owners to plan their route to each site. We used a variety of different tools to navigate in the backcountry. Teams used paper maps as well as navigation apps to find their way to the sites. Each group took an atlas or a paper map of Oregon or Washington into the field. In addition to this, volunteers imported the site coordinates for each day into several different navigation apps. Each platform had its own distinct advantages and teams often flipped between multiple apps and paper maps to navigate to their sites. It was not uncommon to find that different maps showed different roads or disagreed about the quality of the road.
Atlases were great for planning general routes but sometimes they did not show smaller roads or roads located on privately owned land. Maps provided by the Forest Service and timber companies provided additional detail in some regions. Each team used different navigation apps depending on the type of phones they had as well as what they were already familiar with. Before going into the field and losing cell service, we downloaded the maps for the regions we would be in working in that day. Most teams used a combination of Google Maps, Maps.Me and GPS Tracks or GPX Viewer. Sites located near houses or businesses could usually be found using turn-by-turn directions. Sites located in more remote areas usually required using Maps.Me or looking at satellite imagery. Each team recorded their path to each site using GPS Tracks or GPX Viewer. Saved tracks proved useful in finding our way out of complex road systems and finding our way back to these sites nearly a month later to recover the instruments. Even with the help of saved routes from the deployment, during the recovery, we encountered some unexpected challenges such as road closures, overgrown roads, and downed trees.


The last instrument to be recovered was located in a particularly complicated road network shown on the maps above. My field partner and I used the GPS track from the team that deployed that node to navigate the complicated road system. We encountered some fallen trees along one of the roads the deployers had taken and turned to Maps.Me to find an alternate route to the site. Once we were at the site, we used the deployment notes and a compass to locate the buried node.
– Sarah Nolan