PAM, the love of my life.

Hello Everyone,

I will not be graduating until early 2018, so this is not my last post as an Oregon Sea Grant Scholar. However, this IS my last post as a Robert E. Malouf Scholar. With that in mind, I decided I would give a taste of what I have been doing this summer, but leave the “whole shebang” for my final post.

Recall, my project is characterizing metformin, a pharmaceutical drug, as a contaminant of emerging concern (CEC) in the lower Columbia River estuary. Fully characterizing a CEC in the environment should obviously include an ecosystem component. Thanks to the Malouf scholarship, I am currently exploring the effects of metformin on the lower food web.

This summer is best described as a series of never-ending lab experiments and instrumentation. It turns out that testing the effect of metformin on phytoplankton and microbes is harder than it looks! Currently, my lab bench looks like an explosion of flasks, vials, pipettes, and sediment. Like most scientists, I spend more of my time washing and prepping experiments than I do actually collecting data – an unromantic fact of the scientific existence that the public tends to ignore. I will focus on my phytoplankton work, since the microbe experiments are currently taking an unexpected turn (more on that in the future!).

Most of my phytoplankton work has revolved around the PAM fluorometer – an awesome device that measures the kinetics of fluorescence in photosynthetic cells.

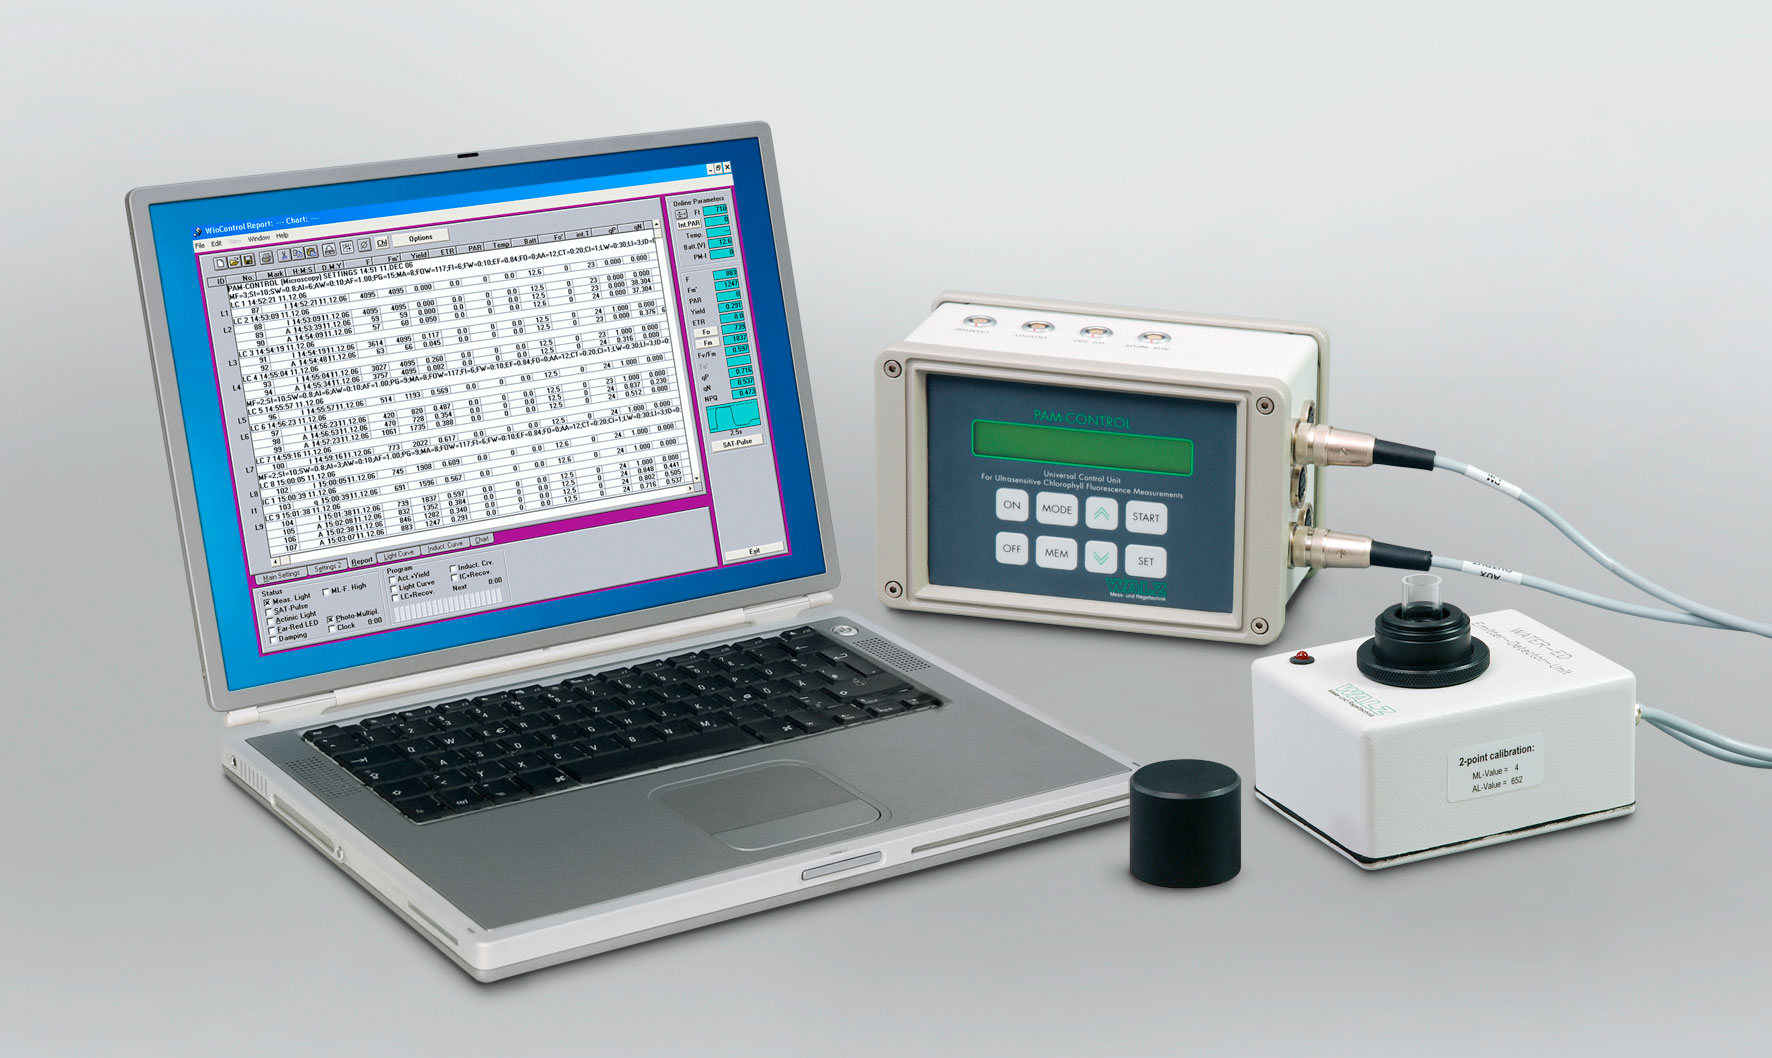
The simple beauty of PAM.

If you recall basic photobiology, photosynthesis (the production of energy from sunlight) works through an electron transport chain that takes place in the thylakoid membrane of chloroplasts in photosynthetic cells. Pigment molecules (e.g. chlorophyll b, xanthophylls, or carotenes) within a membrane photosystem (Photosystem II) absorbs photon energy from sunlight. This energy is used to excite electrons donated by oxygen in water. The excited electrons are held less strongly by the oxygen nucleus and escape into a “pigment funnel” (i.e. antenna complex), where it is passed from pigment molecule to pigment molecule toward an ultimate electron acceptor (i.e. chlorophyll a) at the reaction center of the photosystem. The chain continues after the electron is shuttled to another photosystem (Photosystem I) and a different electron acceptor. The electron will ultimately be used in the production of NADPH and a proton gradient that fuels ATP synthase to produce energy.

The concept of photosynthesis: an electron from water is excited to a higher energy state and escapes into Photosystem II where it is passed from pigment molecule to pigment molecule until it hits an ultimate electron acceptor. The electron is then passed through an intermembrane system to Photosystem I where it is funneled to another electron acceptor and eventually used to reduce NADP+ to NADPH. This forms an intermembrane proton gradient that drives ATP synthase and the production of energy.

In a nutshell, the PAM fluorometer stimulates and measures this process by delivering light pulses to a water sample containing photosynthetic cells (algae, in my case). Recall, photosynthesis is based on the idea of an excited electron losing energy. Whenever an excited electron moves to a lower energy state, it must release energy. This energy is released in the form of long wavelength fluorescence, which can be measured by a fluorometer. By measuring minimum and maximum fluorescence in response to a series of light pulses, the PAM fluorometer can measure electron transport rate and non-photosynthetic quenching processes (e.g. energy lost via heat, instead of fluorescence). In my case, this is perfect for looking at the effect of a chemical compound on photosynthetic efficiency.

My labmate jokingly dubbed the PAM fluorometer a “magic box”, however, there is a scary amount of truth to that term. The PAM fluorometer is an amazingly compact device that can measure an amazing number of photosynthetic processes. People tend to take it for granted since it appears simplistic: turn it on, insert sample, measure photosynthesis, and you’re done! WRONG.

There are so many quirks to the device. First off, the manual. Or, should I say, manuals. Part of one topic will be explained in one manual, but an important note on the same topic will be explained in the other manual. Confusing is an understatement. Let’s not mention the calibration protocol which cost me a month of fiddling.

As a result, I have learned the PAM fluorometer from the inside out. Some examples of what I have learned over the past three months: (1) there is an optimum time to “dark-adapt” samples to make sure photosystems are completely receptive to light (i.e. completely empty of electrons), (2) far-red light should also be used to fully oxidize Photosystem I and the intersystem electron transport chain to maximize electron receptivity, (3) the sample should be diluted until the fluorescence value does not exceed a maximum value, and (4) the sample cuvette has an optimum volume and should be cleaned with ethanol in between samples to prevent obscured light paths. These are just some of the many things that I had to learn by trial and error through countless failed phytoplankton experiments.

I am aware that this entire post is about the PAM fluorometer, but it has arguably been my greatest achievement this summer. I am proud that I am mastering such a deceptively complicated device. By the end of this project, I plan on having written a detailed calibration protocol and detailed illustration of the PAM fluorometer so that future lab members can easily take measurements without a similar summer of trial and error. The long process was a blessing in disguise though – I truly have a better grasp on photosynthesis and fluorometry instrumentation.

What about the results? Well, if you don’t make it to the CERF conference this year, you will have to wait for my last blog post. I am currently doing my fine-tuned toxicity experiments with Chlorella vulgaris (a basic green algae) and will be performing the same experiments with Thalassiosira weissflogii (a diatom, which tends to be more sensitive). This should give us a good idea of the effect of metformin on the photosynthetic processes of two representative organisms in the Columbia River estuary.

Stay tuned.

Protists, Pathogens, and Fungus… oh my!

I’m using this blog post as an excuse to take a detour from my usual research and explore the tantalizing world of protists. Studying nothing but microbes and chemical compounds for the past year has given me an excitement for small aquatic critters of all kinds. You are officially about to become a sounding board to the army of thoughts and large confusing taxonomic names that are assaulting my brain. Bear with me and you might find yourself similarly enthralled!

It started with reading a paper on the ecology of Labyrinthulomycetes (Raghukumar 2002) as I was studying the topic of disease in eelgrass. Recently, I have been doing a lot of research on seagrass for classwork and personal interest (“NERD!”). I find seagrass meadows particularly fascinating since they are the most common coastal ecosystem on the planet, sequester 12x more carbon than terrestrial forests, provide habitat for thousands of species, and filter contaminated water in temperate AND tropical coastal/estuarine ecosystems. I think of seagrass meadows as “unsexy” coral reefs (“NERD!”).

Common eelgrass (Zostera marina) is a type of seagrass that often suffers from the parasitic disease called Eelgrass Wasting Disease. Labyrinthula zosterae is a marine protist that causes this disease by destroying the photosynthetic ability of eelgrass leaves through lesion formation. The L. zosterae protist is actually symbiotic if the host is unstressed. As soon as the host becomes stressed (due to any number of factors, such as salinity, temperature, light, etc.) L. zosterae quickly turns pathogenic and produces lesions on the plant. Labyrinthulomycota is the marine protist group under which L. zosterae is found, hence the interest in the Raghukumar paper.

Before we move on, let’s define protists. Protists are any eukaryotic organisms that are not plants, animals, or fungi – they are typically microscopic unicellular organisms. There are four groups that comprise protists: protozoa, slime molds, water molds, and algae. Labyrinthulomycetes are marine slime molds that produce a network of filaments or tubes (“ectoplasmic net”) which they use for movement or nutrient absorption. Interestingly, they are actually more closely related to algae (i.e. diatoms, other phytoplankton, and kelp) than they are to other slime molds.

Enter the chaos. Labyrinthulomycota comprises two groups of marine protists: labyrinthulids (e.g. L. zosterae) and thraustochytrids. Labyrinthulids are typically endobionts (organisms that live within another organism), while thraustochytrids are epibionts (organisms that live on the surface of another organism). My current research is interested in the effects of pharmaceutical contaminants on phytoplankton, so I started thinking about effects of contaminants on other non-algae protists as a trigger for diseases, such as Eelgrass Wasting Disease. My lab-mate, Lyle, who is also an awesomely passionate scientist, is culturing and studying chytrid parasites on phytoplankton. I thought, “Fantastic! A possible chance to study the effects of contaminants on a Labyrinthulomycete! Both chytrids and thraustochytrids are small circular epibionts that have “chytrids” in their name so they must be related… right?”. WRONG.

After a furious onslaught of text messages with [a very patient] Lyle arguing the difference between these two seemingly similar groups of organisms, I finally realized that chytrids are fungi, while thraustochytrids are protists. Now you may be thinking, “Protists and fungi… wait… aren’t those on opposite ends of the tree of life? Why are they both using the word “chytrid” in their names!?”. That’s a question that only taxonomists can answer, but one explanation is that thraustochytrids and labyrinthulids were variously placed under the fungi and protozoa groups before being consolidated into the Labyrinthulomycota protist group. Labyrinthulids look very similar to protozoa and thraustochytrids look very similar to fungi (e.g. chytrids). Similar morphology in combination with a seriously lacking fossil record makes it easy to see how taxonomists could have originally mistaken thraustochytrids for chytrids. It sure fooled me!

(above) Chytrids (left) vs. thraustochytrids (right)
(below) Protozoa (left) vs. labyrinthulids (right)
They look totally different… right?

Now that I understand that Lyle is NOT studying Labyrinthulomycetes, can I still explore the toxicology of protists in my lab? Actually… yes! Even though chytrids are fungi and thraustochytrids are protists, they employ similar life strategies (epibionts) and can be found simultaneously in the environment. For instance, chytrids and thraustochytrids colonize mangrove ecosystems by breaking down pollen spores and fallen leaves (Phuphumirat et al 2016). If they can be found co-occurring in the environment, and if they are hard to tell apart via microscopy, does that mean that Lyle might be unknowingly growing thraustochytrids as well as chytrids in his cultures? This is definitely a possibility, since he often spikes his cultures with actual material from the Columbia River Estuary.

If we have a successful thraustochytrid culture in my lab, I can perform similar toxicology tests as with my phytoplankton. Effects of contaminants on thraustochytrids will give us insight into possible effects of contaminants on other Labyrinthulomycetes, such as Labyrinthulids, which could have ramifications for outbreaks of Eelgrass Wasting Disease. Of course, labyrinthulids are endobionts so their exposure to contaminants would be different. Nevertheless, disease ecology is a wonderful excuse to expand my research interests and enter through the gateway of non-algae protists. The world of Labyrinthulomycete toxicology awaits!

On a closing note, non-algae protists are particularly neglected in the world of microbial research. I can’t help but think that part of the reason scientists bypass these organisms is due to confusing taxonomy and terminology. But don’t let that deter you – all it takes is a few text messages to your scientist friends to start understanding protists in relation to other plants, animals, and fungi. In the meantime, oh, the possibilities that this negligence affords! This could be the beginning of a beautiful project for those of us who know…


References

Raghukumar S. (2002). Ecology of marine protists, the Labyrinthulomycetes (Thraustochytrids and Labyrinthulids). European Journal of Protistology 38: 127-145.

Phuphumirat W., Ferguson D. K., Gleason F. H. (2016). The colonization of palynomorphs by chytrids and thraustochytrids during pre–depositional taphonomic processes in tropical mangrove ecosystems. Fungal Ecol. 23: 11–19. 10.1016/j.funeco.2016.05.006

Healthcare meets the Environment

Hi There!

Welcome to the convergence between medicine and the environment!  I am a new Oregon Sea Grant scholar (actually, I started in late March, but who’s counting?) that was given the wonderfully unique opportunity to attend the Institute of Environmental Health at the Oregon Health and Science University (OHSU) in Portland, OR, under the sage direction of Dr. Tawnya Peterson and Dr. Joseph Needoba.  What’s that?  Marine scientists at a school of medicine?  Life is certainly full of the unexpected!

13308347_1265113166851203_4454932357287724244_o

The Columbia River view from Munra Point, OR.

OHSU Pic

OHSU campus and tram from the South Waterfront District in Portland, OR (photo courtesy of OHSU Transportation & Parking website http://www.ohsu.edu/xd/about/services/transportation-and-parking/tram/)

The principle behind the OHSU Institute of Environmental Health actually reflects that of my research.  OHSU believes preventive medicine starts with a healthy environment.  The concept is simple: when your environment is healthier, people are healthier.  For example, think of the impact of river water quality on drinking water, and the impact of contaminants on fish and the people who consume them.  My research is based on the reverse principle: our environment becomes unhealthy with unhealthy people living in it.  Specifically, I am trying to characterize the distribution, breakdown, and phytoplankton effects of the Type II diabetes medication, metformin (and its breakdown products) in the lower Columbia River, within a public health outreach focus.

Type II diabetes is on the rise in the modern world.  In fact, by 2030, it is expected that over 350 million people worldwide will be diagnosed with Type II diabetes (http://www.whocc.no/atcddd/)!  The most commonly prescribed drug for Type II diabetes (by mass) is metformin (http://www.whocc.no/atcddd/).  Metformin (also known as Glucophage) is a dimethyl-biguanide with the unique ability to lower glucose levels in the blood without breaking down in the body (more on this in my next post!).  The drug simply does its job and passes straight through the human system.  Metformin is so amazing that the molecular underpinnings of its pharmaceutical action remain an area of active investigation.  There are even potential links between metformin and improved physiology, including anti-cancer and anti-aging properties!

An amazing little drug!

An amazing little drug!

With such a high rate of metformin usage in combination with its largely unaltered excretion into wastewater, metformin has become one of the most abundant pharmaceuticals being introduced into the environment and has been labeled as a Contaminant of Emerging Concern (CEC).  Very little is known about the effects of metformin or its breakdown products in the environment, but endocrine disrupting effects have been observed in fathead minnows (Niemuth and Klaper 2015, Crago et al 2016), in addition to possible effects on Chinook salmon survival (Meador 2014).  In fact, a 2016 study in the Puget Sound listed metformin as the highest CEC in wastewater treatment plant effluent water (Meador et al 2016).  The total combined CEC output of only TWO tested wastewater treatment plants (out of 106!) was on the order of kilograms per day (Meador et al 2016).  To give you a frame of reference, picture the total amount of synthetic drugs, chemicals, and other chemicals of concern approaching natural levels of nitrogen input!  Being one of the highest CEC’s in wastewater treatment plant effluent, metformin is a large part of this picture.

A similar situation may be true down here in Oregon, which is why I am looking at metformin in the Columbia River.  The Columbia River is the second largest river (by flow) in the United States and the largest source of freshwater to the northeast Pacific Ocean.  With such a high flow rate along areas of dense population, metformin is a detectable CEC in the Columbia River (unpublished data).   I hope to characterize the distribution of metformin and its breakdown product, guanylurea, along the lower river.  I have already started taking samples with the help of Columbia River Keeper (CRK) and our wonderful lab assistant, and I hope to start analyzing metformin and guanylurea concentrations soon.

Columbia River Basin Map

Map compiled and designed by Kirstyn Alex.

This project is particularly motivating due to the potential for a positive change in both humans and our environment – two passions which I find impossible to separate.  In a clinical trial, the National Institutes of Health “found a lifestyle intervention (modest weight loss of 5 to 7 percent of body weight and 30 minutes of exercise 5 times weekly) reduced the risk of getting Type II diabetes by 58 percent in a diverse population of over 3000 adults at high risk for diabetes” (https://report.nih.gov/nihfactsheets/viewfactsheet.aspx?csid=121).  Obviously, Type II diabetes is often largely preventable with relatively simple changes in lifestyle.  Or, in words more pertinent to my study, metformin input and associated toxicological impacts on the Columbia River watershed is largely preventable with relatively simple changes in human lifestyle.

20160502_085622

Sampling kits for Columbia River Keeper.

20160407_143749

Successful first round of cleaning sample vials.

How great is it that I can encourage human health while encouraging environmental health?!  I love my job.

Stay tuned for my next entry: Metformin, the Miracle Contaminant…


Works Cited

Crago J, Bui C, Grewal S, Schlenk D. 2016. Age-dependent effects in fathead minnows from the anti-diabetic drug metformin. General and Comparative Endocrinology 232: 185-190. doi:10.1016/j.ygcen.2015.12.030

Meador JP. 2014. Do chemically contaminated river estuaries in Puget Sound (Washington, USA) affect the survival rate of hatchery-reared Chinook salmon? Canadian Journal of Fisheries and Aquatic Sciences 71(1): 162-180. doi:10.1139/cjfas-2013-0130

Meador JP, Yeh A, Young G, Gallagher EP. 2016. Contaminants of emerging concern in a large temperate estuary. Environmental Pollution 213: 254-267. doi:10.1016/j.envpol.2016.01.088

National Institutes of Health (NIH). 2010. U.S. Department of Health & Human Services: NIH; [updated October 2010; accessed May 2016]. https://report.nih.gov/nihfactsheets/viewfactsheet.aspx?csid=121

Niemuth NJ, Klaper RD. 2015. Emerging wastewater contaminant metformin causes intersex and reduced fecundity in fish. Chemosphere 135:38-45. doi:10.1016/j.chemosphere.2015.03.060

http://www.whocc.no/atcddd/