Since the last update, more development work has been done. One thing I did was create the table on the individual farm page to showcase comparable information. This includes the current and original owners, acreage, crops, and livestock. This was implemented because of feedback from the project sponsor. I also moved the image to the left of the “general farm information” to make the page look better. Originally, this was at the top of the page. Lastly, on this page, I added a default picture that loads for farms that don’t have any pictures in the database. This picture is in the screenshot below.
Another thing I did was update the climate data for the climate graphs. I got an email from ClimateNA (which is where we source the climate information) stating that data for 2022 was available. Because of this, I needed to move the year 2022 from the future climate graphs to the historic climate graphs and update the data. I also needed to add climate data for the farms I added to the database a couple weeks ago. During our meeting last Thursday with the project sponsor, I learned that ClimateNA actually has an API we could use instead of of downloading the csv files and managing the data ourselves. The project sponsor knows the creator of the ClimateNA API so I was able to email him some questions about the API. I want to know things like “is there a limit on API calls?” and “is there a way to write one API call to get data for a set of years?” (looking through the API documentation, it didn’t seem like there was a way to do this, but it would make things a lot more easier). I am still waiting on a response from the creator of the API, but am hopeful we will be able to switch to the API to make managing the data easier.
Since my last capstone update, some more development on the project has been done and we got good feedback at the end of last term from our project sponsor about what should be changed in the features we had done so far.
The Feedback We Got
Combine the historic and current data tab into one tab that makes it easier to compare data from the past and current – we will be adding a table that compares data fields that are comparable
Some farms have a synopsis available. These should be included on the individual farm page tab that shows all of the farm data
Remove the data fields “acreage farmed today”, “generations on farm”, “legal description”, “year of award”, and “ethnic origin” because they are not needed or are implied by other data fields we are keeping
Customize the marker color and the text of the farms that have been interviewed by Mariah, who is a graduate student doing her thesis on Century Farms
To the filter feature on the main screen add filters to search farms by whether or not they have: animals on the farm, any tree that produces a crop, and any shrubs that produces a crop
The Development I’ve Done Since Then
Near the end of last term, I finished the climate graphs. The historic climate graphs (1920-2021 and future climate graphs (2021-2050) are on separate tabs of the individual farm page. Each page has precipitation and temperature graphs. An evapotranspiration graph will be added for each page.
This over spring break and during the term I combined all the data on the current data tab and the historic data tab. I have not yet made a table for the data, but I’m sure the table will be easy to do. During this term, I have worked on getting data into the database for the farms Mariah has interviewed. Mariah sent us a document that has a list of all of the interviewed farms, which is eight farms right now, but there will be more by the end of the term. Some of these farms were not in our current database, so I added the ones that weren’t already added. For all of the farms I added a data field that states whether or not the farm has been interviewed. This information will help my teammate implement the feedback we got from our sponsor about having the farm markers and farm text a different color for the farms that have been interviewed.
This term I have also separated the graph tab code into separate files because originally, all of the code for the individual farm page was in one file and it was getting very long and hard to follow. The file main individual farm page file went from 843 lines to 386 and two files were added for the graphs with each of them being 145 lines. This makes the codebase a lot easier to follow.
My capstone project is an application for Century Farms that displays historic and current farm data and historic and future climate data for each farm. The end product will have a map on the main screen with clickable markers that show more information about the farm. This information will include historic farm data, current farm data, and climate graphs from the year 1920 to 2050. This project was started last year by capstone students. The major features my teammate and I are working on is creating a database for all of the data, expanding the current climate graphs (that have very limited years) to the years 1920-1950, creating a timelapse mode on the map, and adding more search features.
My Role
My main responsibilities have been creating the database, making a frontend that interacts with the database, and expanding the climate graphs to include more years of data. I have also worked on smaller tasks like making tabs for the individual farm page instead of having all of the information on one page.
I currently have the database, front end interacting with the database, and the tabs done. I am currently working on getting the climate graphs expanded. I have all of the data organized and ready to be used. My next step is coding the graphs, which looks easier than I thought it would be! There will be four climate graphs. One climate graph will be for historic temperature data from the year 1920 to 2021. The second graph will be for historic precipitation data from the year 1920 to 2021. The third graph will be future projected temperature data from the year 2022 (ClimateNA, the source I’m using, doesn’t have actual data for 2022 yet) to 2050. The last graph will be future projected precipitation data from the year 2022 to 2050.
Additionally, there are a couple things my teammate and I plan on working together on. These include expanding the search functionality and adding pictures for all of the farms.
Difficulties
One difficulty that set us back throughout the term was not being able to get the map API to work. We had to switch map APIs because we needed more features available to us to be able to implement the timelapse mode. After many weeks passing of this not working, our professor advised us to switch to a web application instead of a mobile application because React can be easier to work with than React Native, which was used for the mobile app. After getting an ok from our project sponsor to switch to a web app, we decided to go this route. Now, the map is displayed and has markers for all of the farms.
Another difficulty we had was getting the database that’s hosted on MongoDB to interact with our code. I tried many tutorials for this and a lot of them did not work. I finally found one that did work and was able to get API endpoints set up to query the tables in the database.
My favorite technology that I have been using so far is MongoDB. This is the technology that I have been using the most. I have been created a database on there that the application will interact with. Prior to taking this course, I had experience working with MongoDB from my Web Development class. This term, I’m doing more on it by making custom API endpoints to query the data. This is what I’m currently working on. The queries work by using aggregation operators like $search (to search for specific text). I’ve had difficulties getting some of the queries to work, so I will be working more on that this week.
Since my capstone project was started last year by students, there is a codebase that I have to learn. The code is in React Native. My team member and I don’t have experience with React Native or mobile development, so there has been a large learning curve. Because of this, it would be my least favorite technology. Even though, it doesn’t bother me that I have to learn it, there has just been a lot to learn about it.
To get the MongoDB database to interact with the application, my teammate and I decided that it would be best to restructure the code base to use MERN (MongoDB, Express, React, Node.js). Because of this, integrating the database into the application has taken more time than we planned, but progress is being made. I have been following this tutorial to help me create the MERN stack. So far, I haven’t added any of the previous teams code into the new codebase. I have been focusing on getting MERN set up and getting all of the queries to work. The tutorial I’ve been following takes you through creating the back end and the front end. Once the queries are done, I’ll be able to start on the front end and then add in the code from the previous team in the places that I think it should go.
Clean code is crucial to developing good programs. Other programmers need to be able to follow the program with ease without needing too many comments. After reading an article about clean code written by Shoaib Mehedi, I noticed that I do follow most of the guidelines. This is due to learning about them in courses because they are often highlighted by professors.
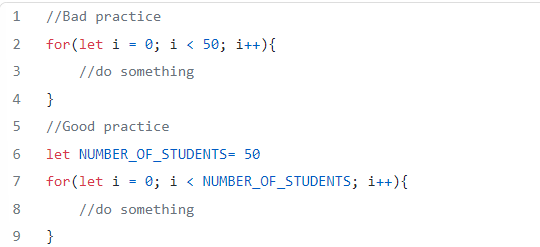
One of the guidelines Mehedi wrote about that I would like to follow is “magic numbers. Magic numbers are assigned a number without a clear meaning. Mehedi gave the example below:
I often do the “bad practice” simply because I’m cutting down on the amount of lines of code. However, I can see how the “good practice” is better. This is something I will start doing in my code. All of the other twelve guidelines mentioned by Mehedi are things I already do in my code including avoiding using too many comments, large functions, repetitive code, and choosing good names for your variables.
Code Smells
Code smells are issues in the code that can lead to larger issues further down the road. It is especially important to watch out for code smells when working on a large code base. Common code smells are temporary fields, dead code, unnecessary primitive variables, and data clumps. I read an article that further explains these and many more examples. This article is written by an unknown author.
A code smell that I would like to stop doing in my code is having long parameter lists. This doesn’t happen often, but sometimes I have a function that takes in a lot of parameters. Some thing I can do to avoid this is if I’m passing in parts of an object, I can instead pass in the whole object for simplicity. In the body of the function, I could separate out the parts of the object that I need. Another thing I can do to solve this is separate out the function into multiple functions so that the multiple functions will have a shorter parameter list. It would be especially good to do this if the body of the original function was too long and doing too many things.
In my last update I talked about the dependency issues my team was having when we tried to run the codebase created last year by students. Since then, we have made very exciting progress getting this code to run. We have been trying all term to get it to run, so it’s a huge relief that it is now working.
We decided to start a new codebase and add the existing code in bit by bit. The team from last year had most of the code separated in four files. We started by trying to add the first file, which loads the map on the main page. I copy and pasted all of the code, then ran it. I would get an error about a dependency not being installed. Then, I would install the dependency and re-run the code. I kept doing this process until everything needed for the code to run was installed. I had to create a Google Maps API key in order for the API calls to work correctly. I also had to handle an error related to the search bar not being there yet. I had to temporally add a line of code to make the map render until the search bar works. I was also able to add the file that makes the search bar work. I did this the same way I added the map code and added the dependencies one by one.
Currently, the homepage is displayed and all features on it work. These features include all of the farms having a pinpoint on the map, the user can click on the pinpoint to view a pop-up about the map, and the user can search for things like crops and farms. My teammate is going to get the individual farm page to render by Wednesday, which is when V0.0.2 is due. For V0.0.2, all of the previous team’s code will be rendered, which puts us in excellent shape to begin expanding and adding new features. My teammate and I are so glad that this approach to solving the problem worked and has gone smoothly so far.
For my senior capstone class, I was assigned the Success Stories of Resilience in the Willamette Valley (Century Farms App) project. This application was started last year by students who were unable to finish it due to a small group size. Unfortunately, the team working on it this year is small too since one of the three group members had to leave the group. So, for the rest of the year I will be finishing the application with one other student.
The project sponsor is Dr. Dominique Bachelet. Mariah Goldbach is a graduate student who is doing her thesis on the Century Farms and Century Ranches in the Willamette Valley. She interviews them to learn more about them. Meetings happen once a week with Dr. Bachelet, Mariah, and all of the team members.
Currently, the application has a main screen that displays a map of all of the Century Farms and Century Ranches in the Willamette Valley. Each farm has a pinpoint on the map. The user is able to search by crop, livestock, township, etc. to filter the maps results. After clicking on a farm, the user is directed to a page that displays all of the farm’s information. This includes historic farm data, current farm data, and climate data. There is two climate graphs. One of them is for temperature and the other one is for precipitation. The graphs go from the year 1980 to 2020. All of this is displayed on a page that the user scrolls through. The team last year made excellent progress on the application given the fact that there was only two of them. However, there are still many important features that are not implemented.
Current HomepageCurrent Individual Farm Page
The Requirements
The homepage is missing a time lapse mode. This will allow users to view historic land data and future projected land data.
The map will have a soil overlay feature that will allow users to view how the soil has changed over time.
The UI of the individual farm page will be reworked with tabs so that there isn’t too much information on one page.
The graphs on the individual farm page will be extended to go from the year 1920 to 2050, as requested by the project sponsor.
An API and new database will be created from the current OCFRP database so that missing fields can be filled in and the application can easily communicate with the database.
An automated script that converts a farm’s address into geographic coordinates will be written to allow new farms to be added to the map easier.
OpenLandMap API – this will be used for the soil map overlay.
ClimateNA – this will be used to source future climate data.
Daymet – this will be used to source previous climate data.
MongoDB – the new database and API will be hosted here.
React Native – this is the primary language of the current application.
Android Studio – this will be used to emulate the application on our computers.
Planned HomepagePlanned Individual Farm Page
My Primary Responsibilities
My primary responsibilities for the application will be #3, #4, and #5 of the requirements list above. My teammate and I thought it made sense to divide the work like this so that she is mainly working on the map on the home screen and I’m mainly working on the individual farm page. However, a lot of collaboration is expected.
How It Has Been So Far
This term has all been planning so that we can be prepared to start development next term. Planning was been going well and I think my teammate and I have come up with good ways to implement the features that we need to implement. However, we are both brand new to mobile development so there’s a lot for us to learn. We have been trying to get the emulator running, but have been running into package dependency issues. These dependency issues make it so we can’t update or run anything. We may reach out to a technical resource to help us with this, or if anyone reading this knows a fix, please share. The previous team listed a professor at Oregon State (Robin Hess) as a technical resource they used throughout the year. He teaches web and mobile development so he may know how to fix these issues. My team member was also considering contacting the professor she had for web development. I think a good goal would be to have the emulator running and to have a good understanding of the current code before the start of next term.
My name is Robin Purvis and I’m a senior computer science student. Ever since I was young, I was very interested in technology, as were most people my age. I loved playing games and exploring new technologies that were coming out. When I started high school, I had no clue what I wanted to study in college. My high school had “pathways” of electives that students could choose to do. Each pathway was related to a career. Since I didn’t know what I wanted to do, I decided to try classes from every pathway. After trying most of the pathways, I found that I was most interested in computers. My high school had a a few classes that taught some Visual Basic and basic computer science concepts. After high school, I started college at Chemeketa Community College. After a few years of classes at Chemeketa, I transferred to Oregon State University to do my upper division classes. I started my studies at OSU during Winter term of 2022. I did my first two terms at OSU online due to living too far away. This Fall term is my first term on Campus because I am moving to Corvallis soon. I expect to graduate with my Bachelors Winter of 2024. However, I still don’t know exactly what I want to do after college. So far, data science has been the most interesting to me. Since I don’t have a main focus, I like exploring all of computer science.
I have one pet, which is a bearded dragon. Her name is Eliza and she’s three and a half years old. I like having a bearded dragon because they’re low maintenance. I especially like Eliza’s colors. I unfortunately don’t have more pets even though I would like many more. My hobbies include crafts, video games and many different types of puzzles.
My group’s project for our senior capstone is the Century Farms App. I am excited about building this app because of how much it relates to this local area. I have lived in the Willamette Valley my whole life and have seen signs for Century Farms, so I’m interested to learn more about them and how they have changed as the climate has changed. One of my group members left the group, so it seems like it will be me and one other people building the app, but I’m sure we’ll make do!