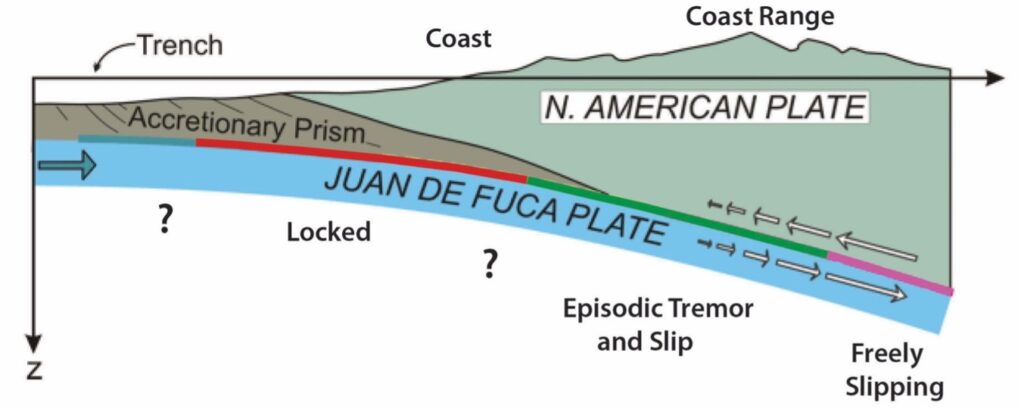
Our project aims to create a model of the subsurface to better understand the seismic hazards of the Cascadia Subduction Zone. Offshore Oregon and southwest Washington, the Juan de Fuca plate offshore is diving beneath North American plate (or, more precisely, the Oregon microplate, which is itself rotating slowly relative to the core of North America). The plate boundary is at or near the surface at the offshore “deformation front, which is visible in the seafloor elevation, and gets steadily deeper towards the east. Beneath the coastline, it is approximately 15-20 km beneath the surface, and beneath the Cascade volcanos, it is 80-100 km deep. When averaged over long periods of time (100s to 1000s of years), the subduction rate is ~4 cm/yr. At great depths, where the plates are hot, the plate motion occurs gradually and silently. At shallow depths, it can occur in rapid bursts, with meters of motion occurring within seconds (great earthquakes) separated by 10s to 100s of years when the plates are locked together. The most recent large subduction zone earthquake occurred in 1700, as indicated by a geologic evidence, indigenous oral histories, and a tsunami recorded in Japan. There appears to be a transitional depth range beneath the Coast Ranges in which the motion occurs at intervals of several months but is too slow to generate strong earthquakes. This phenomenon, known as episodic tremor and slip, was only detected in the past 3 decades, when GPS data capable of measuring it became available. One objective of our project is to image the plate boundary across this transition to provide insights into the underlying physics that can contribute to understanding whether non-destructive plate motion at this depth is loading the shallow part of the plate boundary.

In addition to this cross-sectional view of the subduction zone, modeling of the GPS data indicates that the degree to which the Cascadia fault is currently clamped varies from north to south. We seek to understand the geological reasons for this difference and how these changes may affect the way in which the Cascadia fault could break in the future. Observations from other parts of the globe, where large subduction zone earthquakes have occurred recently, indicate that segments where the plates are not fully locked can sometimes act as barriers to rupture in individual earthquakes. The magnitude of an earthquake is controlled, in large part, by the area that slipped in that earthquake. A magnitude 9+ earthquake in Cascadia must rupture the entire plate boundary at once from Vancouver Island to Cape Mendocino, CA. The relationship between subsurface geologic structure revealed by our project and the variations in how well the plates are coupled inferred from the GPS data will lead to a better understanding of how likely Cascadia is to rupture all at once.
Finally, the geologic model we derive from the data will also be used to produce more realistic models of the ground shaking to be expected from various types of earthquake. The shaking at any location depends on the nature of the rocks beneath that site. For example, sedimentary basins such as the Tualatin basin beneath Hillsboro, can focus the energy and amplify the motion at certain frequencies. Current ground shaking predictions are based on very simplified models of the geology. Our results will enable an updated set of the ground motion predictions used to define building codes and plan emergency response.
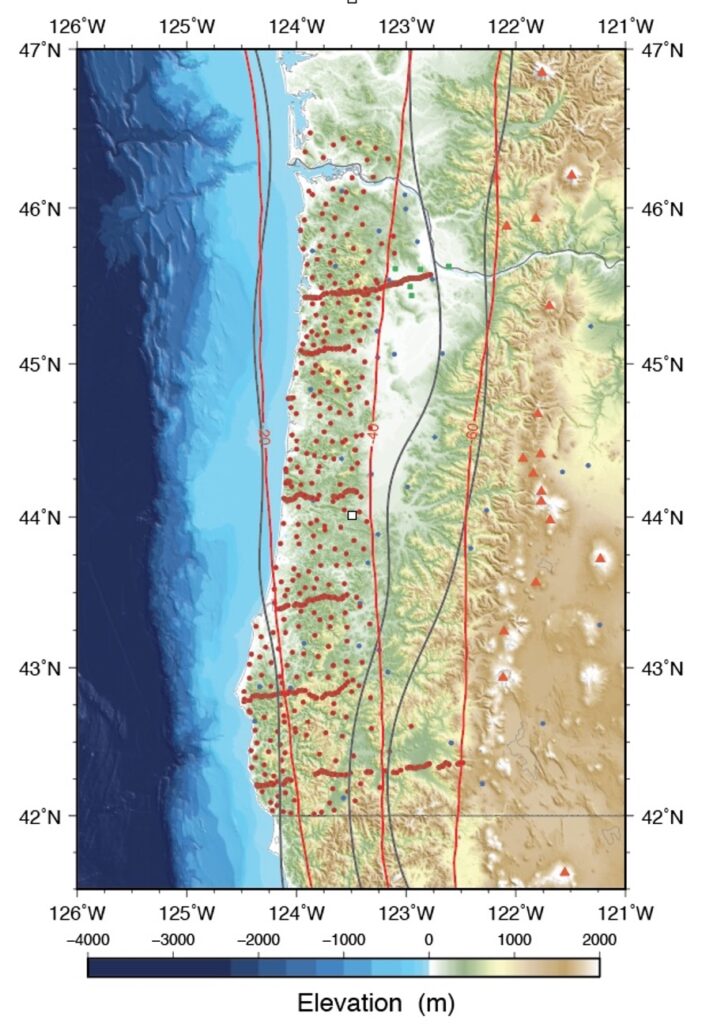
To develop our geologic model of the subduction zone, we installed 755 mini-seismometers onshore to record sound sources generated by a ship offshore. All instruments were recovered a month later. Installations and recoveries were done by teams of volunteers driving SUVs and pickup trucks provided by the OSU/UO motor pool. Volunteers were recruited from around the country and represented a diverse group that included college undergraduates, graduate students, veterans, and community college students (and one instructor). Over ½ the volunteers and principle investigators are women in a field traditionally dominate by men.
The locations of the onshore seismometers and offshore sources are shown in the map below. The grid of stations provides data that will be used to develop a 3-dimensional model of the earth beneath the Pacific Northwest. The lines of closely-spaced seismometers are extensions of lines offshore and will result in more detailed vertical slices through the 3-D model.

The data will be processed using mathematical techniques analogous to those behind medical imaging. In fact, these techniques were originally developed to image beneath Earth’s surface and then adapted for use in medicine. Several graduate students will work on the data, and we will use the parallel computer clusters at UO and OSU. Complementary studies using natural sources recorded on the onshore network will be undertaken by collaborators at the USGS and South Dakota School of Mines and Technology and elsewhere. Colleagues at the Lamont Doherty Earth Observatory in New York and at the Woods Hole Oceanographic Institution in Massachusetts will work on the marine data. Because all data are open access (i.e. available to all through the IRIS Data Management Center), we anticipate that many investigators will ultimately use the data to develop new analysis approaches, refine the geologic model for the Pacific Northwest, and improve our understanding of seismic hazards in Cascadia.
