Background:
Continental shelf systems contribute significantly to global biogeochemical cycles as the locations of large amounts of both the production and remineralization of organic matter (Jørgensen et al., 2022). The Oregon continental shelf extends 17 to 74 km from the coast and represents the bottom boundary within an Eastern-Boundary Upwelling system that experiences intense seasonally-mediated wind-driven upwelling and downwelling (Adams et al., 2016). During the summer months, typically May through October, equatorward winds induce the upwelling of nutrient rich, low oxygen waters onto the shelf (Huyer et al., 2005). The advection of these waters onto the shelf causes oxygen levels near the seafloor to frequently drop below the hypoxia threshold of 1.4 mL/L or 2 mg/L (Chan et al., 2008). Increased hypoxia holds negative consequences for benthic ecosystems (Galán et al., 2020).
The Oregon shelf also experiences large fluxes of organic matter from local phytoplankton blooms and from small mountainous rivers (Wetz et al., 2006). The variability associated with upwelling intensity and the delivery of sediment and nutrients from rivers and the surface waters influences the benthic communities of the shelf, specifically through their impacts on benthic remineralization (Berelson et al., 2003; Graf et al., 1983). Further, sediment oxygen consumption can be delayed from seasonal organic matter inputs because of a temporary buildup of reduced compounds during the summer months of hypoxia (Berg et al., 2016).
Research based on bottom water sampling and sediment core incubations:
Utilizing both water column, bottom water, and sediment data collected on cruises conducted by the Reimers Lab from 2018 through 2022 to sites on the Oregon shelf, we are working to advance understanding of the influence of benthic fluxes on the water column. This is often called benthic-pelagic coupling (Smith Jr. et al., 1983). More specifically, graduate student Anna Hughes is working on uncovering how the remineralization of organic matter within the benthic environment influences the ratios of dissolved inorganic carbon (DIC), nitrogen (as nitrate, nitrite or ammonia), and phosphorus (as phosphate) within the water column, and the associated seasonal and spatial variability in this control, along the Oregon shelf.
Water column data was collected from CTD deployments and sediment data was collected from ex situ sediment incubations of cores collected from the Oregon shelf (and in one case the Washington shelf). Data was collected from both inner and mid shelf sites, ranging in depths from 30-40 m and 60-80 m, respectively, and from cruises conducted in February, May, July, and October of 2018; January, April, and July of 2019; and July and September of 2022.
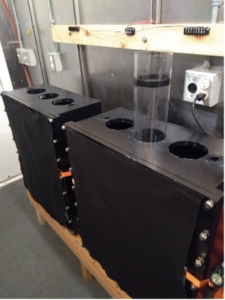
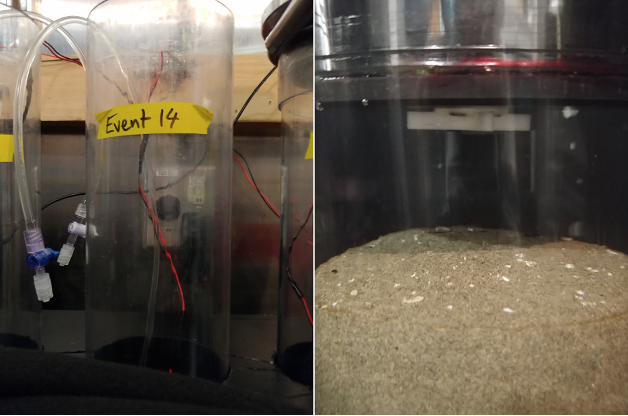
On these cruises, sediment oxygen and nutrient fluxes were measured using a unique set-up for ex situ sediment incubations, an image of the setup is shown in Figure 1. Cores were collected in duplicate or triplicate, using a slow core apparatus, and were incubated in black, covered boxes in a cold van to ensure in situ temperatures and low light conditions were maintained (Figure 1). Additionally, each core was fitted with a rubber cap, equipped with a stir bar, to ensure mixing within the overlying water, designed to ensure that the core was sealed from external contamination (Figure 2). Core caps were also fitted with a sampling tube, to allow for the measurement of oxygen within the overlying water and collection of water samples for nutrients and DIC, at set time points during the incubation which typically lasted between 24 and 48 hours. From the concentration data, in combination with measured sediment surface area and sample volume, fluxes were calculated for oxygen, nitrate, nitrite, phosphate, silicate, ammonium, sulfate, and DIC, for each core.
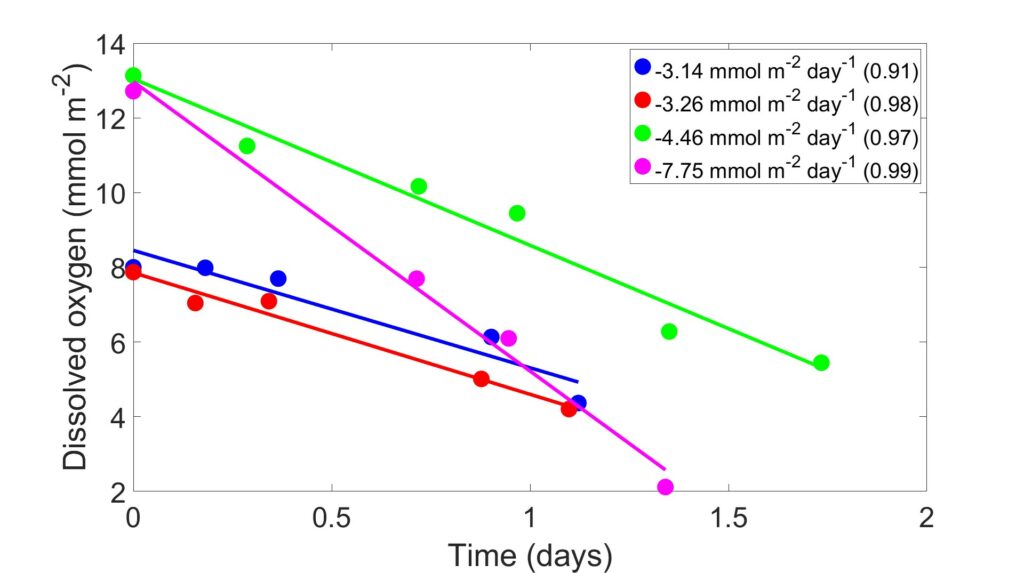
A plot showing oxygen data from a cruise conducted by the Reimers Lab in September of 2023 is shown in Figure 3. The x-axis shows time in days, while the y-axis shows millimoles of oxygen, calculated using the measured oxygen concentration and correcting for volume and surface area. Each set of points (color) represents one core, all cores were collected from a site on the Oregon shelf. The legend provides the regression information for the timepoints of each core. The slope represents the benthic oxygen flux, followed by its respective R2 in parentheses. The ratios of the products of remineralization in bottom waters reflect the mixing of source waters, benthic fluxes, and in situ respiration (Jørgensen et al., 2022). Our goal is to estimate the relative importance of these controls temporally and spatially. We are applying water mass analyses after the approach of (Lawrence et al., 2022).
References
Adams, K. A., Barth, J. A., & Shearman, R. K. (2016). Intraseasonal Cross-Shelf Variability of Hypoxia along the Newport, Oregon, Hydrographic Line. Journal of Physical Oceanography, 46(7), 2219-2238. https://journals.ametsoc.org/view/journals/phoc/46/7/jpo-d-15-0119.1.xml
Berelson, W., McManus, J., Coale, K., Johnson, K., Burdige, D., Kilgore, T., et al. (2003). A time series of benthic flux measurements from Monterey Bay, CA. Continental Shelf Research, 23(5), 457-481.
Berg, P., Koopmans, D. J., Huettel, M., Li, H., Mori, K., & Wüest, A. (2016). A new robust oxygen-temperature sensor for aquatic eddy covariance measurements. Limnology and Oceanography: Methods, 14(3), 151-167.
Chan, F., Barth, J., Lubchenco, J., Kirincich, A., Weeks, H., Peterson, W. T., & Menge, B. (2008). Emergence of anoxia in the California current large marine ecosystem. Science, 319(5865), 920-920.
Galán, A., Zirbel, M. J., Saldías, G. S., Chan, F., & Letelier, R. (2020). The role of upwelling intermittence in the development of hypoxia and nitrogen loss over the Oregon shelf. Journal of Marine Systems, 207, 103342. https://www.sciencedirect.com/science/article/pii/S0924796320300385
Graf, G., Schulz, R., Peinert, R., & Meyer-Reil, L.-A. (1983). Benthic response to sedimentation events during autumn to spring at a shallow-water station in the Western Kiel Bight: I. Analysis of processes on a community level. Marine Biology, 77, 235-246.
Huyer, A., Fleischbein, J. H., Keister, J., Kosro, P. M., Perlin, N., Smith, R. L., & Wheeler, P. A. (2005). Two coastal upwelling domains in the northern California Current system. Journal of Marine Research, 63(5), 901-929.
Jørgensen, B. B., Wenzhöfer, F., Egger, M., & Glud, R. N. (2022). Sediment oxygen consumption: Role in the global marine carbon cycle. Earth-Science Reviews, 228, 103987. https://www.sciencedirect.com/science/article/pii/S001282522200071X
Lawrence, R. M., Shrikumar, A., Le Roy, E., Swift, J. H., Lam, P. J., Cutter, G., & Casciotti, K. L. (2022). Water mass analysis of the 2018 US GEOTRACES Pacific Meridional Transect (GP15). Authorea Preprints.
Smith Jr., K. L., Laver, M. B., & Brown, N. O. (1983). Sediment community oxygen consumption and nutrient exchange in the central and eastern North Pacific1. Limnology and Oceanography, 28(5), 882-898. https://aslopubs.onlinelibrary.wiley.com/doi/abs/10.4319/lo.1983.28.5.0882
Wetz, M. S., Hales, B., Chase, Z., Wheeler, P. A., & Whitney, M. M. (2006). Riverine input of macronutrients, iron, and organic matter to the coastal ocean off Oregon, USA, during the winter. Limnology and Oceanography, 51(5), 2221-2231.