
The Buzz: Estuary Field Work, RStudio/Swirl, and The ORGN
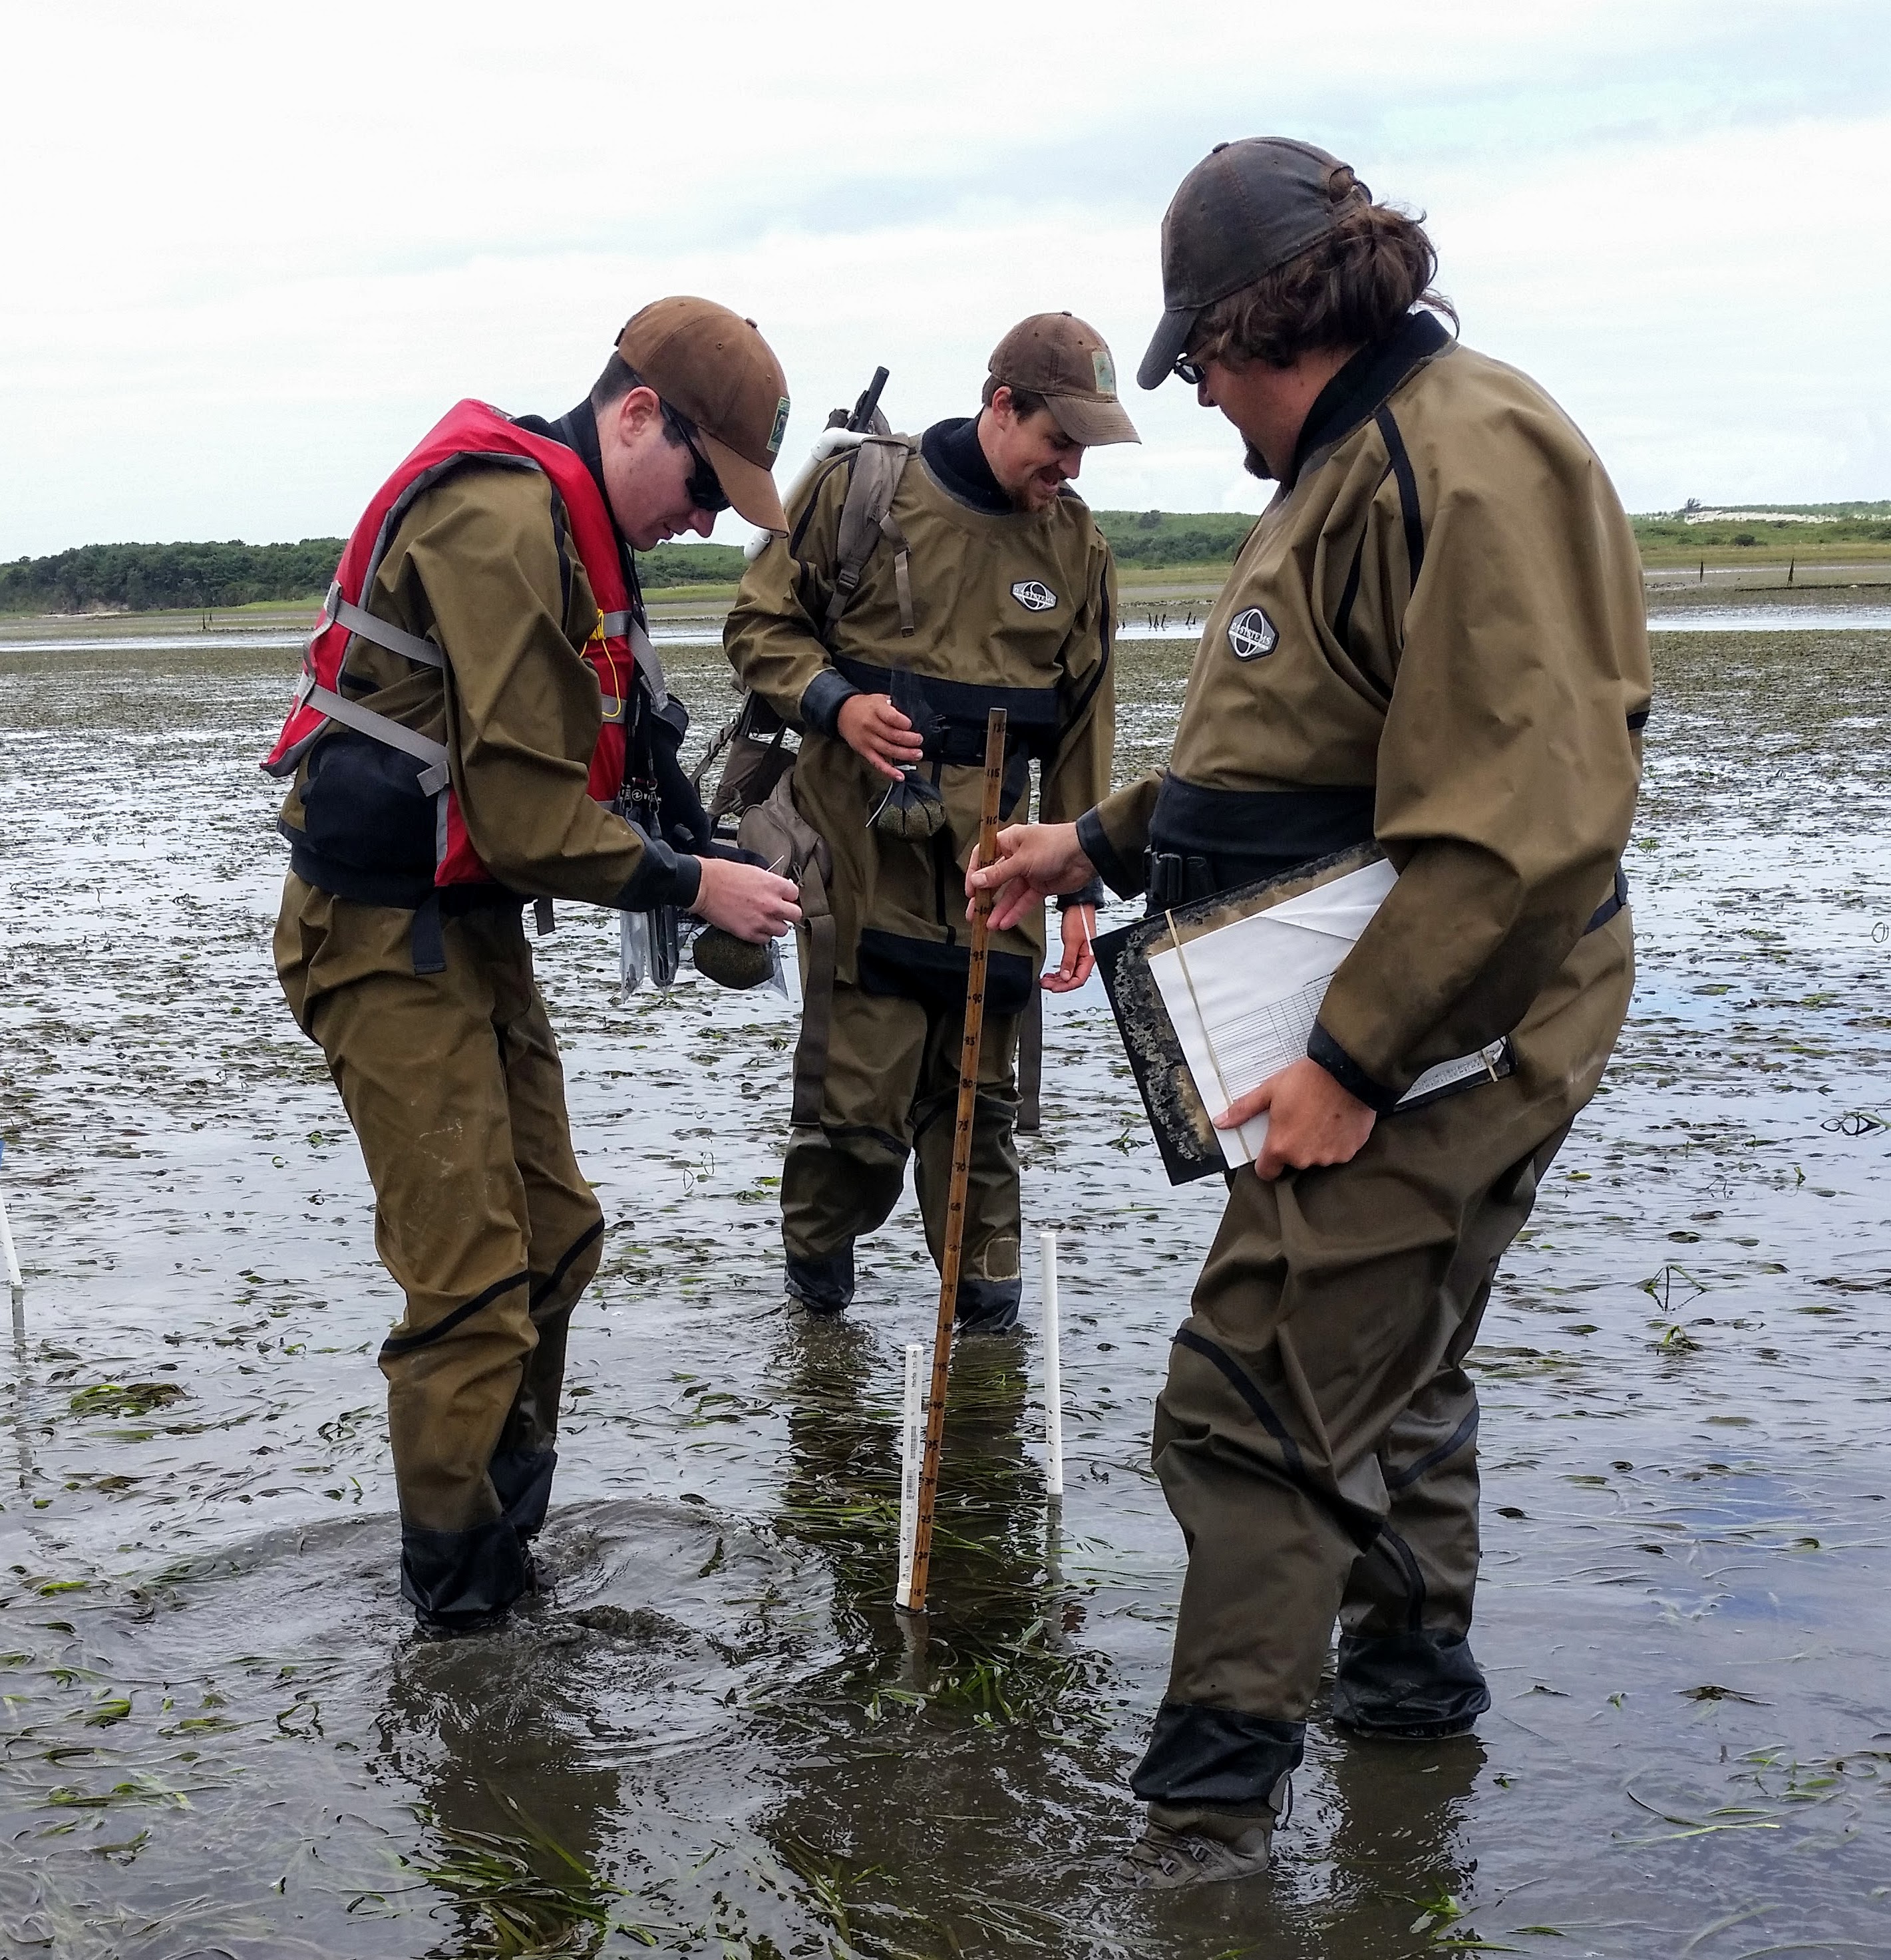
Deploying Nutrient Bags
Estuary Field Work: SEACOR’s week started early at low-tide in Netarts Bay. After a boat ride through channels inhabited by harbor seals and oyster leases, we gathered clams for the Coos Bay Clamboree and began setting up an experimental plot within a large eelgrass bed to study the potential effects of eutrophication. Armed with dry suits and military-grade backpack frames loaded with nutrient bags, PVC, and transect tapes, our objective was to set up 20 modified quadrats (a predetermined sampling area for assessing distribution of plants/animals) with randomized nutrient and control bags attached. Additionally, we collected samples of eelgrass for further analysis in a lab, took a count of eelgrass shoots per quadrat, and estimated percent coverage of eelgrass, macroalgae (seaweed), and epiphytes (plants that grow on other plants) in each sampling area. Our initial eelgrass samples will be sent off for stable isotope analysis. Ideally, eelgrass will absorb marker isotopes from the nutrient bags and provide insights into how much is being absorbed. When SEACOR returns for another site visit in 2 weeks, we will collect information on whether the nutrient bags we deployed had any effect on growth inside each nutrient-loaded quadrat compared to the control quadrats.
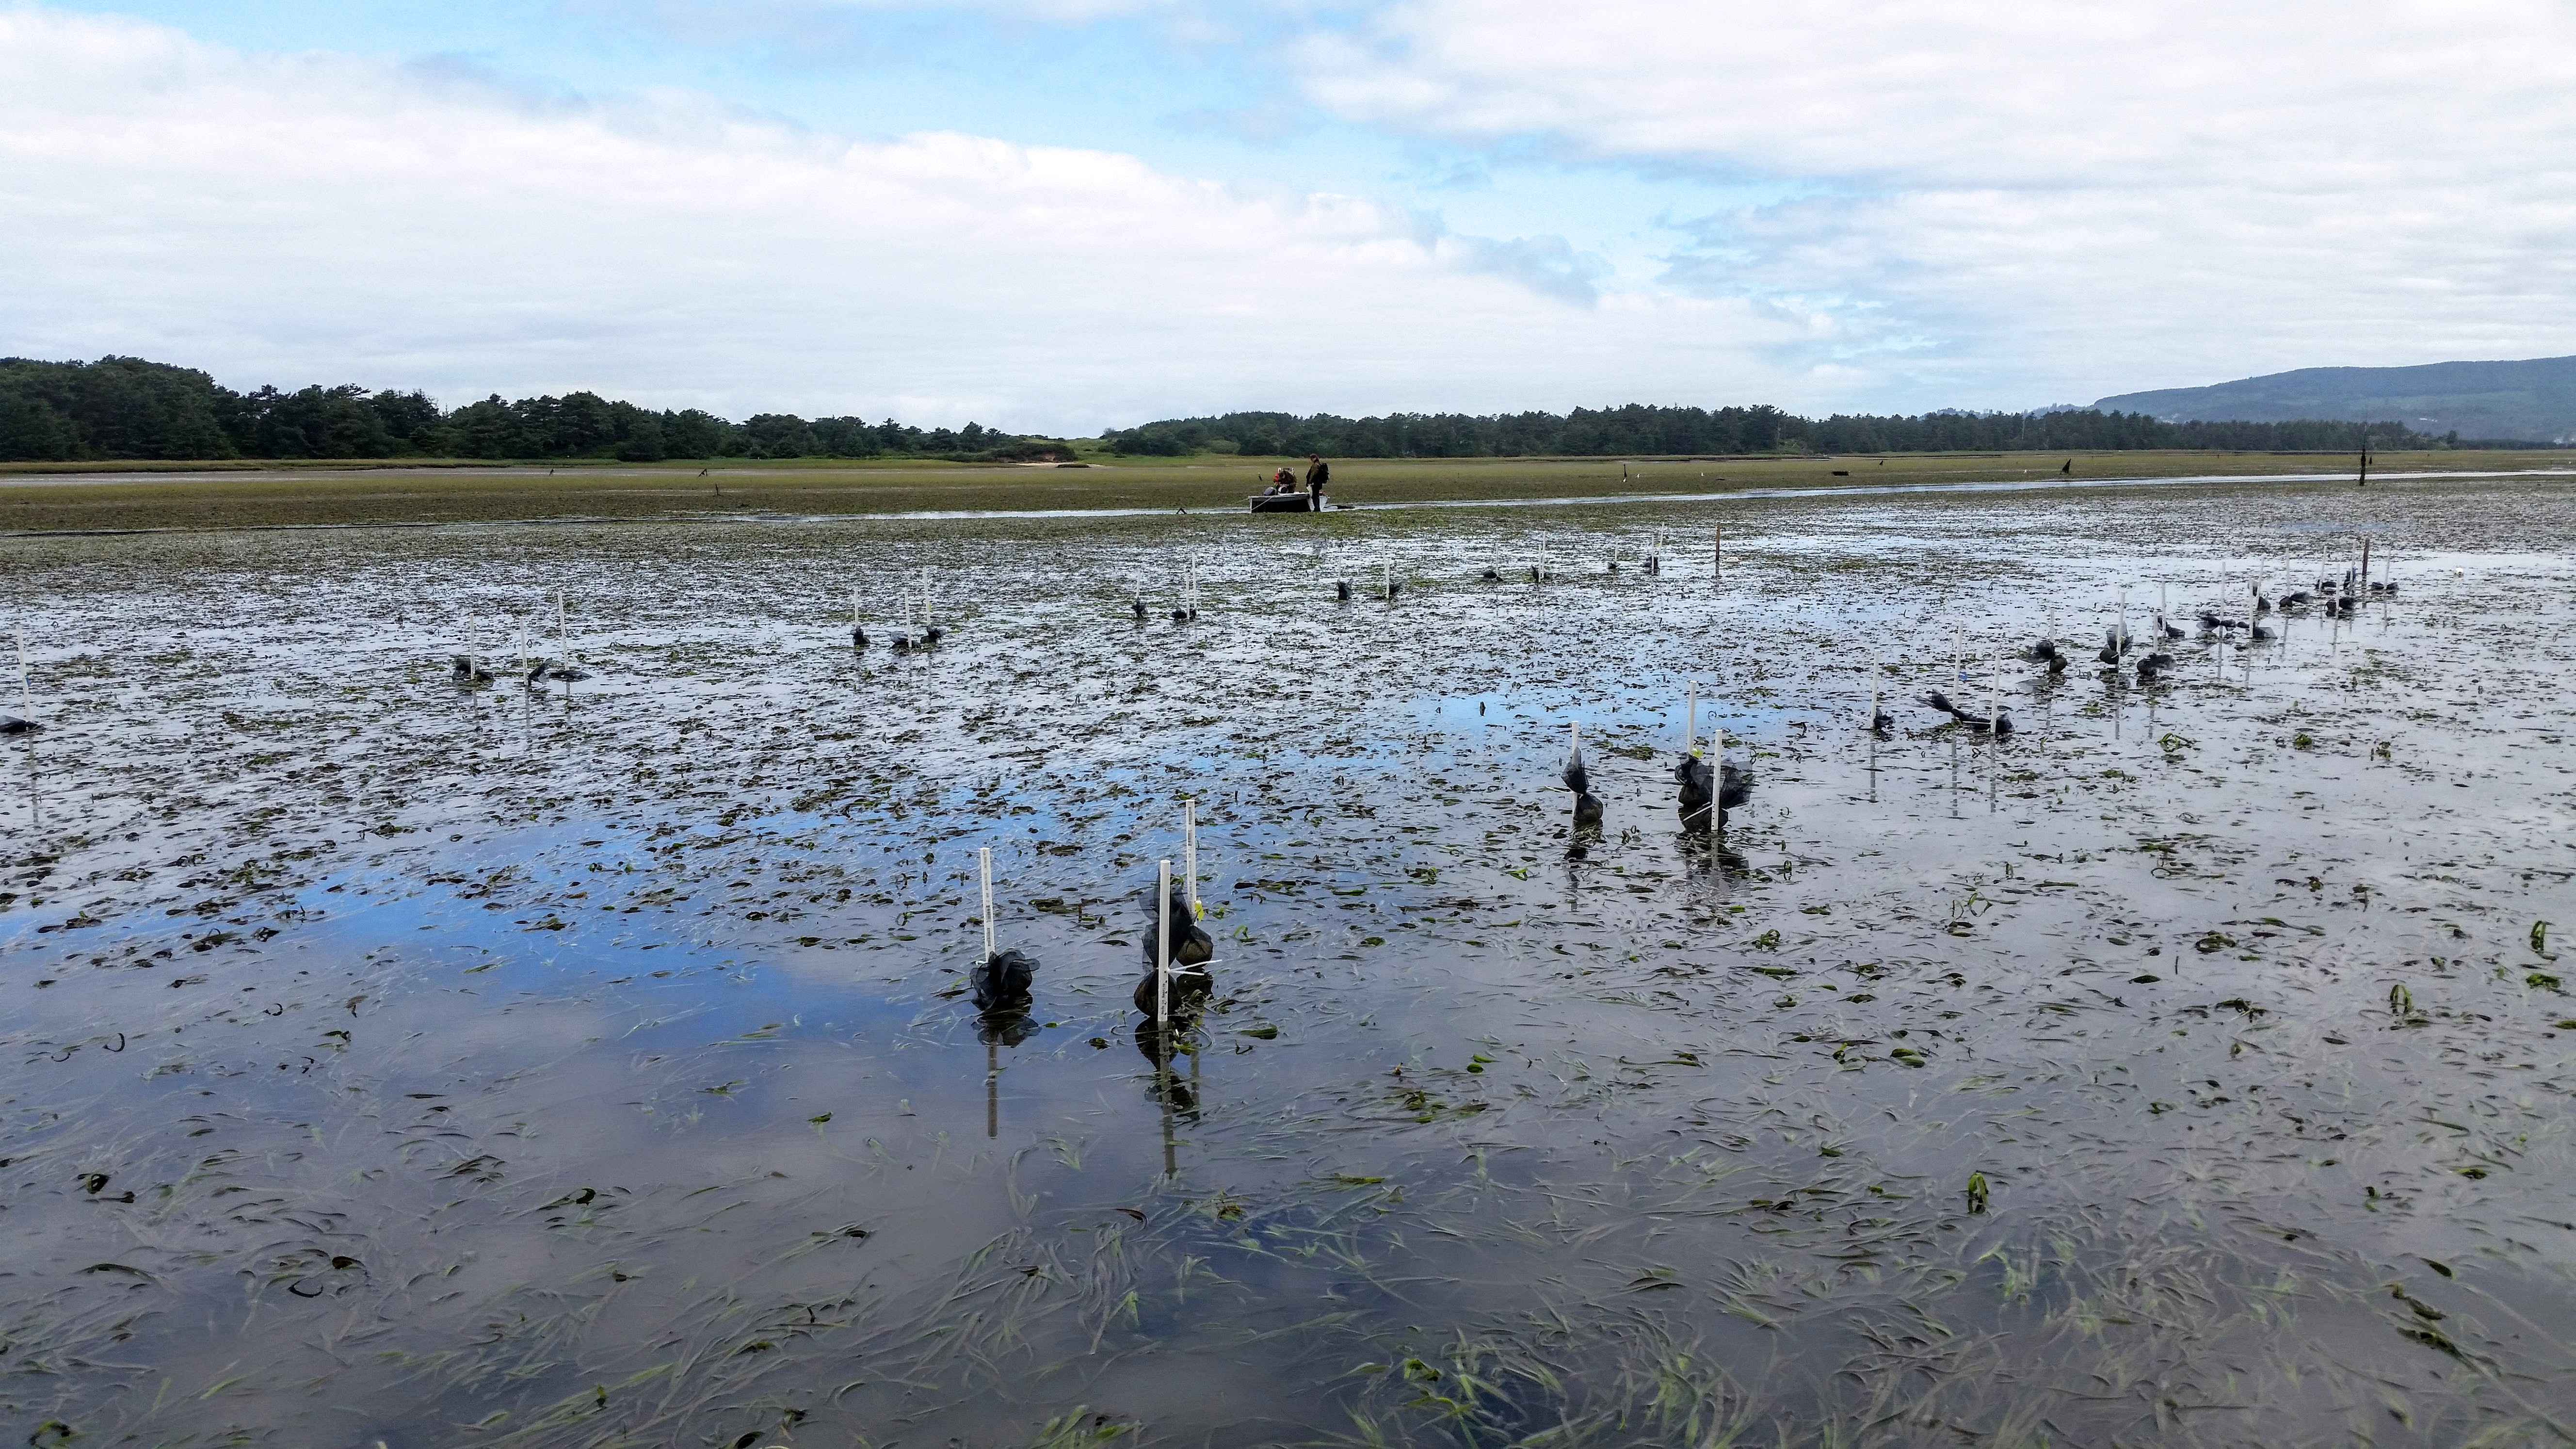
Completed Experimental Plot

Learning R in Swirl
RStudio/Swirl: The history of the programming language R may not interest most scientists who want to use it, but they do recognize R as an incredibly useful tool for statistical analysis and graphics representation (and perhaps more importantly, an open-source, cheaper alternative to MATLAB). As with any language, it cannot be learned overnight but RStudio (a development environment that simplifies writing code in R) and Swirl (an interactive learning platform that helps you learn RStudio/R with lessons in the R language itself) make any budding programmer/frustrated scientist’s efforts a little less painful. With corny phrases of encouragement like “You rock!” and “You are so good at this!” displayed for completing tasks/goals, Swirl keeps you motivated (humorously) to progress forward. Why learn how to use R? The simple answer is scientists work with a lot of data; piles of it. And in order to make sense of it all, it helps to see that data visualized graphically to evaluate trends that may not have been immediately apparent by staring at matrices or spreadsheets full of values. Additionally, the only mainstream alternative to R is MATLAB (a costly but perhaps superior product); a software platform that may be useful to many scientists, but not affordable to many as part of their research program budgets. When confronted with the decision to either not have MATLAB or have a reduced budget, R seems like an obvious choice in a world of tight research funding.

Creating Surfaces with R

Informative Graphics using R

Current Oregon Real-time GNSS Network
The ORGN: Professional-grade survey equipment is a hefty investment. Keeping guard of your equipment from theft and vandalism while it is operating is also expensive (usually in the form of some poor soul sitting next to static locations for long periods of time). Oregon State Department of Transportation has established a publicly-available network of stationary, continuously collecting GPS base stations (used to correct “roving” GPS units, or make rover measurements more accurate) that support the mainstay of GPS data collection: real-time-kinematic surveys (RTK). Without the need for each survey to field its own base station GPS, lower-budget survey operations can be conducted (granted those surveys are within the network’s coverage) because less equipment is required to operate. In this case, it allows SEACOR to utilize near centimeter-grade measurements of the UAV ground control points that we otherwise might not have access to. The high precision locations can then be utilized to reduce the amount of error and distortion introduced into our UAV imagery when used for georeferencing. The ORGN GPS devices are very similar to the ones used in the Continuously Operating Reference Station (CORS) network which is owned and operated by NGS/NOAA. The primary difference is that the ORGN provides real-time corrections via a cellular connection; the CORS network is more useful with a different GPS survey technique known as precise point positioning (PPP). PPP requires GPS units to continuously occupy a point long enough to enable post-processed calculations (not real-time calculations) to correct for errors in GPS satellite clock and orbit (this information is usually published within 24 hours after it occurs). This survey technique can achieve centimeter or even subcentimeter accuracies and is typically only used in navigation or guidance of missile/rocket trajectories, flight, or other machinery that require precise movements.
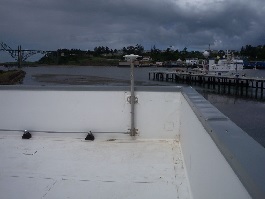
NOAA’s South Beach Continuously Operating Reference Station (CORS)
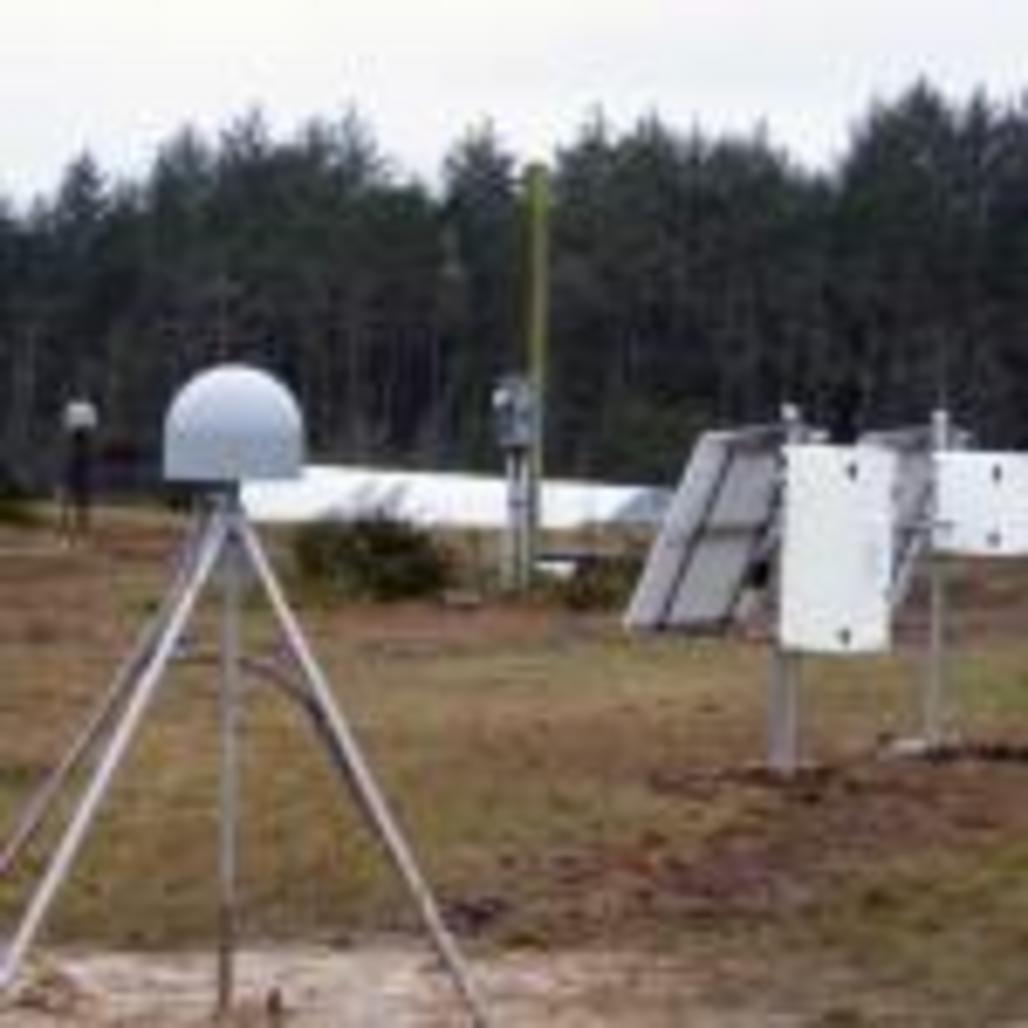
Newport Airport CORS – Station P367
Next week: Clamboree, RTK, Mission Planner, and more…

Your descriptions of the work you are doing and why what you are learning/participating in is important in a broader sense is enlightening. I learn so much every time I read your blog posts! Can’t wait to hear about how the Clamboree goes! (I love that name!)